Article Text

Abstract
Background In the USA, administrative data-based readmission rates such as the Centers for Medicare and Medicaid Services’ all-cause readmission measures are used for public reporting and hospital payment penalties. To improve this measure and identify better quality improvement targets, 3M developed the Potentially Preventable Readmissions (PPRs) measure. It matches clinically related index admission and readmission diagnoses that may indicate readmissions resulting from admission- or post-discharge-related quality problems.
Objective To examine whether PPR software-flagged pneumonia readmissions are associated with poorer quality of care.
Methods Using a retrospective observational study design and Veterans Health Administration (VA) data, we identified pneumonia discharges associated with 30-day readmissions, and then flagged cases as PPR–yes or PPR–no using the PPR software. To assess quality of care, we abstracted electronic medical records of 100 random readmissions using a tool containing explicit care processes organised into admission work-up, in-hospital evaluation/treatment, discharge readiness and post-discharge period. We derived quality scores, scaled to a maximum of 25 per section (maximum total score=100) and compared cases by total and section-specific mean scores using t tests and effect size (ES) to characterise the clinical significance of findings.
Results Our abstraction sample was selected from 11 278 pneumonia readmissions (readmission rate=16.5%) during 1 October 2005–30 September 2010; 77% were flagged as PPR–yes. Contrary to expectations, total and section mean quality scores were slightly higher, although non-significantly, among PPR–yes (N=77) versus PPR–no (N=23) cases (respective total scores, 71.2±8.7 vs 65.8±11.5, p=0.14); differences demonstrated ES >0.30 overall and for admission work-up and post-discharge period sections.
Conclusions Among VA pneumonia readmissions, PPR categorisation did not produce the expected quality of care findings. Either PPR–yes cases are not more preventable, or preventability assessment requires other data collection methods to capture poorly documented processes (eg, direct observation).
- Quality measurement
- Health services research
- Performance measures
Statistics from Altmetric.com
Introduction
In the USA, readmission rates are increasingly being adopted as hospital performance measures for public reporting and payment in an effort to improve care and decrease costs. The Centers for Medicare and Medicaid Services (CMS) posts 30-day all-cause readmission rates after discharge for three selected medical conditions (acute myocardial infarction, heart failure (HF), pneumonia) on its Hospital Compare website and penalises hospitals with excessive readmission rates under the Medicare Hospital Readmission Reduction Program.1 ,2 CMS selected these conditions because they are common reasons for hospitalisations and readmissions, result in substantial healthcare costs, and have associated evidence-based processes of care that may reduce 30-day readmissions.3–6 Despite general agreement that at least some readmissions are preventable through improved quality of care, the actual proportion is uncertain (5–79%),7 as is the extent to which they result from patient- and community-level factors that are outside a hospital's control.
Recognising the need to identify readmissions that are more likely to be preventable and therefore better quality improvement targets, 3M Health Information Systems developed the commercially available Potentially Preventable Readmissions (PPRs) software. Like the CMS measures, the PPRs use administrative data. A PPR is defined as a readmission that is clinically related to care received during or following the prior hospitalisation within a specified time interval and that might have been prevented by appropriate care.8 Specifically, a readmission is considered potentially preventable if it might have been prevented through “provision of quality care in the initial hospitalization; adequate discharge planning; adequate post-discharge follow-up; [or] coordination between inpatient and outpatient healthcare teams.”8 This definition was put into operation by clinician panels determining ‘clinical relatedness’ through pairing ‘all patient refined-diagnosis related groups’ from the index admission and subsequent readmission.8 Non-PPR readmissions are considered less likely to be preventable for reasons such as being not clinically related, or clinically related but with low preventability (eg, a patient with a bone marrow transplant readmitted with shingles after a pneumonia admission).8
Although the degree to which such paired admissions–readmissions reflect process of care deficiencies and are therefore potentially preventable is unclear, State Medicaid programmes are increasingly adopting the PPRs for public reporting and hospital payment.9–11 A recent Medicare Payment Advisory Commission analysis lent some face validity to the PPRs, as condition-specific PPR rates dropped slightly more than CMS all-cause readmissions from 2009 to 2011.12 While both CMS readmission measures and PPRs are intended for hospital-level comparisons, hospitals concerned about their rates and targeting quality improvement activities require information on preventability at the individual case level. Therefore, using the cohort of pneumonia discharges and associated all-cause readmissions identified by CMS methods, we examined whether the PPR algorithm identifies readmissions that are more likely to be preventable based on electronic medical record (EMR) review. Because software-flagged PPR cases are considered more preventable than unflagged cases, we hypothesised that they would demonstrate more processes of care failures. The Veterans Health Administration's (VA's) comprehensive highly integrated national EMR system, containing both inpatient and outpatient information, enables us to assess an extensive range of processes and include the post-discharge/outpatient setting.13
Methods
Study design
This was a cross-sectional retrospective observational study using VA administrative and EMR data from 1 October 2005 to 30 September 2010. We obtained relevant institutional review board approvals.
Data sources
We obtained inpatient information (demographics, ICD-9-CM coded diagnoses and procedures and discharge status) and outpatient encounter diagnoses from the VA's National Patient Care Database and dates of death from VA vital status files.14 We accessed VA EMR data using VistaWeb.15 We also used CMS MedPar files for selected sensitivity analyses.
Study sample
Since we were interested in how the PPR measure potentially improves upon the CMS all-cause pneumonia readmission measure, we used CMS methods, as described in previous work, to identify all VA acute index discharges with a principal diagnosis of pneumonia during FY07 through FY10 associated with a VA readmission within 30 days.4 ,16 Although the PPR measure also excludes certain admissions as ineligible because they require “follow-up care that is intrinsically clinically complex and …preventability is difficult to assess” (eg, admissions for ‘major or metastatic malignancy’),8 we retained these PPR-ineligible cases to be consistent with CMS methods, which include these cases. For similar reasons and to simplify EMR abstraction, we used CMS methods to identify index admissions associated with a single readmission, defined as the first VA acute-care hospitalisation occurring within the 30-day post-index discharge period.4 ,8 Of 68 158 index discharges, 11 278 (16.5%) were readmitted.

Study Sample. *This cut-off date, 45 days before the last day of FY2010, accounted for the 30-day span from discharge to potential readmission, plus the readmission's length of stay (95% of all hospitalisations had a length of stay <15 days). Our final sample of 100 cases represented 58 of the 124 Veterans Health Administration's (VA) acute care hospitals. The median number of cases per hospital in our abstraction sample was 1, IQR 1–3, range 1–5.
We next applied the 3M PPR software (V.28.0) to flag readmissions as a PPR (yes/no; the software also identifies ineligible cases, which we included with the PPR–no cases). We randomly selected 600 index discharge–readmission pairs for potential EMR abstraction. Our goal was to fully review 100 pairs. (We expected to exclude cases intended as CMS exclusions that were not captured by the administrative data and that might make attributing a readmission to the care associated with the index hospitalisation and/or post-discharge period harder, such as having a transfer out to a non-VA hospital. We also excluded planned readmissions, consistent with both PPR and CMS methods).4 ,8 Assuming a SD of 10 for the 0–100 quality score (described below) and a 0.05 significance level, a sample size of 100 gave us approximately 90% power to detect a half SD difference in quality scores between PPR–yes and PPR–no cases. This represents a medium effect size (ES) and, is a threshold widely used to discriminate change.17 ,18 (See figure 1 for further study sample details).
Development of explicit process criteria representing pneumonia standard of care
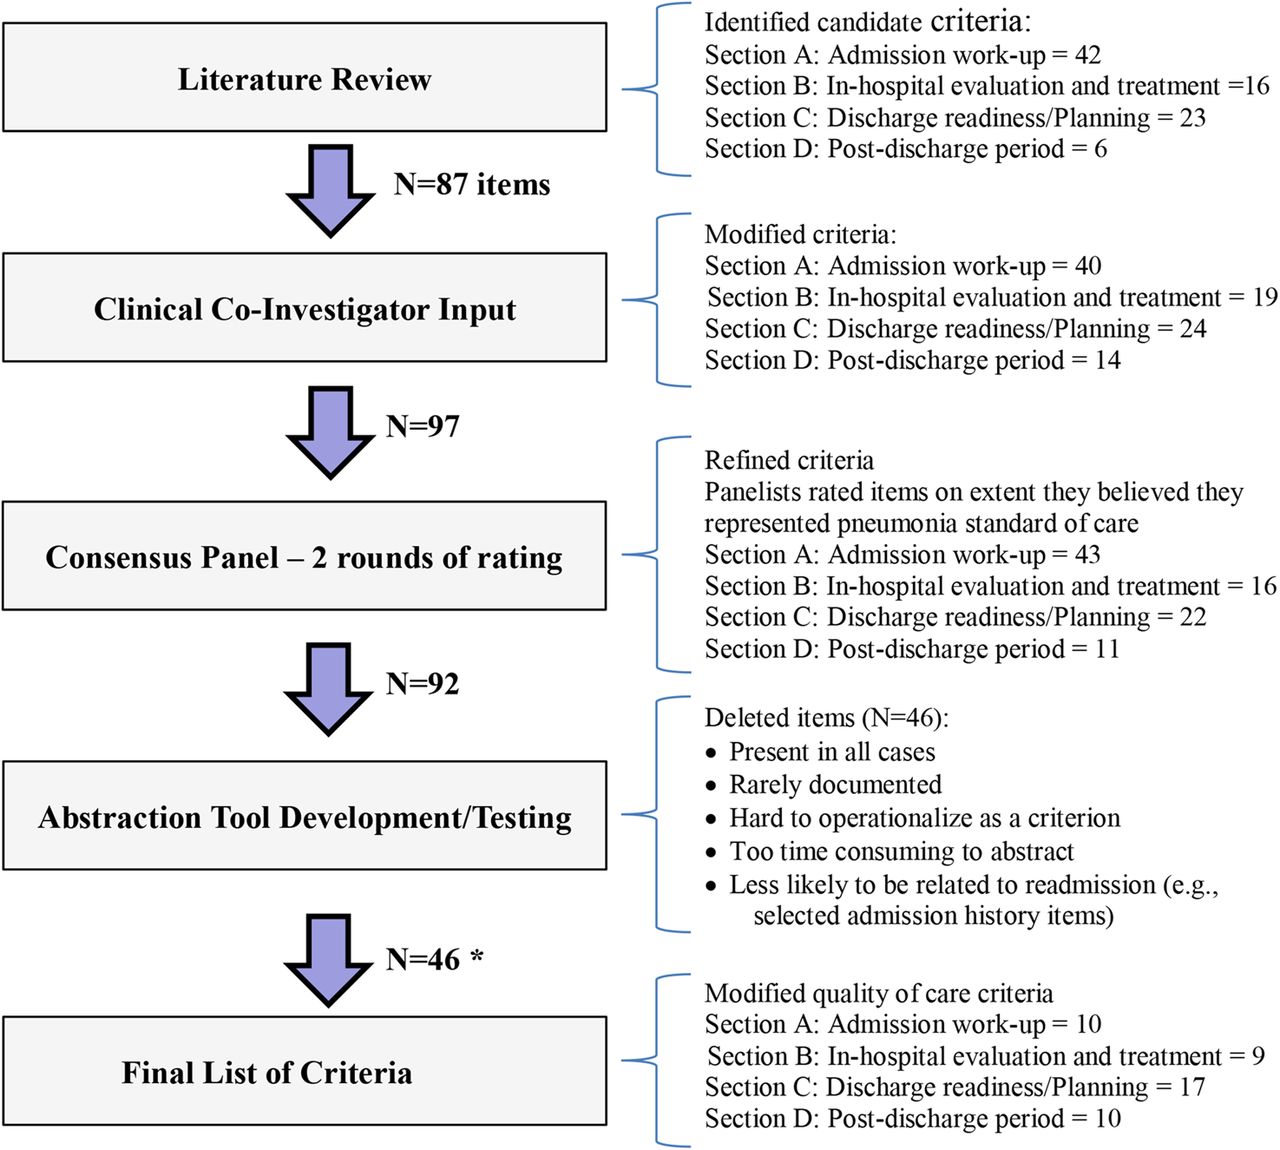
Figure 2 shows the steps involved in developing pneumonia process of care criteria. We first identified candidate criteria representing the standard of pneumonia care through an extensive literature review, including studies on pneumonia readmissions, pneumonia quality of care, and generic studies on readmission preventability (see online supplementary appendix 1), plus national pneumonia clinical practice guidelines and process measures.1 ,19–21 Clinical co-investigators helped to modify the list, yielding 97 criteria. According to previous studies, we grouped criteria into four sections: (A) admission work-up; (B) in-hospital evaluation and treatment; (C) discharge readiness (clinical stability at discharge) and planning; and (D) post-discharge period.22 ,23
Development of explicit pneumonia process of care criteria. *We also abstracted electronic medical record information in order to ascertain the diagnosis of pneumonia, as well as information on risk factors and severity of illness. These were not included in list of process of care criteria that made up the quality-of-care score.
We then refined criteria using a consensus panel model based on the RAND/UCLA appropriateness method.24 We assembled an expert panel of four internists, three pulmonologists, and three infectious disease specialists. Using an online survey, panellists rated individual items on the extent to which they believed they represented the standard of pneumonia care using a seven-point scale (1=strongly disagree, 7=strongly agree). Panellists could also propose additional items or wording changes to existing items. In line with standard RAND/UCLA appropriateness methods, we conducted two rating rounds, collating results after each round. We assessed disagreement/uncertainty based on median panellist score: <6.0 represented lack of agreement with the item, eligible for modification/re-rating; median ≥6.0 and no rating <5 represented strong agreement with the item. We kept items meeting this latter criterion without further discussion or rating. After round 1, we discussed items with disagreement/uncertainty via teleconference. Panellists then re-rated items for which there was a previous lack of agreement (n=48) and rated any added or modified items (n=5). After this process, we kept 92 items, those with strong agreement plus those with a median score ≥6.0 and only one rating <5.
Abstraction tool development/medical record abstraction
We incorporated clinical items into an abstraction tool if they could be converted to ‘if/then’ statements to assess quality of care (see online supplementary Appendix 2a for if/then statement examples). The tool also included case ascertainment items (ie, the case had to fit a clinical definition of pneumonia that included a new chest X-ray infiltrate),25 and selected items contained in the Pneumonia Severity Index score.26
Two trained nurse-abstractors reviewed the EMRs. After piloting the tool on five records, we dropped items that were present in all cases (eg, having a white blood cell count performed on admission), present in very few cases (eg, functional status documentation), difficult to use as a quality criterion (eg, the discharge summary documented recommendations for medication changes—this would require assessing whether any medication changes or lack thereof were appropriate), or time consuming to abstract/of low reliability (eg, “If a medication for a comorbidity was changed within 24 h of discharge, then post-discharge follow-up was arranged within 7 days.” We frequently found discrepancies in documentation of admission medications or in-hospital changes depending on the source reviewed making this time consuming to assess and of low inter-rater reliability). We also dropped several items pertaining to admission history documentation (unless they were relevant to appropriate antibiotic choice) since prior work showed no association between admission documentation and readmissions.22 This yielded 46 criteria (figure 2 shows the number of items in each section).We assessed nurse-abstractors’ inter-rater reliability on 20 complete records, achieving 98% observed agreement across all questions. See online supplementary appendices 2b and 5 for the final criteria and abstraction tool, respectively. (The discharge readiness/planning and post-discharge sections contained both generic and pneumonia-specific items.)
Nurses sequentially reviewed 138 of the 600 randomly chosen cases to obtain 100 fully abstracted cases. The most common reason for exclusion from full abstraction was that the patient had had a pneumonia-related admission to a non-VA hospital in the previous 30 days (n=13) (see figure 1). Clinician co-investigators (KG, JS) assisted the lead clinical investigator (AMB) in assessing antibiotic choice and dosage appropriateness from abstracted data.
Analyses
We compared fully abstracted cases with all VA pneumonia discharges with a 30-day readmission by demographics and selected Elixhauser comorbidities (using outpatient and inpatient diagnostic codes from administrative data from 12 months before the index plus the index admission), length of stay, and time to readmission.27 We also compared PPR–yes with PPR–no cases for these same variables, plus selected EMR-abstracted comorbidities. We used parametric and non-parametric tests as appropriate.
Baseline analyses
We compared PPR–yes and PPR–no cases by mean quality scores as follows: (1) we scaled scores, based on achievement of specified items (yes/no), to a maximum of 25 per section and summed scores across sections (maximum obtainable quality score=100; ‘equal section weights’); (2) we weighted individual items equally (regardless of section) and scaled total scores out of 100 (ie, total score=(number of items achieved/46 items)×100; ‘equal item weights’). Higher scores indicate achievement of more process of care items and therefore higher quality.
Sensitivity analyses
We conducted several sensitivity analyses. (1) We weighted items using the mean panel rating of the item then re-ran quality score methods 1 and 2 above. (2) We re-examined baseline results by modifying the original items either with respect to the numerator or denominator specification or dropping items with low achievement rates. For example, for one item, “the patient is ready for discharge if the white blood cell count closest to discharge is stable or falling compared with the admission value,” we modified the numerator to give a pass to cases only if the decrease was ≥20%. (3) Because 51% of all VA patients and 93% of those aged ≥65 are VA and Medicare dually enrolled,28 using CMS MedPar files, we examined the frequency of post-discharge Medicare use by PPR status among our abstracted sample and determined its potential impact on findings.
To further examine the association between the quality score and PPR status, we ran a multivariate logistic regression model predicting PPR status, including the overall ‘equal section weights’ score, adjusting for age, race, gender, and number of comorbidities.27 We repeated this using the ‘equal item weights’ score and individual section scores. We also repeated these logistic analyses excluding PPR–no cases ineligible for a PPR (n=8) (see online supplementary appendix 3, which shows PPR reasons among abstracted cases).
Lastly, to lend further construct validity to our methods, we examined quality score and time to readmission associations; we hypothesised that patients experiencing more quality of care problems would be readmitted sooner. For the full abstraction sample, we generated descriptive statistics of consecutive time-to-readmission intervals (0–3, 4–7, 8–14, 15–30 days) by quality score using equal section weights, then examined quality score and readmission time associations using a simple correlation, plus linear regression adjusting for age, gender, race, and number of comorbidities. We also re-examined PPR–yes vs PPR–no quality scores using 7- and 14-day readmission windows. We performed these analyses using (1) total quality score based on equal section weights; (2) section scores (scaled out of 25); and (3) total score without section D, since one would expect more opportunities to fulfil section D criteria the further from index discharge.
We compared PPR–yes and PPR–no group scores using t tests, and calculated ES, which is independent of sample size, for selected results to characterise the clinical significance of findings18 (Cohen defines an ES of 0.2, 0.5, and 0.8 as small, medium, and large, respectively). For multivariate logistic analyses, we examined ORs and 95% CIs.
Results
Of the fully abstracted cases, 77% were flagged as PPR–yes, versus 72% of all pneumonia readmissions (and 77% of the potential abstraction sample of 600). Table 1 shows all pneumonia discharges with a readmission versus fully abstracted cases. There were no significant differences between these groups and no obviously associated trends despite some relatively minor comorbidity prevalence differences. For fully abstracted cases, table 1 shows PPR–yes and PPR–no characteristics. Again, no differences were significant. However, there was a trend towards more comorbidities such as chronic lung disease, HF, and liver disease, among PPR–yes cases; as expected by our methodology, PPR–no cases were more likely to have cancer. PPR–yes cases were also more likely to require intensive care unit admissions or be nursing home residents. Comorbidity differences using administrative data were also non-significant (data not shown for individual comorbidities).
Characteristics of all pneumonia discharges with a readmission and abstracted sample*
PPR–yes cases had higher achievement rates than PPR–no cases on 28 of 46 process criteria, although criterion differences were not significant. Total baseline scores were slightly higher using the equal item weight method than the equal section weight method (70.4±8.7 vs 64.8±12.0) primarily because section D scores were low and contained only 22% of items. By both methods, scores were slightly higher among PPR–yes versus PPR–no cases, although differences were non-significant; however, ES were midway between small and medium for total score by both methods (>0.30) and for sections A (admission work-up) and D (0.30 and 0.40, respectively) (see table 2).
Quality scores
Sensitivity analyses: panel weights: We obtained similar results when weighting items using panel weights. Scores were slightly higher for all sections except section D, as were total scores, again with a non-significant trend towards higher scores among PPR–yes cases and slightly larger ES (≥0.40) (see table 2).
Individual item numerator/denominator modifications or deletion if low achievement rates: No item modifications or deletions had any meaningful effect on findings (data not shown; available from authors).
Potential Medicare use impact: Of the sample, 16% had Medicare outpatient claims between index discharge and readmission, representing 17% (n=13) of PPR–yes and 13% (n=3) of PPR–no cases (p=1.0). Recalculating results after removing either section D or cases with non-VA post-discharge care did not alter the findings.
Quality scores as PPR status predictors: Logistic models adjusted for demographics and comorbidities showed no significant association between quality score and PPR status (all CIs included 1.0) (see table 3). Exclusion of PPR–ineligibles from PPR–no cases did not affect these results (see online supplementary appendix 4 and table 3s).
Association of quality score and PPR status (PPR–yes vs PPR–no)
For the full sample, quality scores were higher the longer the time to readmission. This trend was most apparent for section D, but held even when section D was removed and was significant by correlations and multivariate regression modelling (see online supplementary appendix 4 and table 1s). Equal section weight quality scores by PPR-status comparisons using 7- or 14-day readmission windows were similar to 30-day results. PPR–yes scores were higher than PPR–no cases; however, associated ES were larger, especially for the 14-day comparison, with several differences of at least of medium clinical significance (see online supplementary appendix 4, figure 1s and table 2s).
Discussion
This is one of the few studies to examine whether the PPR algorithm distinguishes between good and bad quality of care at the individual case level. Among veterans readmitted after a pneumonia discharge, we found no significant difference in quality of care, as measured by processes of care received during the index admission and after discharge, between cases flagged as PPRs and non-flagged cases. Indeed, contrary to our hypothesis, quality scores were slightly higher among PPR-flagged cases.
Although both CMS and PPR measures are intended for hospital-level comparisons of risk-adjusted rates, we believe our case-level analysis is meaningful. Although both use slightly different methods to control for comorbidity, the presumption of each is that since these important drivers of readmission are controlled for, resultant high rates must be due, in part, to modifiable unmeasured factors such as quality of care.4 ,8 Thus, to try to improve rates, a hospital identified as a high outlier by either measure would have to look for more detailed information at the individual patient level to examine whether there were any quality of care problems. The PPR software attempts to improve upon the CMS measure by maximising identification of preventable readmissions (ie, those associated with quality of care problems) by matching clinically related admissions and readmissions.8 Despite this refinement, our findings suggest that the PPRs are no better than CMS measures in ascertaining which cases are preventable.
Consistent with existing studies, a large proportion of our readmissions were clinically related based on admission and readmission administrative codes and therefore flagged as PPRs (77%).30–32 Estimated preventable readmission rates from other chart review studies are generally much lower than observed rates obtained using the PPRs (5–79%, with a median of only 27%).7 Jackson et al32 recently compared potential preventability of readmission as assessed by clinical judgement based on triangulating results from EMR review and interviews with treating providers and a subset of patients and their caregivers, with the PPRs.33 They identified 47% of readmissions as potentially preventable, versus 78% by the PPRs.32 They concluded that agreement between methods was insufficient to supplant manual review.32 Others have also reported concerns about the ability of PPRs to appropriately flag readmissions that are truly preventable when examined at the individual case level.34
We intentionally measured quality of care using detailed explicit process of care information to improve the reliability and generalisability of findings and focus on items potentially modifiable by a hospital. Notably, the previously cited Jackson et al32 study used implicit review to assess preventability and included relatively few in-hospital processes of care.33 Moreover, the extent to which some of the concerns identified might have been dealt with is unclear (eg, inadequate attention to psychological or social needs was mentioned as an important problem contributing to preventable readmission in over half of their cases).32 ,33 ,35
In general, process–outcome links supported by clinical trials have been harder to demonstrate in observational studies, especially with respect to readmissions. Of the few prior studies specifically examining explicit quality of inpatient care criteria and readmission risk, none included the post-discharge period.22 ,36–38 Further, the strongest associations have been found by aggregating individual processes of care into a single score or multiple scores representing different stages of the hospital stay rather than using individual process measures and also when examining data at the patient, rather than hospital, level.22 ,37
Studies examining processes of care and readmissions of patients with pneumonia are scarce, with most focusing on few criteria. Weissman et al37 used a case–control design to examine the association between PPRs, defined as ‘related adverse readmissions’ based on clinician panel assessments of paired readmission diagnoses and readmission periods, and index hospitalisation quality of care for patients with pneumonia and HF. As in our study, charts were abstracted for several process criteria, including those related to the admission history, treatment/evaluation during the stay, and discharge readiness/stability. As we found, overall explicit quality scores in patients with pneumonia and related adverse readmissions were similar to those of other readmitted patients with pneumonia, but significantly lower than for non-readmitted patients.37 Notably, the observed association was strongest for discharge stability measures.
Other studies of pneumonia have assessed a limited number of process criteria, with relatively few examining the association with readmissions. Dean et al39 examined initial antibiotic choice at the hospital level, while Halm et al40 investigated measures of clinical stability at discharge at the patient level. Both examined the association with 30-day readmission and mortality. The former found a non-significant readmission decrease and a significant mortality decrease in hospitals that implemented a specific pneumonia antibiotic guideline.39 The latter found that having specific markers of clinical instability at discharge significantly increased the risk of both readmissions and death, with the risk increasing with the number of markers present.40
Ours is among the first studies to examine the PPRs using detailed discharge-level EMR abstracted processes of care and go beyond the inpatient period to examine post-discharge processes. Further study strengths include use of the VA EMR, allowing access to VA-wide care information and performance of multiple sensitivity analyses, which showed consistent findings. Additionally, our preliminary findings in cohorts of patients with acute myocardial infarction and HF have been similar.41
However, our study had a few limitations. (1) Our sample size might have been too small to show statistical significance. To deal with this, we calculated ES which are independent of sample size; the higher-quality scores among PPR-flagged cases represented an ES midway between small and medium, but in the opposite direction than expected.18 (Therefore, if our sample were larger, we might find that quality scores were significantly higher in PPR–yes cases but the ES should remain unchanged.) (2) We dropped certain criteria that were difficult to find and not clearly linked to hospitalisation or readmission (eg, whether an influenza vaccine was given).42 (3) We do not know whether low ‘post-discharge’ scores resulted from absence of VA care or poor EMR documentation of actual care received, although only 36% of patients had a follow-up visit to a VA provider. (4) We lacked non-VA EMR post-discharge care information. However, for both items 3 and 4, excluding post-discharge care did not change the findings. (5) Despite using a well-established consensus method to develop explicit criteria, the reproducibility of criteria selected and associated weights may vary by clinical panel.43 (6) We did not specifically abstract process information related to prevention or management of potential complications of care (eg, antibiotic-related increases in international normalised ratio in patients receiving warfarin) or management of active comorbidities (eg, diabetes).
Conceptually, the PPRs represent an attractive alternative to an administrative all-cause readmission measure such as CMS or a preventability measure based on chart review. The latter would be exceedingly resource intensive and thus impracticable for large-scale implementation. However, the problems discussed above illustrate the difficulty in using administrative data-based readmission measures, such as the PPRs, to produce information that hospitals can use to reduce readmissions. These problems would exist regardless of whether one used a measure based on ICD-9 codes as in the USA, or one based on ICD-10 codes, which are used in most other countries. Reasons for readmissions are myriad with many, such as socioeconomic factors, being difficult to modify by the hospital.35 ,44 Similarly, there may be problems in using the EMR to determine potential preventability.
Lack of EMR documentation of care, such as that delivered in the post-discharge period, is concerning. Certain processes, such as those related to patient–provider communication, may be difficult to document accurately, requiring other data collection methods such as direct observation. Nevertheless, it is important that providers are aware of the need to document all aspects of care as far as possible. Reaching out to providers, coders, and hospital senior leadership may be a necessary step in accomplishing this.
From a hospital perspective it would also be useful to be able to predict preventable readmissions in order to prevent them. At the individual readmission level, PPRs produce a categorical outcome (yes, no or ineligible). Whether the PPRs could be used to provide a probabilistic likelihood for readmission, or recalibrated/modified to identify readmissions that have a higher likelihood of being preventable, requires further investigation.
Conclusions
PPR categorisation did not reflect expected differences in quality of care received during the index admission or post-discharge period among readmitted cases. Although the PPRs represent an important step towards developing a fairer measure for hospital reimbursements than all-cause readmissions, our findings did not support their use at the individual case level. Future studies should examine whether the PPRs better discriminate quality if other data collection methods are used to capture poorly documented potentially relevant processes, or if cases are sampled from hospitals with higher and lower than expected PPR rates.
Acknowledgments
We would like to acknowledge the following individuals who assisted with this project: Carol Ashton, MD, MPH who served as a project consultant; Morris Weinberger, PhD, for assistance with study conception; Deepak Bhatt, MD, MPH and Anand Kartha, MD for assistance with development of clinical criteria; Kathleen Hickson, RN, PhD and Sally MacDonald, RN for assistance with development of the abstraction instrument and associated guidelines, as well as data abstraction and cleaning; Bill O’Brien, MS for programming assistance; Kathleen Ryan, RN, MPH for project management and assistance with literature review, Marshall Goff, BA, for assistance with graphics, and 3M Health Information Systems for giving us the PPR software. We would also like to thank our expert panel members for assistance with refining our clinical criteria: Suzanne Bradley, MD; John Downs, MD; Graeme Fincke, MD; Eric Garshick, MD, MPH; Peter Kaboli, MD, MS; Joel Karlinsky, MD, MBA; Valerie Lawrence, MD; Marcos Restrepo, MD, MSC; David Thornton, MD, MS; Jeffery Whittle, MD, MPH.
References
Supplementary materials
Supplementary Data
This web only file has been produced by the BMJ Publishing Group from an electronic file supplied by the author(s) and has not been edited for content.
- Data supplement 1 - Online appendices
Press release
Press release
Files in this Data Supplement:
Footnotes
Contributors Study conception and design: AMB, JR, AH, AK. Acquisition of data: AMB, QC, HJM. Analysis and interpretation of data: AMB, QC, JR, HJM, MS, KG, JS, AK. All authors were involved in drafting or critical revision of the manuscript, gave final approval of the version to be published, and agree to be accountable for all aspects of the work.
Funding This work was funded by the US Department of Veterans Affairs Health Service Research and Development Service, grant No IIR 09-039.
Competing interests None declared.
Ethics approval The Boston VA and Bedford VA institutional review boards.
Provenance and peer review Not commissioned; externally peer reviewed.
Data sharing statement Scores for individual items and results of additional sensitivity analysis mentioned in the paper but not reported (individual item numerator/denominator modifications or deletion if low achievement rates) may be available to any interested parties by sending a request to the corresponding author.
Linked Articles
- Editorial
- Correspondence
- Correspondence