Article Text

Abstract
Background When patient safety climate (PSC) surveys are used in healthcare, reporting typically focuses on PSC level (mean or per cent positive scores). This paper explores how an additional focus on PSC strength can enhance the utility of PSC survey data.
Setting and participants 442 care providers from 24 emergency departments (EDs) across Canada.
Methods We use anonymised data from the Can-PSCS PSC instrument collected in 2011 as part of the Qmentum accreditation programme. We examine differences in climate strength across EDs using the Rwg(j) and intraclass correlation coefficients measures of inter-rater agreement.
Results Across the six survey dimensions, median Rwg(j) was sufficiently high to support shared climate perceptions (0.64–0.83), but varied widely across the 24 ED units. We provide an illustrative example showing vastly different climate strength (Rwg(j) range=0.17–0.86) for units with an equivalent level of PSC (eg, climate mean score=3).
Conclusions Most PSC survey results focus solely on climate level. To facilitate improvement in PSC, we advocate a simple, holistic safety climate profile including three metrics: climate level (using mean or per cent positive climate scores), climate strength (using the Rwg(j), or SD as a proxy) and the shape of the distribution (using histograms to see the distribution of scores within units). In PSC research, we advocate paying attention to climate strength as an important variable in its own right. Focusing on PSC level and strength can further understanding of the extent to which PSC is a key variable in the domain of patient safety.
- Evaluation methodology
- Healthcare quality improvement
- Safety culture
- Social sciences
This is an Open Access article distributed in accordance with the Creative Commons Attribution Non Commercial (CC BY-NC 4.0) license, which permits others to distribute, remix, adapt, build upon this work non-commercially, and license their derivative works on different terms, provided the original work is properly cited and the use is non-commercial. See: http://creativecommons.org/licenses/by-nc/4.0/
Statistics from Altmetric.com
Patient safety climate (PSC) remains important and problematic, and we continue to struggle with how to improve it.1 In part, this is because practitioners and researchers alike are examining it incompletely. By and large, the PSC literature defines PSC as shared perceptions among group members concerning the procedures, practices and kinds of behaviours that get rewarded and supported with regard to patient safety (PS).2 When defined this way, group-level climate is the focus (eg, data collected from 20 nurses in one intensive care unit (ICU) may be averaged to create an ICU safety climate score) and measuring and reporting safety climate perceptions requires group-level analysis. There is a well-developed body of organisational literature on team composition models3 that speaks to how a construct at one level, such as individual-level climate perceptions gathered using a survey, is related to that construct at another level (ie, group climate). There are competing views as to whether a consensus or a dispersion model should be used to measure climate.
In a direct consensus model, PSC is conceptualised as a shared team property—a common perception of safety among all the members of a department.3 Consensus or agreement among the individuals in a group is in fact considered a prerequisite to accurately measuring the unit/group climate: most members of the group must agree in rating the safety climate as poor, average or excellent in order to describe the unit as having a negative, neutral or positive climate in the first place. Rwg(j) is a measure of within-group agreement that ranges from 0 (indicating no agreement) to 1 (indicating perfect agreement).4 It shows the extent to which members of a work unit provide the exact same numerical rating on the questions of a PSC survey. In the direct consensus model, sufficient levels of within-group agreement (typically measured using the Rwg(j)5) and between-group variability (typically measured with intraclass correlation coefficient (ICC)(1)) are required before individual-level survey data on climate perceptions can be aggregated to and analysed at the group level. Aggregation typically occurs by simply averaging climate scores reported by the unit's members. As noted, the PSC literature has largely taken this consensus approach.6–10
In dispersion models, on the other hand, variability among individuals is the focal construct. Variability refers to the degree of disagreement among members regarding their unit's safety orientation. Schneider et al11 argue that variability or dispersion itself has received limited attention (or has been treated as a ‘statistical hurdle’ to aggregation). They argue that within-group variability provides a reflection of climate strength, which is a useful concept in organisational research, a point reinforced by LeBreton and Senter.12 One of the same metrics used to justify pooling work unit data, the Rwg(j) measure of agreement, is also the most common measure of climate strength. Low Rwg(j) for a particular unit indicates a weak climate (lack of staff agreement on a PSC survey), while high Rwg(j) for a unit indicates a strong climate (high agreement on a PSC survey). It is important to stress that climate level and climate strength are different: units can have a strong negative safety climate, a weak negative safety climate, a strong positive safety climate, and so on across all combinations.
Related to the dispersion model, there is also meaningful information about a unit's PSC that can be seen in the shape of the distribution of individual safety climate opinions.13 Units that do not ‘agree’ on PSC according to standard statistical criteria (low agreement, eg, Rwg <0.50) may do so in more than one way. Imagine two units who have very low agreement about their own safety climate: The first unit's shape of disagreement is such that extreme subgroups exist: half of the staff ‘strongly disagree’ that there is sufficient focus on safety, and half the staff ‘strongly agree’. In contrast, imagine a second unit whose shape of disagreement is ‘uniform or rectangular’ such that an equal number of staff endorse the full gamut of responses from ‘strongly disagree’ to ‘strongly agree’. Strengthening safety climate at the first unit may hinge on understanding the staff subgroups, while for the second unit a broader approach may be most critical.
Paying greater attention to climate strength could enhance our understanding of PSC and its effects in organisations in several ways. First, drawing on Mischel's14 work on situational strength, Schneider and colleagues11 point out that consideration of climate strength is important because when climate is strong (ie, there is strong agreement among group members about the level of safety climate in their work area) behavioural expectations are clear and this facilitates more uniform staff behaviours. Schneider and colleagues11 tested whether behaviour predictions will be more reliable when climate is strong in the context of employee service climate. In addition, they suggest “that the continuity over time of a climate or a culture will be a function of the strength of climate or culture”11—strong climates will persist, while weaker ones may not. This perspective suggests we should focus not only on how to change climate but also on how to strengthen it. Indeed, Singer and Vogus15 suggested in a recent BMJQ&S editorial that the field would benefit from studies that examine the factors that affect climate strength (in addition to climate level). A focus on climate strength may also reveal that climate level and climate strength have different antecedents, impact safety outcomes in different ways and/or interact together to influence outcomes.
Literature on climate strength is slowly emerging. In particular, papers on climate strength as a moderator of the climate–performance relationship are increasing and much of this work has shown that the climate–outcomes relationship is strongest when climate strength is high11 ,16 ,17 (ie, when there are high levels of agreement among group members about a workgroup's climate). An added focus on climate strength may, therefore, help pinpoint optimal places in the system to intervene where receptivity may be greater and safety changes more easily implemented.
Zohar's study of Israeli ICUs18 led him to characterise healthcare climate as a ‘compound construct’ whose elements of level and strength interact. Failure to recognise this can cause us to miss important relationships that exist. Others4 ,10 ,11 acknowledge that discussion of patterns of within-group agreement in climate ratings is relatively rare yet important and that consensus or strength of climate within a group provides insight into the consistency of behavioural expectations and is therefore likely to predict actual safety behaviours in a work unit.
Despite advances in attending to the multilevel nature of safety climate data,6–8 ,19 the vast majority of papers on safety climate in healthcare still pay limited attention to level of analysis issues. In particular, there is almost no work that has looked at climate strength as a focal construct in the healthcare literature (see Hughes et al10 for a possible exception).
The purpose of the present study is to explore what an examination of climate strength in healthcare can tell us and how this can advance the utility of PSC survey data. Rather than focusing only on units with strong consensus/agreement, we propose that researchers and practitioners should take a closer look at the full range of healthcare units, including also those that only moderately agree, or who markedly disagree, in their assessment of safety climate dimensions. We will argue that integrative knowledge about units’ safety climate level (eg, mean response among unit members), safety climate strength (agreement among unit members) and the shape of a unit's agreement (eg, are there clear subgroups?) is needed for a full understanding of a unit's climate and to inform best intervention strategies for improving or maintaining a productive PSC.
Methods
In this study, we used Can-PSCS20 (previously called the Patient Safety Culture Tool) data collected from staff in a large, cross-sectional sample of Canadian healthcare organisations. Survey data were collected in 2011 by Accreditation Canada as part of the Qmentum accreditation programme.21
Sampling and procedures
Accreditation Canada provided the lead author with all anonymised Can-PSCS data collected between April and October 2011 as part of the Qmentum accreditation process. The complete data set included data from 13 126 survey respondents working in 119 healthcare organisations. These 119 organisations represent the continuum of care, and the 13 126 direct care providers work in hospitals (28%), nursing homes (32%), ambulatory and community-based health organisations (14%), home care agencies (5%), mental health (7%) and other settings. The majority of hospitals and a large proportion of other healthcare organisations in Canada participate in the Accreditation Canada process, which operates on a 4-year cycle. Details of the survey process have been reported previously.20
In the present study, we used data from 442 direct providers working in 24 emergency departments (EDs) across Canada that had ≥10 respondents (reporting by unit was available to organisations that had set up this variable in their online Accreditation Canada portal). We included EDs with a minimum of 10 respondents so we would have a sufficient number to examine within-group agreement12—the emphasis of this paper. The number of responders ranged from 10 to 35 among the 24 EDs (mean n=18.4, SD=7.8). EDs are also well-suited to our investigation of the information value of climate strength because they are characterised by time-urgent, unstable workflows that can benefit from clear behavioural expectations that exist in strong climates.
Survey instrument
The Can-PSCS captures staff perceptions of PSC. The survey contains 19 items that measure six dimensions of PSC: (1) organizational leadership support for safety (four items), (2) incident follow-up (three items), (3) supervisory leadership for safety (two items), (4) unit learning culture (four items), (5) enabling open communication I: judgement-free environment (three items) and (6) enabling open communication II: job repercussions of error (three items). These areas are consistent with robust models of safety climate that have been shown to predict safety outcomes.18 ,22 Some of the Can-PSCS items are unique and others were adapted from work by Singer et al,23 Hofmann and Mark22 and the Agency for Healthcare Research and Quality PSC survey.24 All items are answered using a five-point Likert-type scale (1=strongly disagree, 2=disagree, 3=neutral, 4=agree and 5=strongly agree) and include a ‘not applicable’ option. The Can-PSCS has been validated for use with direct care providers in a wide range of care settings.20
Analysis
To explore the value of paying greater attention to climate strength in safety climate research, our analyses calculated for each ED unit (1) climate level (mean and median score per unit on each Can-PSCS dimension of safety climate), (2) climate strength (because the six Can-PSCS dimensions are multi-item scales, we calculate agreement as Rwg(j) per unit—see the online supplementary technical appendix—Rwg distributions section for details) and (3) the shape of agreement about safety climate (a frequency chart per unit on each of the six Can-PSCS dimensions). For the data set as a whole, we also calculated the ICCs (ICC(1) and ICC(2)).
These metrics provide an indication of within-group agreement (Rwg(j)), within-group and between-group variability (ICC(1)) and the reliability of group means (ICC(2)). As noted, Rwg(j) is a measure of absolute agreement in the ratings endorsed on a PS survey by the members of a work unit.4 Values of 0.70 are typically used as cut-offs for determining whether within-group agreement is sufficient to justify aggregation. Rwg(j) values between 0.51 and 0.70 indicate moderate agreement, and values ≥0.71 suggest strong agreement.12 In situations with multiple climate ratings for different units or organisations, ICC(1) tends to be interpreted as the extent to which individual ratings can be explained by group membership—like an effect size for unit membership with ≥0.05 indicating a substantial group effect.12 James25 argues that ICC(1) is the critical metric for deciding whether to aggregate climate perceptions. ICC(2) is a reliability measure and answers the question: “How reliable are the group means within a sample?” It ranges from 0 to 1, and values of ≥0.70 are typically interpreted as sufficiently reliable to aggregate unit members’ perceptions.12 We provide these metrics for each of the six Can-PSC dimensions and use the results as a platform to explore the information value of climate strength and suggest ways that researchers and organisations can better exploit PSC survey data. For fuller discussion of each of these measures, and alternatives to them, please see the online supplementary technical appendix—section 2.
Finally, we generate simple histograms of climate scores on two dimensions for pairs of contrasting EDs that achieved similar mean climate scores (ie, similar levels of climate) but quite different degrees of climate strength. We do so as an illustrative example of how we can look at strength of climate and how consideration of strength of climate can add to knowledge of PSC level in a given setting.
Results
Table 1 summarises, across all ED units, the PSC dimension means and SDs, ICC(1), ICC(2), as well as median and range (lowest to highest) of Rwg(j). Column C shows that median Rwg(j) values approach or exceed 0.70 for all six PSC dimensions. It is important to note that Rwg assesses the extent of consensus/agreement within a single unit (in this case, an ED)—‘a construct by group approach’,4 so a median Rwg of 0.76 for the organisational leadership support for safety dimension means that half of the EDs in our sample had Rwgs >0.76 and half were <0.76. In other words, within-group agreement varied by ED, as can also be seen by their wide range across units (table 1, column D). The lower bounds for Rwg(j) (table 1, column C in parentheses) are quite a bit lower (readers interested in more technical aspects of Rwg distributions, see the online supplementary technical appendix—section 1).
PSC dimension agreement indices
As noted, within-group agreement can also be tested with ICC(1) (amount of variance explained by unit membership) and ICC(2) (reliability of unit means). Unlike Rwg, ICC(1) contrasts within-unit and between-unit variability across an entire sample of units—‘a construct by sample approach’.4 Results for ICC(1) and ICC(2) were good to acceptable for four of the six PSC dimensions—organisational leadership support for safety, incident follow-up, supervisory leadership for safety and unit learning culture—but low for judgement-free environment and job repercussions of error (see the online supplementary technical appendix—section 4 for a discussion comparing ICC and Rwg results across the Can-PSC dimensions).
Neither Rwg(j) nor ICC tests the statistical significance of within-group agreement. However, statistical criteria have recently been proposed for Rwg26 and one-way random effects analysis of variance (ANOVA) is typically used to test between-group variance for ICC(1)—readers interested in these results, see the online supplementary technical appendix—section 3.
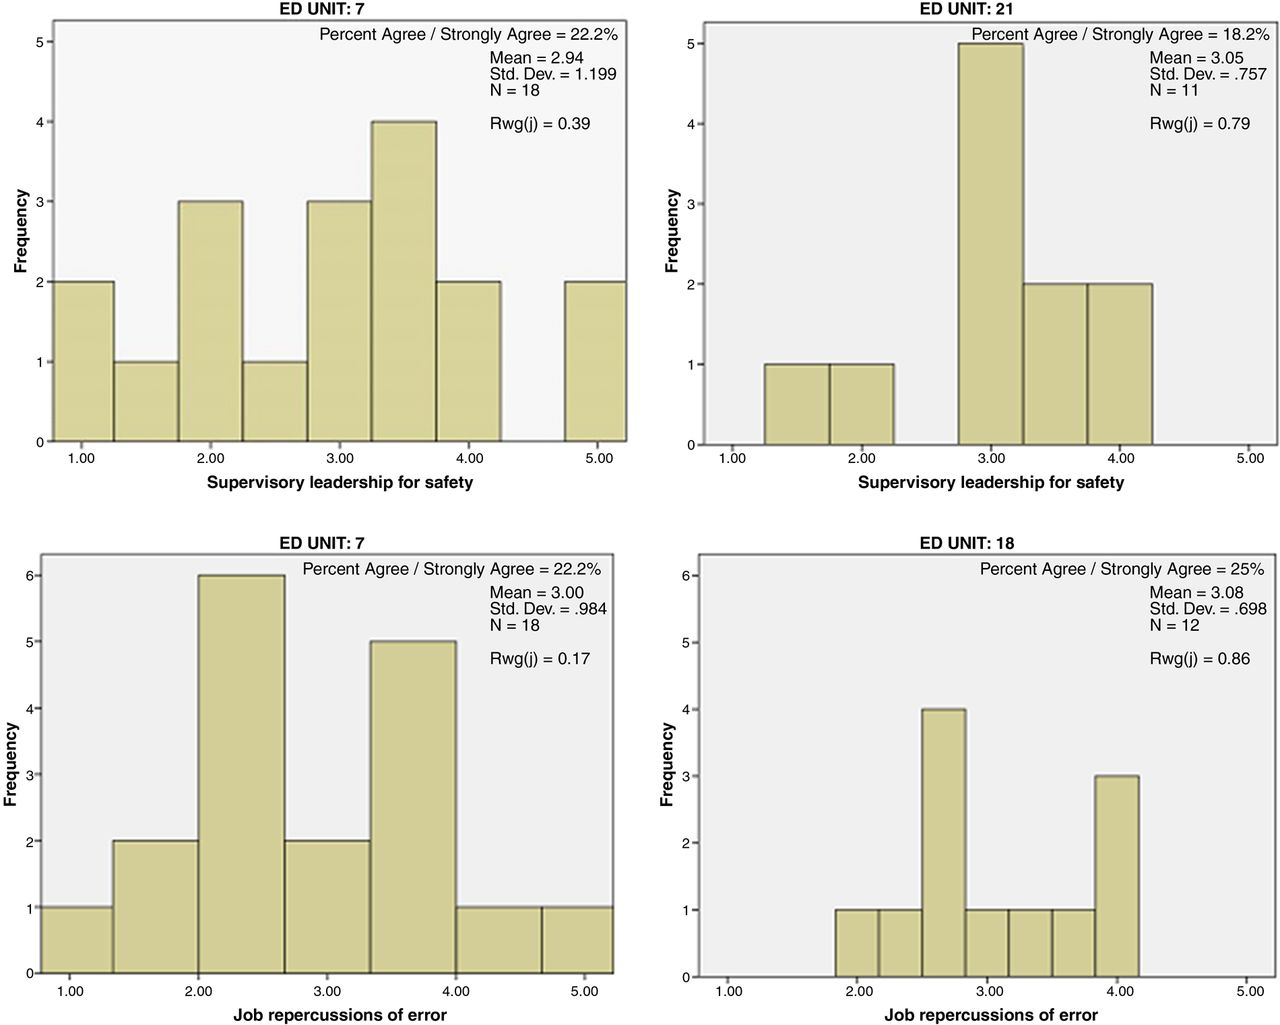
Figure 1 provides histograms for a few EDs that achieved similar mean climate scores (ie, similar climate level) but quite different degrees of climate strength. The histograms provide an illustrative example of what can be gained by looking at climate strength as a focal variable. The top two histograms show the distribution of scores on the supervisory leadership for safety dimension for two EDs, both with mean ED scores around 3.0. ED 7 (top left) had an Rwg=0.39 while ED 21 (top right) had an Rwg=0.79. The bottom two histograms show the distribution of scores on the job repercussions of error dimension for two EDs with mean scores around 3.0. ED 7 (bottom left) had an Rwg=0.17 while ED 18 (bottom right) had an Rwg=0.86.

Illustrative example of climate strength differences. ED, emergency department.
We can also examine the above histograms in the context of other approaches to reporting PSC data that present the proportion of respondents on a unit or in an organisation who ‘agree’ or ‘strongly agree’ with items in a PSC dimension—typically described as the proportion who report ‘positive safety climate’. The percentage of respondents who reported a ‘positive safety climate’ on these two pairs of units were very similar (22.2% and 18.2% for supervisory leadership for safety on units 7 and 21, respectively; 22.2% and 25% for job repercussions of error on units 7 and 18, respectively).
Discussion
Taken together, our results provide an illustration of the information value lost if we do not consider climate strength when interpreting PSC data from multiple health care units. The range of inter-rater agreement (Rwg) values across the 24 EDs in our sample was very broad, for example, ranging from 0.17 (indicating no agreement) to 0.86 (indicating strong agreement12) across EDs on the job repercussions of error dimension. Yet, because the median values of agreement (Rwg calculated with a uniform null) exceed 0.70 for all dimensions except for supervisory leadership for safety (median Rwg=0.64), a common practice is to say that staff respondents agree sufficiently in their climate perceptions to aggregate individual-level data to the group level, that is, to let the unit mean on the dimensions be the focus of analysis and feedback (assuming ICCs also justified aggregation). Another common practice is to simply remove the individual ED units that do not meet criterion for good agreement (Rwg <0.70) before analysing and interpreting climate data.12
However, both of these common approaches ignore the units whose staff fundamentally disagree about safety climate perceptions either by treating them as if they agree or by throwing out units with low agreement. We suggest this is an enormous missed opportunity to understand and to impact PSC. Climate strength (measured as group agreement about climate) varied markedly across the ED units in this study, even when demonstrating similar mean levels on PSC dimensions, as seen in figure 1. The unit graphed on the left side of both panels, ED unit 7, had staff endorse the full range of the response scale from 1=poor PSC to 5=excellent PSC, although it scored around the midpoint on its average climate—just like the units on the right side of the figure.
Rather than ignore or throw out the units with low agreement, we concur with the recommendation of LeBreton and Senter12 to consider climate strength a focal outcome. Rather than taking the mean or median climate perception of a unit as ‘the whole story’ of that unit, we propose looking at a safety climate profile for each unit comprising their level, strength and shape on PSC scales. Doing so does not necessarily require advanced quantitative knowledge or software. Level can be easily calculated as the average (mean) or median value for a unit on PSC scale dimensions (or the per cent positive). Strength, or agreement, can either be calculated with Rwg or, for organisations with limited statistics infrastructure, strength can be modelled quite closely with a simple SD for the unit from its mean or median.12 Finally, we recommend generating a simple histogram (frequency distribution) for each unit on PSC dimensions in order to visually depict both the strength of agreement (or conversely, the variability in unit member perceptions) and the shape of that agreement or variability.
For organisations looking to understand and improve the PSC of healthcare units or departments, generating this simple safety climate profile for each responding unit can illuminate the safety climate ‘personality’ of units and inform the evolution of safe practice using a tailored approach. A unit with a high level of safety climate, a strong climate and a profile of all respondents giving high ratings may be an excellent model unit on which to base best practice. A unit with a moderately high level of safety climate, but a weak climate with a shape indicating a strong minority perceiving poor climate, may warrant a focus group to understand the nature of the staff subgroups with markedly different perceptions and experiences. A unit with moderate level climate, but a weak climate with a uniform endorsement of ‘poor’ through ‘excellent’ climate, may benefit from group interventions that focus on developing shared definitions and approaches to overcome safety obstacles in the unit's unique operating environment. Such a ‘grassroots’ and group-centred intervention has shown great promise in improving civility climate in healthcare.27–29 Finally, it is important to remember that while PSC levels may be more likely to be positive than negative and studies often report on positive safety climates, it is also possible for a unit to have a strong but negative PSC.
Practice implications
Healthcare organisations interested in understanding and improving PSC can generate a safety climate profile without any advanced statistical skills: if at least 10 staff per unit are sampled, leaders can generate three simple benchmarks to holistically understand unit climate:
average tendency (mean, median or per cent positive responses) to capture climate positivity or level;
SD around that average to capture variability (lack of agreement) as a measure of climate strength;
histograms of the climate scores to show the pattern or shape of climate perceptions on units.
The common practice of reporting PSC data according to the proportion of respondents who ‘agree’ or ‘strongly agree’ with statements in a PSC dimension has a place in the safety climate profile, but it is important to note that this is simply an alternate view of the climate level. Just like mean and median, proportion agreeing masks variability in strength of climate, and therefore, we strongly encourage practitioners to include it in concert with the other metrics noted just above.
PSC interventions can be better designed and tailored to individual healthcare units after considering the more holistic safety climate profile we are advocating—for example, an intervention targeting a weak PSC is likely to look different than an intervention targeting a low PSC. Weak climates might be best addressed by group interventions to develop, articulate and strengthen the unit's safety norms. Low PS climates might be better remediated with strong shows of leadership support for safety, such as increasing supervisor walkarounds, or engaging in high-profile communications and decisions that truly prioritise PS.
Our inclusion of safety climate shape as a key piece of a unit's profile provides novel information about how to improve or strengthen safety climate. For example, some units may show evidence of subgroups who perceive quite low versus quite high levels of safety climate. Such units may require an intervention process to understand the natural fault lines of the team and the reason for their different safety experiences—in fact, conflict resolution processes may be required to iron out underlying disagreements over tasks or processes. Focus groups with a neutral, outside facilitator may be necessary to get a frank understanding of the subgroups reporting low safety values.
Research implications
In climate research, we advocate paying attention to climate strength as an important research variable in its own right. Climate level and strength are both useful aggregate or unit-level variables. For example, strength of climate can be used to predict important research outcomes such as medical errors. So PSC researchers should continue the existing practice of checking agreement of units (Rwg mean, median and range across units), but we argue that the aggregated climate level as well as a metric of strength be considered focal analysis variables. In practical terms, both the mean or median, and the Rwg or SD value, can be unit-level variables of substantive interest in statistical models.
We also advocate noting the shape of unit safety climates, and this can provide a novel typology of unit safety ‘personality’ to consider as a group-level antecedent or consequence in safety research. Researchers can generate a simple histogram or frequency distribution of the safety scale responses of each unit studied and categorise them into ‘types’ (some likely possibilities include a normally distributed shape, extreme bimodal distributions indicating strong fault lines between those perceiving positive and negative culture, and a rectangular shape in which all response options are equally popular, indicating disagreement but no real subgroups). Interesting research questions follow, such as which safety and leadership practices create safety fault lines, as demonstrated in teams with subgroups perceiving very high and very low level safety climates? In terms of the theory of organisational culture, what does it mean when a unit has no clear safety climate, that is, it shows across-the-board safety perceptions (ranging from very negative, through neutral and very positive)?
Analytic attention to climate strength sets the scene for PS researchers to provide clarity on the ‘safety climate–safety outcomes’ relationship by looking at whether climate strength moderates the relationship between safety climate level and safety outcomes. As noted, evidence of this moderating effect of climate strength exists in the broader organisational literature.11 ,16 ,17
Focusing our research in these ways on climate strength is likely to help support (or refute) the importance of safety climate as a key variable in the domain of PS. Some of the challenges associated with measuring the relationship between safety climate and outcomes have been identified previously;30 however, it may be that a focus on the relationship between climate and outcomes that fails to include the role of climate strength as a moderator is susceptible to omitted-variable bias, which occurs when a model leaves out important explanatory variables (eg, climate strength) and, as a result, may overestimate or underestimate the effect of other variables (ie, climate level). Accordingly, we suggest that closer examination of climate strength as a moderator of the climate level–outcomes relationship should be a priority area in PSC research.
Limitations and future research
This study has some limitations. First, we only examined strength of climate at the unit/department level. Future research is required to more closely examine PS climate strength and agreement issues at the organisation level (in addition to the unit level). Such work is important given that two key dimensions of PS climate reflect leadership support for PS at both of these levels. Relatedly, the field would benefit from additional research that examines the extent to which PS climate perceptions are explained by unit versus organisation membership as there are only a small number of studies (eg, Schwendimann et al8) in this area.
Second, our sample size per ED was n>10. While 10 subjects per group are sufficient for calculating Rwg, Rwgs may be attenuated when only 10 responders are used per unit (particularly when <10 items are used, which is the case with many PS climate scales).12 If anything, this may have had a conservative influence on the Rwgs we report. We are further reassured by the fact that the unit in our illustrative examples with the low Rwg had a higher N (n=18). Where possible, researchers are encouraged to obtain slightly larger numbers of responders per unit in order to strengthen Rwg. Of course, a greater number of respondents per unit is also important for providing a more representative picture of PS climate on any given unit. We are unable to comment on how representative the respondents are of each ED in our study as we did not have access to data on the total number of staff in each ED. Finally, we do not have data on respondent characteristics, such as unit tenure, which may influence climate perceptions.31
Third, in terms of the properties of the Can-PSCS, several subscales had values of either Rwg or ICCs that were not above accepted criteria for data aggregation to the unit level. Our results show that the median values of agreement (Rwg calculated with a uniform null) exceed 0.70 for all dimensions except for supervisory leadership for safety (median Rwg=0.64). Despite the lower value of the Rwg for the supervisory leadership for safety subscale, the ICC(1) value was acceptable and the value for ICC(2) approached an acceptable value. However, despite acceptable Rwgs for two other dimensions (judgement-free environment and job repercussions of error), ICC(1) and ICC(2) were low for those two dimensions. Our ANOVA results showed that differences between EDs on these two dimensions were not significant, so discrepancies between the Rwgs and ICCs for the judgement-free environment and job repercussions of error dimensions may be due to low between-group variance—that is, scores on these two dimensions may not vary much across EDs.12 Further study is required regarding within-group agreement and between-group differences on these two dimensions if aggregation to the group level is planned as the sole focus of analysis (ie, if not generating the full safety climate profile we recommend). Future users of the Can-PSCS and other climate scales who wish to use aggregated (unit mean) scale scores as their sole focus (which we are neither doing nor recommending in this paper) are also reminded to examine their data on all three criteria for sufficiently high inter-rater agreement (eg, Rwg>0.70), sufficient between-group variance (ICC(1)>0.05 or significant between-group ANOVA results) and sufficient group mean reliability (ICC(2)>0.70) before going forward with aggregation.12
The field would also benefit from other avenues of research on safety climate strength including examination of its antecedents and outcomes and whether these are different for climate level versus climate strength. For instance, do frequently used interventions such as leadership walkarounds mostly affect climate strength, climate level or both? Relatedly—do units with stronger agreement tend to have higher levels of safety climate? And, as noted above, do units with strong and positive climates have better safety outcomes? More broadly, we hope that this work can also help move our thinking beyond sharedness as a defining aspect of culture and expand the conversation about what constitutes a culture and how culture operates.
Conclusion
Organisations or units wishing to obtain a holistic picture of their safety climate(s) will have a much more complete picture if they examine both the level and the strength of climate scores, and consider also the shape of units’ climate profiles. Examining a unit's mean score (ie, level), the SD of the climate score and a simple histogram of the scores can provide this comprehensive picture. Focusing on PSC level and strength can also further knowledge of the extent to which PSC is a key variable in the domain of PS.
Acknowledgments
The authors wish to thank Accreditation Canada for providing us with data that enabled us to perform these analyses. We also thank Jonathan Mitchell for comments on the final version of the manuscript. We also thank the thousands of staff in health care organizations across Canada that complete a patient safety culture survey as part of the Accreditation process.
References
Supplementary materials
Supplementary Data
This web only file has been produced by the BMJ Publishing Group from an electronic file supplied by the author(s) and has not been edited for content.
- Data supplement 1 - Online supplement
Footnotes
Contributors LG and DGO jointly designed the study, conducted all analyses and drafted and revised the paper.
Competing interests None declared.
Ethics approval Because the data we report in this paper were provided in anonymised form to the lead author for purposes of secondary analyses, the analyses reported here were exempt from review by the Office of Research Ethics at York University where the lead author is employed.
Provenance and peer review Not commissioned; externally peer reviewed.