Article Text

Abstract
Background Medication errors are frequent and may cause harm to patients and increase healthcare expenses.
Aim To explore whether a new labelling influences time and errors when preparing medications in accordance with medication charts in an experimental setting.
Method We carried out an uncontrolled before and after study with 3 months inbetween experiments. Phase I used original labelling and phase II used new generic labelling. We set up an experimental medicine room, simulating a real-life setting. Twenty-five nurses and ten pharmacy technicians participated in the study. We asked them to prepare medications in accordance with medication charts, place packages on a desk and document the package prepared. We timed the operation. Participants were asked to prepare medications in accordance with as many charts as possible within 30 min.
Results Nurses prepared significantly more medication charts with the generic labelling compared with the original 3.3 versus 2.6 (p=0.009). Mean time per medication chart was significantly lower with the generic labelling 6.9 min/chart versus 8.5 min/chart (p<0.001). Pharmacy technicians were significantly faster than the nurses in both phase I (6.8 min/chart vs 9.5 min/chart; p<0.001) and phase II (6.1 min/chart vs 7.2 min/chart; p=0.013). The number of errors was low and not significantly different between the two labellings, with errors affecting 9.1% of charts in phase I versus 6.5% in phase II (p=0.5).
Conclusions A new labelling of medication packages with prominent placement of the active substance(s) and strength(s) in the front of the medication package may reduce time for nurses when preparing medications, without increasing medication errors.
- Hospital medicine
- Medical error, measurement/epidemiology
- Medication safety
- Nurses
- Patient safety
This is an Open Access article distributed in accordance with the Creative Commons Attribution Non Commercial (CC BY-NC 4.0) license, which permits others to distribute, remix, adapt, build upon this work non-commercially, and license their derivative works on different terms, provided the original work is properly cited and the use is non-commercial. See: http://creativecommons.org/licenses/by-nc/4.0/
Statistics from Altmetric.com
Introduction
Medication errors (MEs) include ‘any preventable event that may cause or lead to inappropriate medication use or patient harm while the medication is in the control of the healthcare professional, patient or consumer’.1 MEs are considered one of the most frequent causes of adverse events in hospitalised patients.2 ,3 MEs are present throughout the entire medication administration process, from prescribing through documenting, transcribing, dispensing, administering and monitoring.4 European data show that 23% of European Union citizens claim to have been directly affected by MEs, and 18% claim to have experienced a serious ME in the hospital.5 Between 50% and 70% of MEs are considered preventable.5 ,6 Annual costs associated with MEs are estimated to be £1–2.5 billion in the UK7 and $2.8–15 million in individual US medical centres.4
Lookalike/sound-alike (LA/SA) health products refer to ‘names of health products that have orthographic similarities and/or similar phonetics (ie, similar when written or spoken)’.8 These similarities may cause MEs in relation to prescribing, dispensing or administration of a product.8 In USA, confusion between LA/SA medication names is attributed to 25% of MEs, according to MEs reported to the US Pharmacopoeia.9 In a study of 400 deaths caused by MEs, the US Food and Drug Administration (FDA) found that 5% of deaths were attributed to proprietary name confusion and 4% to generic name confusion.8
During prescribing and transcribing, computerised provider order entry systems have been promoted as the primary method to reduce MEs, because misinterpretation of handwriting, decimal points or abbreviations can be eliminated.10 After introducing a bar code system in a medical centre in Virginia, USA, the ME error rate was reduced by 86% over a 9-year period.10 Despite the benefits of electronic systems, LA/SA errors may still be difficult to detect as the prescribed medication may have been wrongly selected and consequently the wrong medication dispensed even though presumed correct by the bar code system.8 Consequently, other actions may be needed.9 In USA, the FDA has created a computerised programme that assists in detecting similar names at the time of market authorisation application.10 In fact, about one-third of proposed names for new medications are normally rejected.8 Also, the US Institute for Safe Medication Practices regularly publishes the ‘List of Confused Drug Names’ to inform healthcare professionals about similar drug names.11 In addition, error-preventing strategies such as colour/contrast coded drug administration devices and ‘Tall-man’ lettering have been suggested.8 ,9 ,12 In Europe, stakeholders in postmarketing monitoring are urged ‘to identify problems related to poor naming, labelling, packaging and drug information that occur with medicines in the day-to-day use’ and ‘to assess the adequacy of the package design to drug delivery and administration’.13
The term ‘generic prescribing’ concerns the use of the international non-proprietary name (INN) of the active substance(s) when prescribing medications instead of the brand name marketed by the pharmaceutical company. Generic prescribing may reduce MEs because patients and healthcare personnel can relate to one name only, the INN, rather than many different brand names.14 ‘Generic substitution’, is the term applied to the dispensing of a generic equivalent medication instead of the prescribed medication. Generic substitution is possible when the patent life of the active substance(s) has expired.15 Generic substitution has been introduced in several countries as a means to reduce costs of medicines.16 ,17 In Sweden and Finland, a 10%–15% reduction in overall medicine costs was observed after implementation of the mandatory generic substitution policy.16 There is little evidence that generic substitution interferes with patient safety.14 ,15 Still, there are multiple case reports of patients being admitted to hospital for adverse drug events resulting from overdoses caused by taking two or more medications with the same active ingredient but with different brand names.4 A Norwegian study showed that 5% of patients on antihypertensive medications were taking two or more equivalent generic products simultaneously, mainly because they believed they were taking different medications.18
To counter the risk of unconsciously taking, administering or dispensing more than one product with the same active ingredient, Endestad et al 19 recently explored the effect of a redesigned standardised labelling of medication packages. The new design includes prominent placement of INN(s) and strength(s), written in black on a white background, and placed in the upper right corner of the front of the package (figure 1). In a computer-based experimental study, the authors investigated the ability of participants to recognise packages containing the same active ingredient(s) with original or new labelling. Both younger and older participants were significantly faster and more accurate, giving the correct answer with the new labelling.19
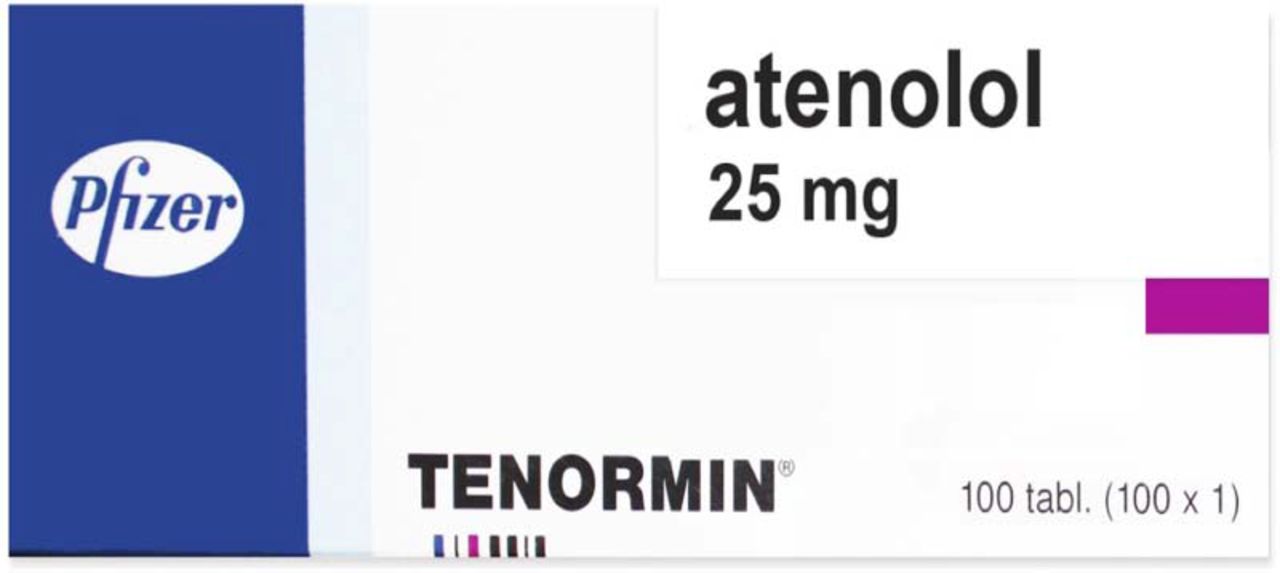
New structured labelling as suggested by Endestad et al. 19
We aimed to explore whether the new labelling suggested by Endestad et al could influence time and error rates when preparing medications in accordance with individual medication charts in a hospital setting, as compared with the original labelling. We also aimed to study potential differences between nurses and pharmacy technicians when preparing medications in order to explore future partnership models to tackle MEs.
Methods
The study was performed at the University Hospital of North Norway (UNN), where medication charts are handwritten and generic prescribing was introduced in 2012.
We used an uncontrolled before and after design using the original labelling (phase I) and the new labelling (phase II) of medication packages. We set up an experimental medicine room, simulating a real-life hospital setting. We used medications where the brand name differed from the generic name and limited the medications to tablets and capsules. A computer was available enabling participants to search for active substances and/or brand names of the different medications if necessary.
At UNN, the nurses follow a standardised procedure when preparing medications for patients: (1) read the handwritten medication chart, (2) select the generic alternative available, (3) document the selected medication package in the medication chart with brand name and signature and (4) administer the medication to the patient.20 In cases where the brand name equals the generic name, nurses will also document the manufacturer's name in the chart to exactly identify which medication has been prepared and given to the patient. We included 10 nurses from three hospital departments (Paediatric, Gastrointestinal Surgery and Infectious Diseases) in addition to 10 pharmacy technicians from the hospital pharmacy. The same people participated in both phases of the study.
We prepared 10 different medication charts identical to the UNN handwritten charts. Each chart included 10 different medications written with generic name, strength, dosage interval and dosage form. We did not validate the charts in terms of having the same complexity, but the medications were commonly used in the represented departments. We asked participants to (1) identify medication packages in accordance with the medication charts, (2) place packages on the desk and (3) write brand name (and manufacturer when appropriate) of medication packages on the medication chart, following standard procedure. For every chart prepared, we verified against the original chart whether the correct medications had been prepared and the correct names written. Discrepancies between the medication chart and the medications prepared were recorded, but not revealed to participants. We then replaced medications into shelves and handed out a new medication chart. Using a stopwatch, we timed the preparing medication procedure, starting when the chart was handed over to the participant and stopping when the task had been completed (figure 2). Participants prepared medications from as many medication charts as possible within the 30 min allocated time.

Experimental procedure in a simulated medicine room. *n represent the number of medication charts the participant was able to prepare during the allocated time.
In phase I (October 2013), we used original packages without any additional labelling. In phase II (January 2014), we labelled the packages with the new standardised generic label as suggested by Endestad et al.19 The label was rectangular and white, covering about 25% of the package, and placed in the upper right corner. INN(s) and strength(s) were written in Arial point 24 bold and in Arial point 18, respectively (figure 1). Drug formulation was not included. We used label sizes in accordance with package sizes, sometimes descaling the size of the letters in order to make the label cover only 25% of the package front.
Statistics
We used Microsoft Office Excel V.15.27 and SPSS 24.0 for Windows for data management and analysis. Continuous variables were expressed with means and SD, medians and minimum and maximum values. Data were not normally distributed, and we applied non-parametric statistical tests. We used the Wilcoxon signed-rank (WSR) test to compare time per medication chart in between the two phases, only including medication charts completed by the same participant in both phases. The Mann-Whitney U (M-W) test was applied to compare mean time and mean number of medication charts prepared between groups, including all medication charts from both phases. We applied Fischer′s exact (FE) test to explore differences in error rates per medication chart between the two phases, including all medication charts from both phases. A value of p<0.05 was considered significant.
Sample size
We calculated sample size based on parametric data and estimated average speed of 0.5 min to prepare a single medication from a medication chart. We aimed to show a 20% reduction in speed (from 0.5 to 0.4 min). Comparing differences between means using SDs from 0.2 to 0.5, we estimated a sample size of 34 to 199, respectively. As SD was unknown, and we only had 30 min allocated per participant, we decided to prepare 100 medications: 10 medication charts with 10 medication in each, then also taking into consideration that some participants would be faster than average.
Ethics
The project was presented to the Regional Committees for Medical and Health Research Ethics, who concluded that no ethical approval was necessary. Participants accepted participation on request from their leaders (oral consent only), briefly presented with the aim of the study and what they were expected to do. No direct personal identifiable data were collected, but participants were given consecutive study numbers to allow for comparison between the two phases.
Results
A total of 40 participants arrived for phase I, but only 35 for phase II––25 nurses and 10 pharmacy technicians. Only one participant (from department III) was male. The reason for non-participation is unknown. See table 1 for demographic variables.
Demographics of participants (n=35)
In total, participants prepared medications from 99 medication charts in phase I (range 1–5), and from 124 in phase II (range 2–7). In phase II (generic labelling), participants prepared medications from significantly more medication charts compared with phase I [mean 3.5 charts (SD 1.4), median 3.0 vs mean 2.9 charts (SD 1.0), median 3.0; p=0.024 (M-W)]. Among nurses, the number of medication charts prepared increased significantly from phase I to phase II [mean 2.6 charts (SD 0.8), median 2.0 vs mean 3.3 charts (SD 1.1), median 3.0; p=0.009 (M-W)], which was not the case among pharmacy technicians (mean 3.6 charts (SD 1.2), median 3.5 vs mean 4.1 charts (SD 1.8), median 4.0; p=0.67 (M-W)]. While pharmacy technicians prepared medications from significantly more medication charts compared with nurses in both phases, the difference between the two professions was significant only in phase I [p=0.011 (M-W)], and not in phase II [p=0.255(M-W)].
Time spent preparing medication charts was significantly reduced in phase II (generic labelling) compared with phase I (original labelling); mean 6.9 min/chart (SD 2.7), median 6.5 vs mean 8.5 min/chart (SD 3.5), median 8.4; p<0.001 (WSR). Time reduction from phase I to phase II was significant among nurses from all departments, but not among pharmacy technicians (figure 3). The nurses spent significantly more time than the pharmacy techicians in phase I [mean 9.5 min/chart (SD 3.7), median 9.3 vs mean 6.8 min/chart (SD 2.5), median 6.3; p<0.001 (M-W)]. This difference was smaller in phase II, but still significant [mean 7.2 min/chart (SD 2.6), median 6.9 vs mean 6.1 min/chart (SD 2.6), median 5.2; p=0.013 (M-W)].

Mean time (minutes) per medication chart when preparing medications in accordance with medication charts in phase I (original labelling) and phase II (generic labelling).
We identified errors in 6.5% of the charts (n=8) in phase II vs 9.1% of the charts (n=9) in phase I [p=0.462 (FE)]. We never identified more than one error in each chart, but two participants made two errors in phase I. In phase I, we identified errors in 11.1% (n=7) of the charts prepared by nurses and 5.6% (n=2) of the charts prepared by pharmacy technicians. This was the opposite in phase II, where we identified errors in 9.8% (n=4) of the charts prepared by pharmacy technicians and 4.8% (n=4) of the charts prepared by nurses. The difference between nurses and pharmacy technicians was not statistically significant in either parts [p=0.357 and 0.294, respectively (FE)]. Two types of errors changed slightly from phase I to II. Errors involving medications as fixed dose combinations were reduced from eight in phase I to two in phase II. Errors involving medications with a different active substance were absent in phase I, but occured three times in phase II. For an overview of errors, see table 2.
Errors made when preparing medications in accordance with medication charts in phase I (original labelling) and phase II (generic labelling)
Discussion
The present study shows that a new standardised generic labelling of medication packages as suggested by Endestad et al 19 may reduce time for nurses when preparing medications in accordance with medication charts, without increasing MEs.19 To our knowledge, no study has previously explored the consequences of a new standardised labelling on time and MEs when nurses prepare medications in a simulated setting. Nor do we know of any study comparing nurses and pharmacy technicians performing this task.
MEs such as missed dose, wrong dosage, wrong medication, wrong time and wrong route frequently happen during hospitalisation and may lead to patient harm and additional healthcare costs.4 A stressful work environment for nurses may predispose for MEs when preparing medications.17 Our study indicates that medication workload time for nurses may be reduced if generic labelling is used.
Another way to reduce nurses’ medication workload time and MEs could be to use pharmacy technicians in medication management tasks. A UK pilot study described positive results from a model where nurses and pharmacy technicians formed a partnership in preparing and double-checking medications for intravenous administration.21 The collaboration increased the understanding of medication safety and confidence in their delivering of care, and also reduced medication safety incidents.21 A US study showed that engaging pharmacy technicians with patients and nursing staff in a paediatric unit could reduce the time nurses spent ‘hunting for medications’.22 In our study, pharmacy technicians were significantly faster than nurses, independent of labelling. As a means to tackle MEs, we should rethink the role of the pharmacy technicians also in Norway and other countries.
In our study, error rates were low and not significantly different between the two labelling periods. However, results may be limited by the low error rates, and a larger study may be necessary to verify our findings. The most frequent errors in our study involved preparing single-substance medications instead of the correct fixed-dose combination (LA/SA), followed by wrong formulation and strength. Except from the single-substance versus fixed-dose combination errors made in the generic labelling phase, three other LA/SA errors were made. The mix-up was comprehensible in the case where both brand names and generic names were similar, but harder to comprehend in the two cases where the generic names were totally different. Even if the brand names were similar, participants were supposed to use the generic names to locate the medication packages and not the brand names. One plausible explanation for this mix-up is that participants translated the generic names into brand names even if the packages were labeled with generic names, and subsequently prepared the wrong medication due to LA/SA brand names. This type of error has also been reported by Anto et al,12 although not being very frequent.
We found no significant difference in error rates between nurses and pharmacy technicians; however, this may also be limited by the low error rates. Compared with nurses who are personally responsible for giving correct medications to patients, pharmacy technicians normally operate further away from the patient and always under control by a pharmacist. Consequently, we believe that pharmacy technicians involved in clinically related tasks should be offered training which also focuses on direct patient responsibility. This was also the case in the UK study where a training programme was initiated.21
A slow release tablet with the wrong strength was four times erroneously prepared instead of an immediate release tablet, suggesting that the drug formulation should be included in the new labelling in addition to the INN(s) and strength(s), as originally suggested by Endestad et al. 19 Information about drug formulation is important both due to effect and safety.
Strengths and limitations
The main strength of this study is the standardised experimental design. In both phases, we used the same medicine room, the same medication packages, the same medication charts, the same procedure, the same instructions and instructors, and the same amount of time available for each participant. The main limitation of this study is the uncontrolled before and after design. Even if quasiexperimental studies are considered superior to observational studies, they are limited by the difficulty in attributing the observed change to the intervention (in this case the new labelling).23 In this study, we tried to minimise recall bias from phase I by waiting 3 months to perform phase II, but results should be interpreted with care as we cannot rule out the possibilities of a learning effect. However, none of the participants had any information about the new labelling design before phase II. Hawthorn effects could also have introduced biases.23 Some participants may have worked faster than normal due to stress and a desire to perform, resulting in more mistakes. Others may have worked slower than normal in order to make as few errors as possible. Whether this influenced the difference between the two phases or between nurses and pharmacy technicians is unknown. However, the number of errors observed in phase I is in line with the number of errors seen when nurses documented errors during double-checking (unpublished data for UNN showing errors in 12.1% of medication charts), indicating that the experimental setting resembled reality. Finally, our study lacks power to identify a statistical significant difference in error rates between the two phases. A follow-up study should take these issues into consideration and perhaps use a cross-over design. Sample size should be increased by including more medication charts, and the study should be performed in a real-life situation.
Conclusion
A new labelling of medication packages with prominent placement of the active substance(s) and strength(s) may reduce time for nurses when preparing medications without increasing MEs. We do however suggest adding information about drug formulation to the label to further minimise risk of confusion. Due to pharmacy technicians’ efficiency and knowledge about medications, innovative collaboration structures between pharmacy technicians and nurses should be investigated.
Acknowledgments
This work was performed by two master students in pharmacy; Mehtap Akbina and Bana Quassem Ahmed, to whom the authors are most grateful. The authors thank all their study participants; nurses and pharmacy technicians at UNN and the Hospital Pharmacy of North Norway Trust, respectively. They also thank the heads of the departments and pharmacy that allowed their employees to participate.
References
Footnotes
Twitter Follow Beate Hennie Garcia @beategarcia
Contributors All authors were involved in designing the study and interpreting results. BHG and KHH have performed the statistical analysis. BHG has drafted the manuscript, and all other authors have commented, revised and agreed upon the final manuscript.
Competing interests None declared.
Provenance and peer review Not commissioned; externally peer reviewed.