Article Text

Abstract
Background10 The Joint Commission identified inpatient alarm reduction as an opportunity to improve patient safety; enhance patient, family and nursing satisfaction; and optimise workflow. We used quality improvement (QI) methods to safely decrease non-actionable alarm notifications to bedside providers.
Methods In a paediatric tertiary care centre, we convened a multidisciplinary team to address alarm notifications in our acute care cardiology unit. Alarm notification was defined as any alert to bedside providers for each patient-triggered monitor alarm. Our aim was to decrease alarm notifications per monitored bed per day by 60%. Plan-Do-Study-Act testing cycles included updating notification technology, establishing alarm logic and modifying bedside workflow processes, including silencing the volume on all bedside monitors. Our secondary outcome measure was nursing satisfaction. Balancing safety measures included floor to intensive care unit transfers and patient acuity level.
Results At baseline, there was an average of 71 initial alarm notifications per monitored bed per day. Over a 3.5-year improvement period (2014–2017), the rate decreased by 68% to 22 initial alarm notifications per monitored bed per day. The proportion of initial to total alarm notifications remained stable, decreasing slightly from 51% to 40%. There was a significant improvement in subjective nursing satisfaction. At baseline, 32% of nurses agreed they were able to respond to alarms appropriately and quickly. Following interventions, agreement increased to 76% (p<0.001). We sustained these improvements over a year without a change in monitored balancing measures.
Conclusion We successfully reduced alarm notifications while preserving patient safety over a 4-year period in a complex paediatric patient population using technological advances and QI methodology. Continued efforts are needed to further optimise monitor use across paediatric hospital units.
- alarm reduction
- quality improvement
Statistics from Altmetric.com
Introduction
Hospital-based healthcare providers rely on continuous vital sign monitoring, including pulse oximetry and electrocardiographic-based cardiorespiratory monitors, to alert them to changes in patients’ clinical conditions. However, continuous monitors can generate a large volume of nuisance alarm notifications that do not represent a meaningful change in clinical status. This may lead to alarm fatigue, or alarm desensitisation, which can lead to providers not responding to alarms.1 Alarm fatigue has become a patient safety priority,2–4 and the Joint Commission highlighted alarm fatigue as the most common contributing factor to alarm-related sentinel events.5 6 Since 2014, their annual National Patient Safety Goals have required all institutions to implement measures to improve alarm management.
Initial studies identified alarm fatigue to be directly related to the number of alarms per patient per day, with some patients experiencing up to 350 physiological monitor alarms daily.7 On a paediatric ward, up to 99% of alarms are non-actionable, either not accurately reflecting the clinical status of the patient or not requiring intervention.1 8 9 Furthermore, nursing response time to alarms increases as exposure to non-actionable alarms increases.10 Response times may pose a risk to patient safety when an alarm notification indicating a true decline in clinical condition is not addressed rapidly. On our acute care cardiology unit (ACCU) prior to 2014, nurses experienced greater than 100 alarm notifications per patient-day. Initial hospital-wide alarm reduction work focused on broadening the range for acceptable respiratory rates (set to 10–200 breaths per minute, as a high respiratory rate without other vital sign abnormalities is often a non-actionable alarm11) and using the alarm system’s intentional delay before alarms sounded (5 s). Despite these efforts, the ACCU alarm burden had not measurably improved, and the nursing staff, patients and families remained consistently interrupted by alarm notifications. Decreasing the number of non-actionable alarms became crucial to ensure that providers respond promptly to actionable alarms. Removing unnecessary alarm notification redundancy, such as audible alarm tones from the patient room monitors, also became an objective for the improvement team.
In order to address these concerns within the ACCU, we aimed to reduce the frequency of initial alarm notifications (defined as the primary alert to a handheld device carried by a bedside provider notifying them of a patient-triggered monitor alarm) per monitored bed per patient-day by 60% over a 3-year period. Furthermore, we sought to assess the impact of our interventions on patient safety and nurse experience.
Methods
Context
Our institution is a large, urban academic medical centre. The ACCU contained 17 beds during the improvement work, and is similar in surgical volume, patient acuity and provider workforce to analogous units at other large paediatric institutions in the USA.12 Patients admitted to the ACCU include those preparing for and recovering from cardiac surgery (including transplantation and mechanical circulatory support) and invasive procedures (including cardiac catheterisation), those with heart failure or arrhythmia and those with significant underlying heart disease but admitted for general paediatric indications. ACCU patients are cared for by a team of paediatric nurses, nurse practitioners, residents, cardiology fellows and attendings. Each patient room can provide continuous monitoring with 5-lead electrocardiography (ECG) telemetry, respiratory rate and oxygen saturations. Prior to the study period, our monitors visually and audibly alarmed in patient rooms and at the nurses’ station, and audibly to nursing pagers (Statview; General Electric Healthcare, Chicago, IL). Every monitor alarm resulted in multiple immediate and quickly repeated communications, or ‘alarm notifications’, to the primary and charge nurse. Alarm fatigue had been identified as an institution-wide problem, resulting in the formation of a Monitor Oversight Committee.8
Interventions
In 2014, we created a multidisciplinary team to address alarm notifications in the ACCU. Team members included the ACCU director, nursing staff, nurse practitioners, nursing leadership and representatives from information services. We identified key drivers including (1) staff, unit leadership and patient/family engagement in alarm management, (2) standardised, reliable processes for patient-specific monitor use, and (3) clearly defined roles, responsibilities and accountability for the alarm process. Using the Model of Improvement from the Institute of Healthcare Improvement, we used frequent, small tests of change and Plan-Do-Study-Act (PDSA) cycles to work towards our goal.13
Over a 3.5-year period during 2014–2017, we implemented a variety of interventions, many occurring concurrently. The various alarm system technologies that were used are demonstrated in figure 1. This process map demonstrates how the different alarm systems (GE and Philips; General Electric Healthcare, Chicago, IL, and Philips, Amsterdam, Netherlands), middleware platforms (Statview and Connexall; GlobeStar Systems, Toronto, Ontario, Canada) and nurse-held devices (Statview pager and Voalte phones; Voalte, Sarasota, FL) helped modify and deliver alarm notifications to the nursing staff. Table 1 details the overall chronology of our work, and the major components are outlined in the sections below.
Specific interventions, alarm system generation and timing for each intervention

Alarm system generations and associated process map. In generation 1, after a 5 s delay, the General Electric monitor system sends all alarms to Statview middleware, which sends all notifications without delay to primary and charge nurse pagers. The generation 2 alarm system included Connexall middleware, which implemented alarm logic and varying delays before sending notifications to nurses’ Voalte smartphone. Finally, in generation 3, the General Electronic monitor system was replaced by a Philips monitor system, which implemented additional alarm logic and varying delays. All subsequent notifications were sent through the Connexall middleware then directly to nurses’ Voalte smartphone.
New technology
We began with three technology interventions: (1) transitioning from pagers to a smartphone-based application for nursing alarm notification, (2) integrating a new middleware platform, capable of alarm customisation, which communicated between monitors and smartphones (Connexall), and (3) adopting new software to facilitate the transmission of waveforms to nurses through smartphones (AirStrip; AirStrip Technologies, San Antonio, TX). After testing, nurses reported not using the waveform technology due to the presence of hallway/alcove monitors throughout the ACCU, so this intervention was abandoned in 2016. Ultimately, we incorporated a new bedside monitor system also capable of alarm logic customisation (Philips).
Alarm logic
We took a graduated approach to building logic into our alarm management to ensure patient safety was maintained. To understand the baseline prevalence of non-actionable alarm notifications, we enlisted night shift nurses to record all alarm notifications received during their shifts, noting those that required clinical action (eg, increasing supplemental oxygen). Night shift was chosen for feasibility, as daytime included rounding and other clinical tasks. After a 2-month observation period, we had a better understanding that many alarm notifications were commonly non-actionable and thus could be targeted for alarm logic PDSAs.
Testing began with middleware-mediated intentional alarm delays from the bedside monitor to the nurse’s phone (figure 1, generation 1). An alarm delay required that the alarm threshold be exceeded for a prespecified amount of time (the ‘delay’) before sending the alarm notification to the bedside provider. Delays allow for filtering out alarms that were false or not felt to be significant; if an alarm outlasted the delay, it was more likely not to be artefactual. After rigorous testing with safety surveillance, and the subsequent adoption of a new monitor system, the delay algorithms transitioned from middleware-mediated logic to a combination of logic from the middleware and the bedside monitor (figure 1, generation 3).
We tested delay times and also the vital sign thresholds needed to trigger an alarm notification for a variety of parameters: oxygen saturation (SpO2), heart rate, ECG couplets per minute and the number of premature ventricular contractions (PVC) per minute. We began with conservative measures and gradually liberalised our approach as our learning developed. For example, for alarms related to high SpO2 above a set threshold, we started with an alarm notification delay of 1 min; this was eventually increased to 5 min. The alarm notification delays for low SpO2 readings were adjusted based on the severity of hypoxia. After progressive rounds of testing over years the following alarm notification delays were adopted: (1) SpO2 less than 60%, no delay, (2) SpO2 between 60% and 69%, a 15 s delay, (3) SpO2 between 70% and 79%, a 30 s delay, and (4) SpO2 between 80% and 89%, a 60 s delay (online supplementary table 1). Fifteen-second delays were adopted for high and low heart rates, and low respiratory rates.
Supplemental material
Finally, we deactivated 20 non-actionable system-level default alarms that originated from mechanical or technical issues, such as alarms for respiratory rate lead detachment or poor SpO2 signal connectivity (online supplementary table 2). Building on the system alarm learnings, similar non-actionable system alarms were deactivated in generation 3 (online supplementary table 3), with a 120 s delay added to the actionable system alarms such as ECG leads off (online supplementary table 4).
The approach to these parameters was incremental and included ongoing, careful review of safety process measures. Importantly, alarm logic interventions affected only the alarm notifications, with the visual monitor displays continuing to reflect current patient parameters.
Process changes
We prioritised process changes restructuring who receives alarm notifications and when, particularly for charge nurses who received a large burden of alarm notifications. We developed an algorithm of staged alarm notifications, with an initial alarm notification sent to specific nurse recipients, removing the charge nurse from receiving these notifications if it was not a high-acuity alarm such as ventricular tachycardia. If the alarm continued after a specified amount of time, a ‘secondary’ alarm notification would be resent to the initial recipients, with additional nurses added. We assigned ‘buddy’ bedside nurses to receive all secondary alarm notifications along with the primary bedside nurse, further relieving the charge nurse. We began with a specified 20 s delay between the initial and secondary alarm notifications. After careful consideration and patient safety monitoring, we increased the delay to 60 s before resending secondary alarm notifications. A ‘tertiary’ alarm notification was also added with a specified 60 s delay before resending alarm notifications to designated recipients. The final registered nurse (RN) escalation algorithm is shown in online supplementary figure 1.
Additional process changes included incorporating team discussions of patient-specific vital sign parameters and the need for continuous versus spot-check SpO2 and telemetry into daily rounds. We implemented a manual process to track and improve the frequency of electrode lead replacement every 24 hours, due to evidence that this reduces the number of alarms without affecting safety parameters.11 14 Interventions to this process included real-time follow-up for lead change failures, sending emails to bedside providers assessing barriers to lead change, adding lead replacement to the evening bathing routine and nursing reminders.
Patient- and family-targeted interventions
In order to decrease the burden of non-actionable alarms on families, we silenced all alarms in patient rooms starting November 2015. This intervention developed as a result of PDSA cycles and continued attention to patient safety and comfort. It was tested only after alarm logic had been safely incorporated into daily practice and nursing consistently received all intended alarm notifications. Of note, the alarm system retained the following intentionally redundant mechanisms: (1) silent visual displays on bedside monitors, (2) audible and tactile alarm notifications on smartphones, (3) audible alarm notifications at the nurses’ station, and (4) a hard-wired and hospital-wide audible and visual hallway system for code and other emergency use. The testing that drove silencing in-room alarm volume required substantial communication and buy-in among nursing staff, ancillary staff members, physicians and patient families.
Measures
The primary outcome measure was the reduction of initial alarm notifications per monitored bed per day averaged by month. Following the introduction of middleware, we also followed the proportion of initial alarm notifications relative to the total alarm notifications per month as a process measure. This measure monitored the impact of changes to the alarm notification strategy on the overall burden of alarm notifications to bedside providers. We extracted the number of alarms and alarm notifications directly from the monitors and middleware platforms.
Our secondary outcome measure was nursing satisfaction as assessed by an internal, non-validated survey. We conducted the survey in October 2015 and February 2016, around the time of the low SpO2 delay testing. The email-distributed online survey contained three questions with categorical responses including ‘strongly agree, agree, disagree, strongly disagree’, and one question with categorical responses including ‘rarely or never, once per month, once per week, once per shift, multiple instances per shift’.
Safety process measures included an internal, non-validated patient acuity scoring system (Safety Assessment and Focused Evaluation; SAFE) to monitor patient status as a balancing measure. The SAFE score is similar to Paediatric Early Warning Score but with modifications specific to a cardiac population,15 and its use since 2011 predates the alarm reduction quality improvement (QI) work (online supplementary table 5). We used this tool as a safety balancing measure because we believe that a change in patient acuity, reflected by an increased score, may reflect unrecognised clinical decompensation due to decreased alarms on the unit. The monthly proportion of SAFE scores that were 4 or greater (the level at which a provider must be notified) for every 10 patients was monitored. Additional safety balancing measures included rates of medical emergency team (MET) activation and transfers to the cardiac intensive care unit (CICU),16 each measured per 1000 patient-days. We also tracked readmission rates to the ACCU less than 7 days after discharge and monitored adverse events such as codes on the unit from the electronic health record.
Analysis
We used statistical process control charts to monitor the following measures: initial alarm notifications (XMR chart), proportion of initial to total alarm notifications (P chart), per cent of patients with leads changed every 24 hours (P chart), MET activations and CICU transfers (XMR chart) and proportion of SAFE scores greater than or equal to 4 (P chart). We used established rules to determine if observed changes were common cause variation or due to special cause variation.17
For the purposes of this project, we created two categories for the survey results including ‘strongly agree or agree’ and ‘strongly disagree or disagree’ for the first three questions and ‘once per month or less’ and ‘once per week or more’ for the fourth question. We analysed the nurse survey data with χ2 and Fisher’s exact test as indicated to assess categorical measures.
Results
Alarm notifications
Average initial alarm notifications improved, as evidenced by special cause variation, after implementation of two early interventions: increasing the number of PVCs needed to trigger an alarm and deactivating system alarms. Over 6 months between October 2014 and March 2015, alarm notifications decreased from 71.0 to 37.1 initial alarm notifications per monitored bed per day (figure 2). After an additional 2 years of testing (approximately March 2015 to March 2017), including high and low SpO2 alarm delays, modifying the RN escalation algorithms and introducing a new alarm system, special cause reduction was again seen, with the average initial alarm notifications decreasing to 22.4 per monitored bed per day. This represented a total reduction of 68% over the intervention period. These improvements have been sustained for greater than 18 months.
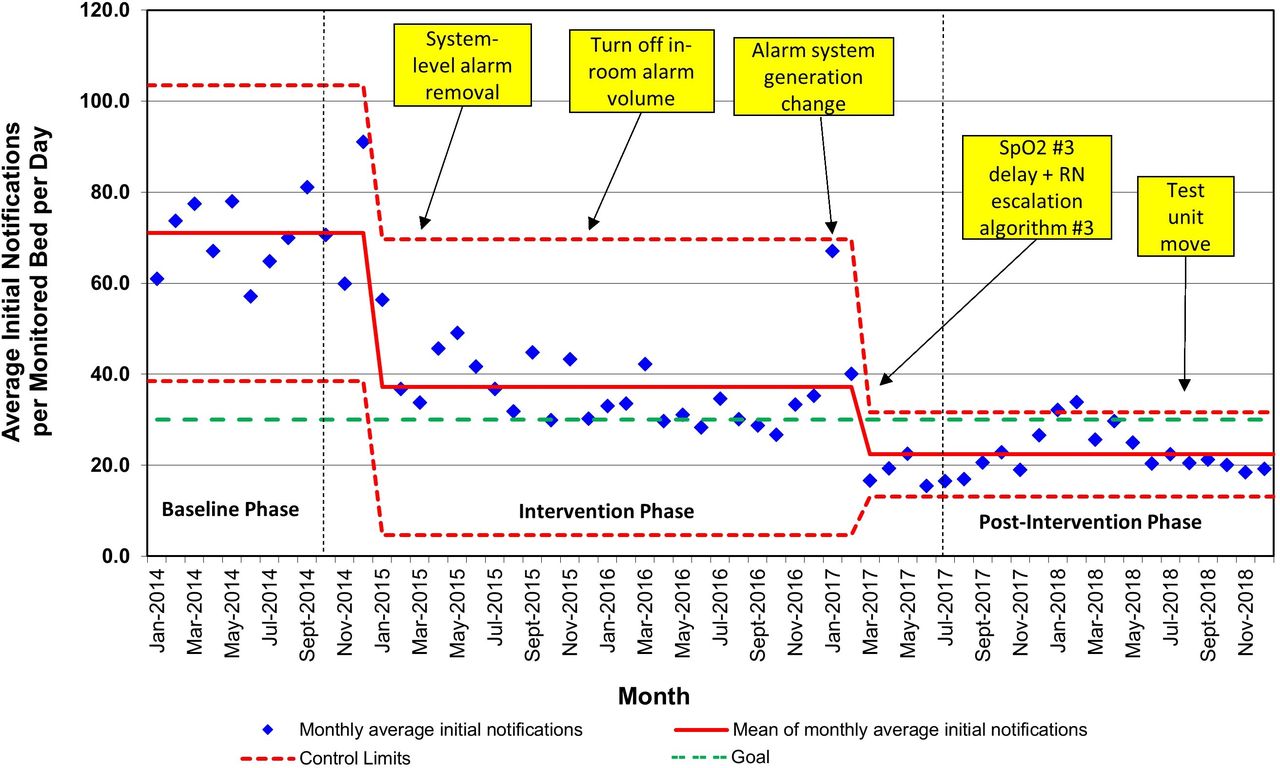
Average initial notifications per monitored bed per day, by month. RN, registered nurse.
Special cause variation was seen in the average initial alarm notifications per monitored bed per day in January and February 2018 (figure 2) and number of MET calls and CICU transfers at that time, occurring concurrently with an increase in patient acuity due to seasonal illnesses. On review, there was no evidence of root cause within the alarm management strategy. Of note, no special cause variation was seen at the time of the ACCU moving its physical location within the hospital (August/September 2018), expanding from 17 to 24 beds.
Nursing satisfaction
Thirty-eight nurses participated in the survey prior to testing low SpO2 interventions, and 25 nurses participated following the testing (table 2). Prior to this testing, 92% of nurses surveyed from the ACCU (n=35 of 38) either strongly agreed or agreed that ‘nuisance alarms occur frequently’, compared with only 44% after (n=11 of 25; p<0.001). Similarly, prior to testing, 68% of nurses (n=26 of 38) either strongly disagreed or disagreed that ‘the bedside nurse is able to receive and respond to every alarm appropriately and quickly’ compared with only 24% of nurses after (n=6 of 25; p<0.001). Additionally, prior to testing, the majority of nurses ‘estimate that clinical SpO2 alarms are missed and/or your response to a patient’s clinical oxygenation is delayed’ once per week or more (58%, n=22 of 38). On follow-up assessment, nurses felt that these events occurred once a month or less (72%, n=18 of 25, p=0.02).
Nursing satisfaction scores at baseline and 3 months after initial testing with low SpO2 alarm delay
Process and safety measures
The proportion of average initial alarm notifications to total alarm notifications did not change during early testing (figure 3, baseline 51%). Special cause variation was seen after the introduction of alarm system generation 3 and the third RN escalation algorithm, with a decrease to 40%. This reduction was felt to be an appropriate baseline for the new system. Baseline compliance with lead changes every 24 hours was 60%, and ultimately reached 85% (online supplementary figure 2).

Proportion of initial alarm notifications to total alarm notifications per monitored bed per day, by month. RN, registered nurse.
With regard to balancing measures, the per cent of SAFE scores greater than or equal to 4, per 10 patients, did not vary greatly (online supplementary figure 3). At baseline, 5% of patients received a SAFE score greater than or equal to 4. In January 2015, prior to any major interventions in alarm reduction, special cause variation was seen with an increase to 10% that was reflective of ACCU patient acuity changes not associated with this QI effort (including an increased use of mechanical circulatory support and inotropic agents). Importantly, there was not an associated increase in METs and floor to intensive care unit transfers. The per cent of patients who received a SAFE score of greater than or equal to 4 remained stable at 10% throughout the testing period, until special cause variation was again seen with a decrease to 7.5% in January 2017.
The rate of METs and CICU transfers per 1000 patient-days remained stable at an average of 2.8 METs and 2.5 CICU transfers per 1000 patient-days (online supplementary figure 4). Similar to the special cause variation seen in the average initial alarm notifications per monitored bed per day, special cause variation was seen in the rate of METs per 1000 patient-days in January to February 2018 and again in January to February 2019, concurrent with seasonal changes in patient acuity. There was no change in the rate of less-than-7-day readmission during the study period (approximately 6.8% throughout).
Discussion
We safely reduced the number of alarm notifications by 68% on a single paediatric ACCU over a 3.5-year period using QI methodology. The evidence-driven and novel interventions included high-reliability changes such as integrating new technology, implementing alarm logic and changing the nursing staff alarm notification process, including silencing the in-room monitor. The combination of these interventions enabled sustained improvements in initial alarm notifications for 18 months while monitoring overall alarm burden. Coincident with alarm reduction, nursing experience improved. Indicators of patient safety, including SAFE scores, rates of METs and CICU transfers, and readmissions remained stable during the intervention phase, demonstrating common cause variation.
Likely, this work was successful because of the multifaceted nature, addressing the human, organisational and technical factors needed to improve alarm systems within a hospital setting.18 Partnering with stakeholders such as clinical leadership, bedside providers and technical staff was critical. Our approach incorporated many evidence-based interventions previously shown to reduce alarm notifications,19 such as implementing alarm delays,20 changing ECG electrodes daily11 and generating algorithms for alarm notification.21 22 Previously, these strategies successfully decreased the number of alarms per patient-day over fourfold without compromising patient safety.11 23 This work builds on these examples, but uniquely includes the first detailed use of alarm logic in a paediatric population and the first described systematic approach to silencing alarms within patient rooms.
Customisation of alarm logic is increasingly recognised as an effective solution to reduce alarms.18 24 25 Graduated algorithms mean that for time-sensitive changes, the correct bedside providers are quickly notified and are able to respond appropriately, and for less time-sensitive changes, are not interrupted too early or too often. We capitalised on the ability to customise alarm logic, particularly with the low SpO2 alarm notification delays. Many paediatric low SpO2 alarms are artefact due to child movement, or transient and not representative of an actionable clinical change. The SpO2 delays achieved using QI methodology are greater than predicted at the outset of this work, but the measured safety data strongly support the value of these parameters. Opportunity likely remains for additional delays and refinement.
Nursing staff satisfaction was prioritised as an outcome given evidence that reducing non-actionable alarm frequency is associated with improved nursing satisfaction and morale.22 A decrease in alarm notifications can also help reduce nursing’s perceived workload and improve work environment satisfaction.26 27 Following interventions, ACCU nursing staff felt that they were more sensitive to alarms, that alarm notifications were more likely to alert them to important changes in the patient’s condition and that alarms were less likely to be a nuisance. Subsequent efforts to measure the correlation between nursing staff retention and the unit alarm environment would be warranted.
Guidance on alarm management is available,28 but evidence-based ‘best practice’ alarm utilisation guidelines do not yet exist in paediatric populations,29 so our improvement team was empowered to challenge typical alarm conventions. Current alarm systems like ours employ a number of visual and auditory redundancies under the premise that more alarms are better. Therefore, silencing the in-room alarm volume was one of our most notable challenges to typical alarm management. The QI and nursing team observed that once alarms were consistently delivered to the individual and targeted provider, in-room audible signals seemed overly redundant, and served to awake/irritate/traumatise patients and families. Patients and caregivers desire that alarms are not heard in the patient room,30 but testing this idea has not been previously reported. Assessing this intervention’s effect on patient and family experience is ongoing, but first-hand reports continue to support its utility. The practice required significant change management and partnership with all key stakeholder services. However, it has been one of the most popular changes among the staff and families. Importantly, a wireless network outage demonstrated that the intervention is easily reversible if needed, simply by turning the alarm monitor volume back on.
Limitations
Given the lack of ‘best-practice’ evidence, we employed a conservative approach to testing. The safety balancing measures were monitored carefully for special cause variation, and the improvement team remained sensitive for sentinel patient events that could be associated with delayed alarm recognition (such as ACCU codes or patient deaths, of which there were none). However, this study was not powered specifically to detect differences in patient safety outcomes.
Two areas of limited measurement include the clinical activity of the nursing team and the patient/family experience. Night shift nursing documentation of clinically actionable alarms was comprehensive, but was dependent on subject participation and was not monitored throughout the study period. Assessing the rate of current non-actionable alarms in a more rigorous fashion may be an important next step for future studies, such as with the use of video-assisted tracking.10 31 Such tracking could assist in an improved understanding of the optimal initial to total alarm notification ratio, as we believe a proportion of 40% represents a reasonable amount of actionable initial notifications, but the ideal amount is unknown. Similarly, patient/family experience was not optimally measured over the course of this work. Anecdotal experience suggests that the alarm notification reduction has a positive impact on patients and families, as has been previously described,27 but there is not quantifiable evidence to support this aspect of the work.
The interventions described may be challenging to implement at institutions without technical support, the capability to measure alarms and notifications and familiarity with QI methodology. The results may also have been influenced by secular trends or other unmeasured factors. Additionally, this was a single-unit study with a specific patient population, and the findings may not generalise to other populations or institutions. However, the ACCU population is a complex and fragile patient group, and given the absence of negative impacts on patient safety, these findings can be suggested to apply fairly to other patient populations.
Conclusions
Alarm notifications were reduced successfully, with a correlating improvement in nursing satisfaction and without a negative impact to patient safety, using a multidisciplinary approach and QI methodology. The learnings and results, from a tertiary care unit with medically fragile patients, could be considered for testing within other inpatient populations with similar or less complexity. Currently, these practice changes are spreading to all units across our hospital system. In addition, the team is pursing active partnership with other paediatric institutions to examine the results of spread. Tailoring the alarm interventions presented here to other populations may improve the quality of care for hospitalised children and the inpatient experience for our patients, families and staff, while maintaining the highest standards for patient safety.
Acknowledgments
The authors acknowledge Paula Eldridge, Sarah Schoborg and Ali Patterson for design and initial interventions. The authors thank Pat Brady, David Cooper, Chris Dandoy, Christopher Jordan and the Anderson Center staff, including Drew Warmin, for their support. The authors also thank nursing leaders, staff, patients and families on the ACCU. The authors appreciate the efforts of Tricia Purcell, Tony Johnston, Marianne James, the Monitor Oversight Committee, Mike Eurich, Kevin Ferguson, Chad Olson and the entire Philips team.
References
Supplementary materials
Supplementary Data
This web only file has been produced by the BMJ Publishing Group from an electronic file supplied by the author(s) and has not been edited for content.
Footnotes
Contributors JB, RC, ME, TKS, ACS and NLM were involved in the study conception and design. CMP, JB, RC, ME and NLM were involved in the study testing and implementation. CMP, TKS, JB, RC, ME, ACS and NLM were involved in the data analysis and interpretation of results. CMP, TKS, ACS, CLS and NM were involved in final data analysis and manuscript drafting. All the authors critically revised the manuscript.
Funding The authors have not declared a specific grant for this research from any funding agency in the public, commercial or not-for-profit sectors.
Competing interests None declared.
Patient consent for publication Not required.
Ethics approval This improvement work fell within the institutional review board’s guidance for quality improvement projects that did not constitute human subjects research.
Provenance and peer review Not commissioned; externally peer reviewed.
Data availability statement All data relevant to the study are included in the article or uploaded as supplementary information.