Article Text

Statistics from Altmetric.com
- healthcare quality improvement
- human factors
- patient safety
- organizational theory
- continuing education
- continuing professional development
In the past 15 years, SEIPS (Systems Engineering Initiative for Patient Safety)1–3 and related conceptual models4 5 were developed to study and improve healthcare. These theoretical models depict how work systems affect health-related outcomes, such as patient safety, and can be used to guide research and improvement efforts. Various versions of the SEIPS model have been used by academics and practitioners, but a recent review argued that broader use and benefits can be achieved through ‘an easy-to-use version of the model and simplified tools for model application’.6 This concords with repeated requests we have received for simple, practical tools to apply SEIPS and with the general critique regarding the dearth of easy to use systems engineering tools.7
Accordingly, we offer SEIPS 101, a simplified, practice-oriented SEIPS model meant for easy use by practitioners, researchers and others, regardless of prior familiarity with SEIPS. We also for the first time present seven simple SEIPS tools virtually anyone can use off-the-shelf.
The SEIPS model
The SEIPS model is a theoretical model rooted in human-centred systems engineering or ‘human factors/ergonomics’.8 9 All versions of the model depict three major components, the work system, processes and outcomes; key characteristics or factors of each; and how the components affect one another. The SEIPS model has been used to understand or design sociotechnical systems and has supported evaluation, planning and research activities. The first version of the SEIPS model was published in 2006 in this journal by Carayon and colleagues,1 based on work dating to the 1980s.10–12 The next addition to the SEIPS family was SEIPS 2.0, proposed by Holden et al 3 primarily to address the work done by patients, families and other non-professionals. SEIPS 2.0 made theoretical expansions to the work system, processes and outcomes components and introduced the configural diagram tool. Carayon et al’s2 SEIPS 3.0 was subsequently published to further elaborate the processes component and promote attention to the patient journey as it unfolds over time and space.
SEIPS 101
Unlike its predecessors, the SEIPS 101 model (figure 1) does not expand the theory of sociotechnical systems in healthcare. Instead, it is a simplified, practically minded sketch of the most essential SEIPS components. SEIPS 101 is designed to be streamlined, memorable and thus easier to understand, replicate and use. The SEIPS 101 model retains the three major SEIPS components, represented by unique shapes in the figure: work systems (square); work processes (triangle) and work outcomes (circle). Work systems are comprised of interacting structural elements that together produce performance. Every work system minimally has the components people, environments, tools and tasks, whose first letters spell ‘PETT’. The environments, fully described in other SEIPS models, are physical, socio-organisational and external. The physical environment refers to physical layout, location and factors such as lighting, noise and temperature. The socio-organisational environment describes the attributes of an organisational unit (eg, a hospital, department, clinic, home or programme) such as structure, procedures, roles and responsibilities, relationships and organisational culture. The external environment is that which affects the unit of interest from outside, for example, the regulatory, legal, economic, political, cultural or societal contexts.
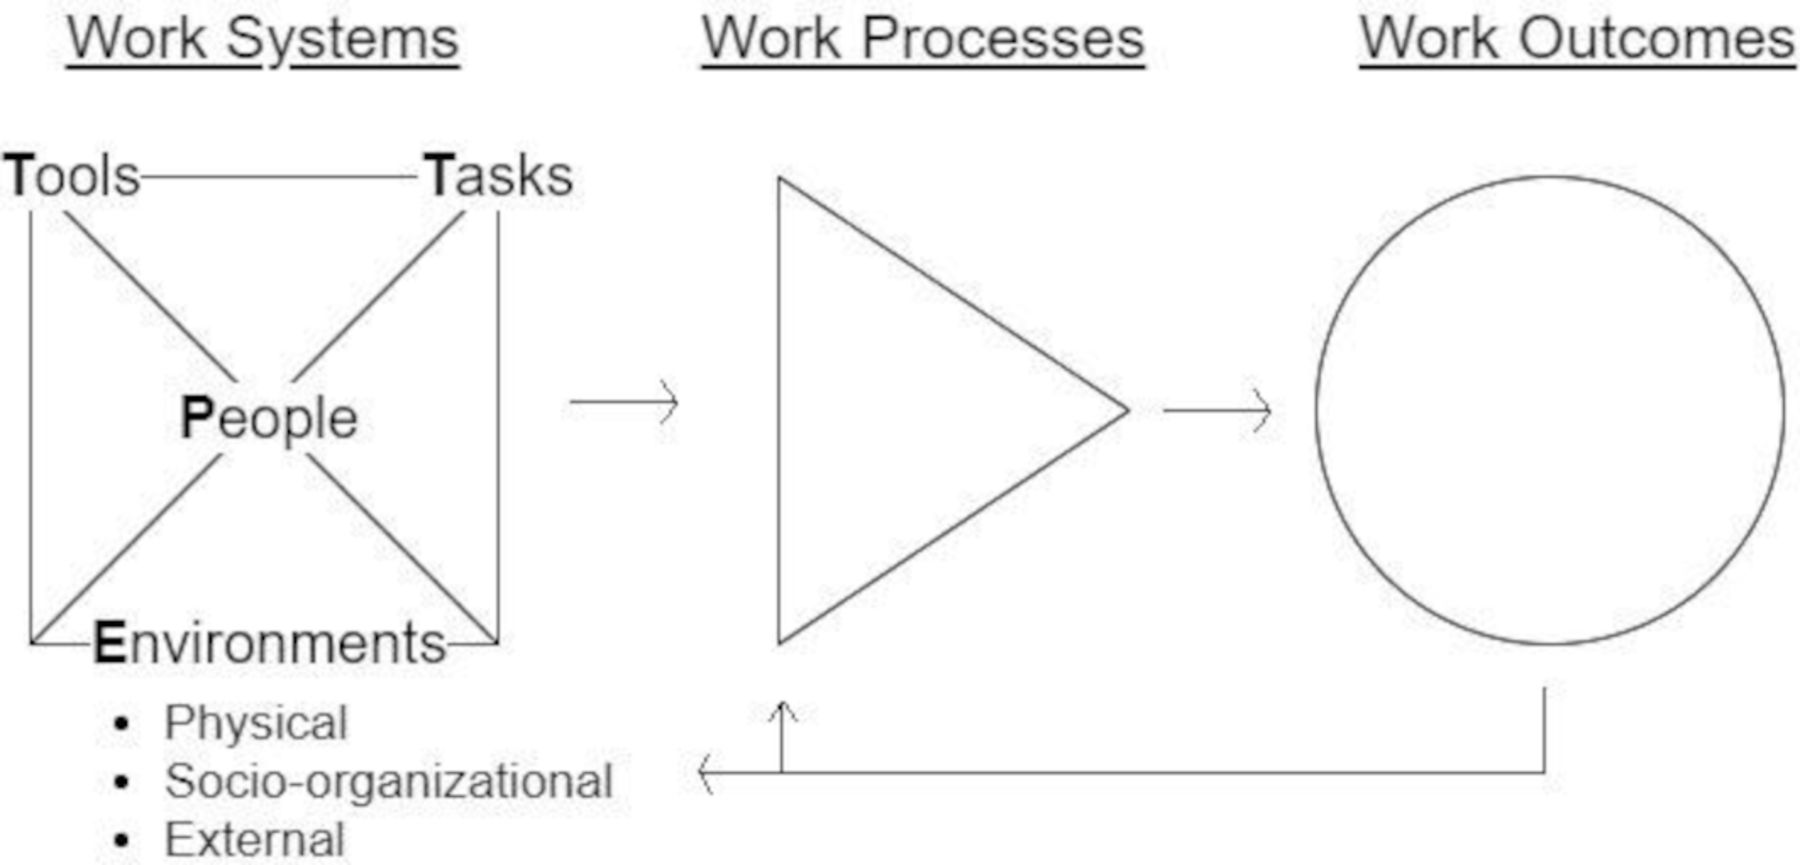
SEIPS 101 simplified model. Work systems are depicted by a square, evoking the iconic ‘connected boxes’ visualisation of person-centred systems: an interconnected set of factors with people in the centre. Work systems shape and produce work processes, depicted as a triangle to convey flow from left-to-right. The end results are work outcomes, drawn as a circle for the ‘O’ in outcome. Arrows represent causal feedback loops. Several details are omitted for simplicity. SEIPS, Systems Engineering Initiative for Patient Safety.
Work processes are how the work is done and how it flows. Work processes are physical, cognitive, social-behavioural or a combination.4 They can be performed by healthcare professionals, patients and families or collaboratively between professionals and nonprofessionals. Work outcomes result from work systems and work processes. These are desirable or undesirable, distal or proximal. They affect professionals, patients/families or the organisation. Arrows between systems, processes and outcomes represent causal feedback loops.
Using SEIPS 101
SEIPS 101 can be used in projects as a theoretical or practical framework to guide activity. All parts of SEIPS 101 (people, environments, tools, tasks, processes and outcomes) can be observed, measured, analysed and manipulated, though how this is done will vary case-by-case.13 A project or analysis should address each part but not necessarily every variation or combination. For example, a hospital service may be characterised by hundreds if not thousands of people, environments, tools, tasks, processes and outcomes. The millions of combinations of these components are unrealistic to depict, analyse or design, so the goal should be to attend as much as possible to the relevant people, environments, tools, tasks, processes and outcomes. A deceptively simple use of SEIPS 101 is drawing it (see online supplemental appendix A), because visual representations are powerful for conveying meaning, convincing others, memorising and achieving common understanding.14 15 One might draw the SEIPS 101 model to orient their team to the essential SEIPS components that will be considered in a project or to explain how changing downstream outcomes requires the redesign of upstream work systems and processes.
Supplemental material
Seven simple SEIPS tools
To aid further practical applications of SEIPS, we offer and illustrate seven simple SEIPS tools. Based on our and others’ work with SEIPS, we selected tools we could easily describe and illustrate. We also selected tools both novices and experts in systems engineering, practitioners and researchers, could use ‘off the shelf’. As with any tool, collaboration or consultation with systems engineering experts and experience and skills gained using these tools in practice, can enhance efficiency and effectiveness. The tools can be used alone or in any combination. For each tool, we state the SEIPS model components to which it relates and its primary uses. It often helps to adapt these tools to specific projects—another time when tool users may benefit from expert involvement—as seen in illustrative cases below and other published examples.16 17 For instance, Zisberg et al implemented an in-hospital mobility intervention by adapting SEIPS 2.0 to: define the primary outcome of interest; study people (eg, attitude) and whole-system factors associated with in-hospital mobility; develop and adapt an intervention strategy; and implement the intervention.17
Tool #1: PETT scan
The PETT scan (box 1) is a checklist and documentation tool to ensure one considers the full breadth of the work system, namely its people, environments, tools and tasks. Moreover, PETT scans are commonly used to indicate the presence of barriers or facilitators for each of the PETT components or for component-component interactions. Barriers and facilitators are aspects of the components or their interactions that either hinder or support the people in the work system, for example, their ability to do their ‘job’ or interact with other care team members or their experience (eg, satisfaction, frustration) with the work.18–20 One can quantify barriers and/or facilitators for a given case by assigning each observed barrier/facilitator to one or more PETT categories. These can be visualised as counts or proportions (eg, as a radar chart depicting one’s ‘barrier profile’21). Table 1 illustrates how the PETT scan was used in prior studies to analyse the systems barriers and facilitators shaping patient work (abdominal surgical patients’ transition-related work), clinician work (nurses’ performance of their jobs) and collaborative work (family engagement in paediatric hospital rounds).22–24 A template for the PETT scan is provided in the online supplemental file.
PETT scan
SEIPS components addressed: the work system component, that is, the people, environments, tools, tasks and the interactions between them.
Primary uses: to describe or design the interacting parts of the entire sociotechnical system, especially when attempting to simply depict a complex system.
PETT, people, environments, tools and tasks; SEIPS, Systems Engineering Initiative for Patient Safety.
Examples of PETT scan
Overall, the PETT scan is a flexible tool and can be used for at least the following:
Project planning: to know which factors to consider.
Intervention design: to know which factors to address.
Intervention implementation: to anticipate how changes affect all work system factors.
Intervention evaluation: to assess effects on an array of factors.
Data collection: to specify methods for capturing each factor.
Analysis: to classify data into categories of factors.
Reporting: to present results according to the factors.
Prioritising: to select the priority order among the various factors.
Tool #2: people map
The people map (box 2) represents the various people involved in a work system and how they relate or interact in practice, not as idealised on an organisational chart. Because people perform tasks and roles, a people map can also show which people or groups perform which activities and how they interact with each other in a role network.25 26 People maps may use:
Shapes to represent roles (eg, patient, pharmacist), individuals (eg, Patient 1, Patient 2) or types (eg, spouse, child).
Shape size to represent relative frequency or importance.
Proximity to represent geographic/social distance or groupings.
Lines or arrows to represent relationships and interactions between people.
People map
SEIPS components addressed: the people component of the work system and to a lesser extent the tasks those people perform.
Primary uses: to describe the various people involved and how they interact or relate to one another, especially to reveal insights about the properties of social networks (eg, the centrality of a given role) or to contrast distinct ‘types’ of person or groups of people (ie, personas).
SEIPS, Systems Engineering Initiative for Patient Safety.
Figure 2 offers example people maps based on heart failure care research.21 27–35 Figure 2A simply depicts people on a clinical care team, whereas figure 2B shows how those individuals interact, revealing key insights such as the care coordinator’s central role as an information hub. Figure 2C shows how distinct types of people or systems—called ‘personas’27 28—can be shown on a people map to highlight key differences, for example, between patients with a full household but few outside friends versus patients living alone but surrounded by many distant friends and family. Despite the simplicity of this example, typical evidence-based personas can depict far more nuanced differences. Such personas become tools for designers to both understand the range of stakeholders or situations to be accommodated and accommodate each.36 For example, designers creating a technology or instructions for posthospitalisation self-care, may be influenced by the personas in figure 2C to design features for patients in both dense households and living alone.
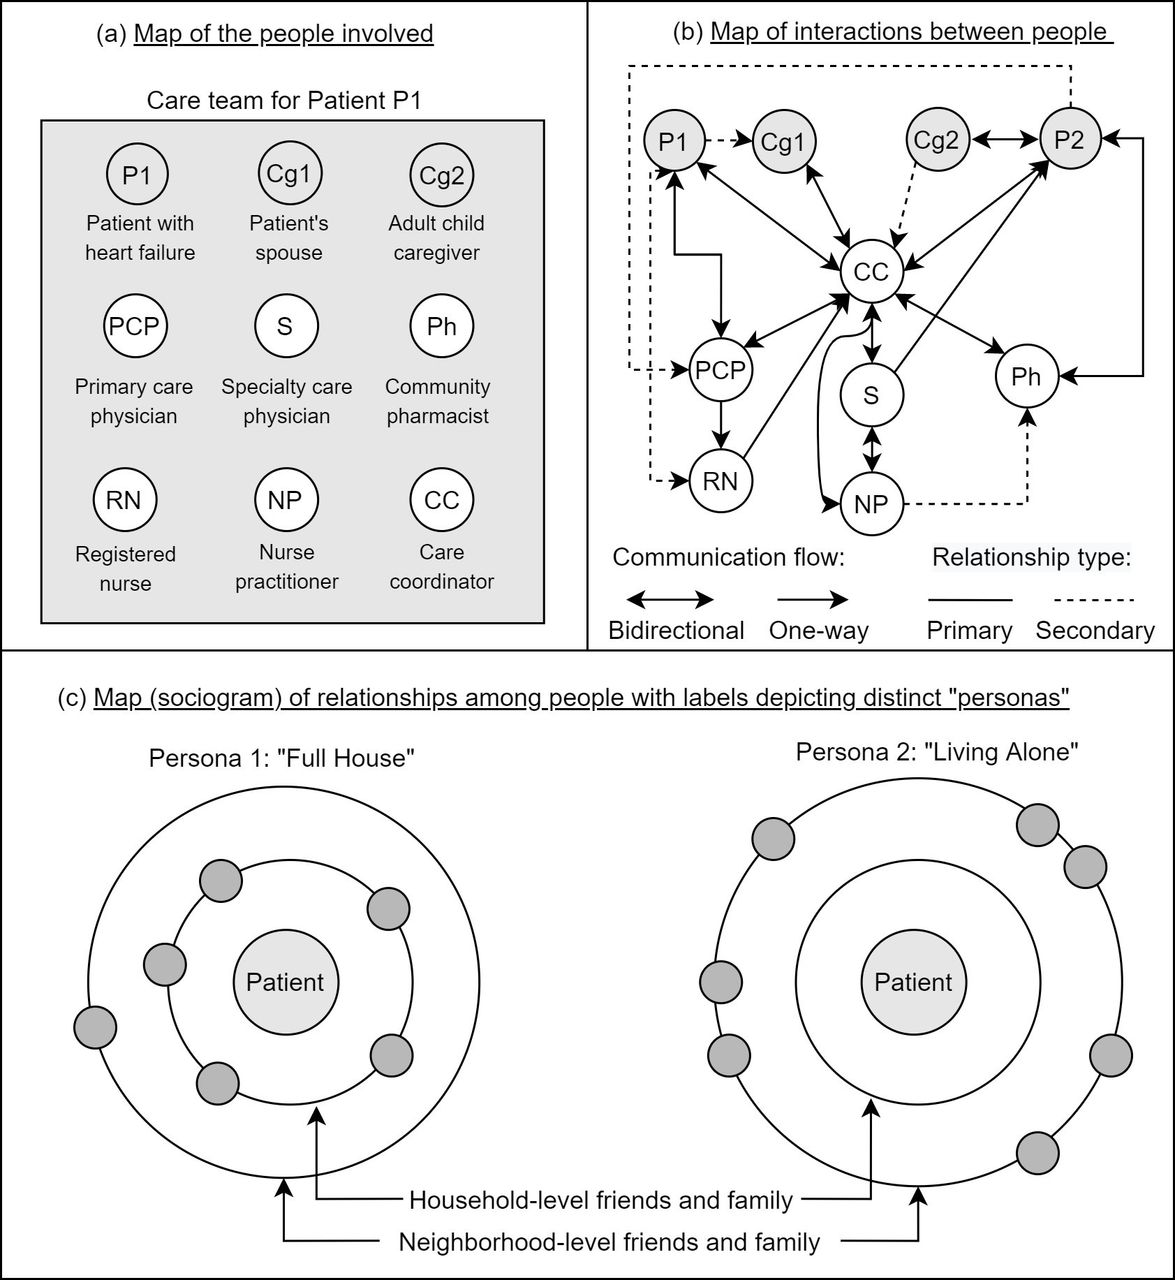
Example people maps. CC, care coordinator; Cg, caregiver; NP, nurse practitioner; P, patient; PCP, primary care physician; Ph, community pharmacist; RN, registered nurse; S, specialty care physician.
Tool #3: tasks and tools matrices
The tasks and tools matrices (box 3) describe the work system’s tasks, tools and task-tool interactions, illustrated in table 2 with results from an analysis of a care coordination programme.37 The tasks matrix lists and describes key tasks along the dimensions of who, why, how often, how and when each task is performed. Other dimensions (eg, the task’s criticality) can be added. The tools matrix documents key artefacts, instruments or technologies in the system and their users, purpose, use frequency, accessibility and estimated or measured38 usability. Tasks and tools can be ordered or organised, for example, by frequency, criticality or timeline (eg, before, during, after a home visit).37 The tasks X tools matrix depicts which tools are used for which tasks. Completing these matrices informs changes to tasks (eg, reassigning scheduling or having caregivers self-administer assessments) and tools (eg, replace handheld scanner with smartphone or tablet). Templates of these matrices are available in the online supplemental file.
Examples of tasks, tools and tasks X tools matrices based on a prior work system analysis of a community-based brain health care coordination programme37
Tasks and tools matrices
SEIPS components addressed: The tasks and tools components of the work system.
Primary uses: to enumerate, describe and evaluate tasks and tools, often to design or redesign them or to identify gaps between the tasks performed and the tools available.
SEIPS, Systems Engineering Initiative for Patient Safety.
Tool #4: outcomes matrix
An outcomes matrix (box 4) identifies and organises the various outcomes of interest, whether they represent project goals, measures to be collected or evaluation criteria. Not every outcome needs to be depicted or measured but a thorough analysis of outcomes for various stakeholders, including attention to proximal and distal as well as desirable and undesirable outcomes,3 can be useful for planning or evaluation. In light of our human-centred systems approach based on human factors and ergonomics,39 it is important to consider outcomes for various stakeholders and to achieve an optimal balance of outcomes across stakeholders, such as patients, informal caregivers, clinicians and healthcare organisations. For instance, a project aimed at improving an infection prevention practice should achieve improvement in patient safety (eg, reduction of hospital-acquired infections) while avoiding additional stress and negative outcomes for physicians and nurses (eg, due to additional steps or tasks and increasing burden). Therefore, we recommend that outcomes be balanced across all key stakeholders relevant for the particular project or study. Outcomes can also be ranked or rated on priority, likelihood or other dimensions and their measures specified.16 A template outcomes matrix is provided in the online supplemental file.
Outcomes matrix
SEIPS components addressed: the outcomes component.
Primary uses: to proactively or reactively identify the relevant outcomes to consider, especially when needing to comprehensively document multiple types of outcomes and their measures in an organised manner.
SEIPS, Systems Engineering Initiative for Patient Safety.
Tool #5: journey map
The journey map (box 5) or process map is a tool to explain one or more work processes while simultaneously depicting other relevant factors or conditions over time. Figure 3 has examples of simplified journey maps: one for a patient experiencing a change in their medications40 (figure 3A) and one for bedside rounding in a paediatric hospital41 (figure 3B). There are many tools for depicting process or workflow, with great variation in what is presented and how this is done.42–44 For example, some process maps contain merely the steps in a process or a list of activities organised by their goals and subgoals. A journey map is a popular variety of process map very well aligned with SEIPS concepts.2 The journey map can be used as a tool to represent how people interact dynamically with other people, tasks, tools and environments over time. Journey maps can depict touchpoints in the process where interactions occur, feelings elicited by the interactions, barriers or ‘pain points’ that affect the journey, alternative paths or variations and changing conditions or relationships (eg, demands vs capacity). By leveraging colour, imagery, spatial relationships and other visualisation techniques, journey maps often convey multidimensional information in a salient, usable and memorable way.45
Journey map
SEIPS components addressed: the process component, often simultaneously with work system and outcomes components.
Primary uses: to depict a process over time and how work system conditions and outcomes change during the course of the process, often used to identify problems or patterns that will need to be addressed when modifying or designing a process or system.
SEIPS, Systems Engineering Initiative for Patient Safety.

Example journey maps.
Tool #6: interactions diagram
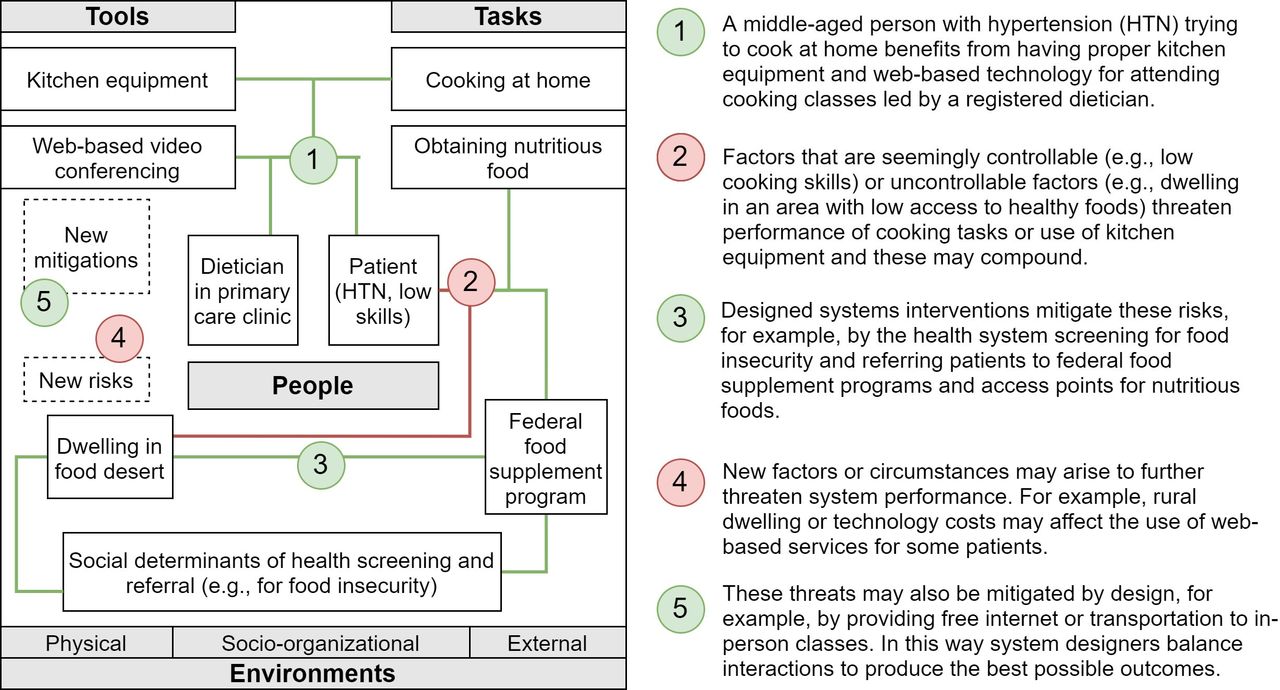
This tool (box 6)—also called the configural diagram3 13 29 46—depicts how work system factors interact. Showing these interactions helps explain ‘why’ something happened or is happening, from a whole-systems perspective. Interactions diagrams are not meant to be fully inclusive; they are better suited to show only the most relevant or consequential factors and interactions. Figure 4 applies the interactions diagram to show how multiple factors combine and affect or mitigate each other to shape nutrition for hypertensive patients living in food deserts. Even in the face of seemingly uncontrollable factors (eg, where patients dwell), the system can result in good performance, depending on the interactions of all relevant system factors (eg, programmes to screen for and address food insecurity). Similar diagrams could be drawn to describe whole-system interactions associated with episodic or long-term outcomes at different levels of analysis, for example, a single patient’s exercise behaviour, staff burnout in a hospital unit or quality outcomes across the state’s primary care clinics.
Interactions diagram
SEIPS components addressed: the interactions in the work system component.
Primary uses: to depict the relevant subset of work system factors whose interactions are meaningful, often with the intent to select the aspects of a system to address during design. A second use is to draw comparisons of two or more sets of system interactions.
SEIPS, Systems Engineering Initiative for Patient Safety.
Example interactions diagram.
Another use of interactions diagrams is comparing the contributing system factors between:
Settings: for example, hospitals, units, regions, clinics differing in size.
Populations: for example, by age, condition, race/ethnicity.
Teams: for example, interprofessional versus not, Red Team versus Blue Team.
Processes: for example, medication ordering versus dispensing versus administration.
Outcomes: for example, high versus low performance, harm versus no harm.
Time: for example, years, seasons, pre-post an intervention.
Systems or approaches: for example, Design 1 versus Design 2, Approach A versus B.
Tool #7: systems story
Storytelling is a tool pervading time and culture. Stories are compelling and easy to understand, remember, reshare and repurpose, yet convey much information and complexity.47 The systems story tool (box 7) is a story frame (or logic model) about how things happen in systems according to SEIPS: how the system’s design produces changes in processes, thus resulting in different outcomes. This tool is often used to frame a persuasive or memorable argument about how work systems, processes and outcomes are related. An example systems story contrasts hospital systems’ responses to the COVID-19 crisis:48 49
Militaristic mindset: the system’s blame culture and mistrust of frontline clinicians produced top-down, centralised decision-making processes, causing outcomes of stress and less creative solutions.
Agile mindset: the system’s agile culture and trust in frontline clinicians empowered local teams to employ innovative, experiment-based processes, producing outcomes of time savings and innovative solutions.
Systems story
SEIPS components addressed: the combination of work system, processes and outcomes.
Primary uses: to frame a story about how work systems, processes and outcomes are related, often to make a persuasive or memorable argument to one’s audience.
SEIPS, Systems Engineering Initiative for Patient Safety.
Once the systems story is framed, telling the story is also important; one should take advantage of powerful storytelling formulas such as comparing opposites (eg, heroes and villains, the tale of two cities), use of repetition and parallel structure, the problem-resolution story device or triumphs of the underdog.
Conclusion
SEIPS 101 and the seven simple SEIPS tools intend to make SEIPS more usable and useful, especially for practitioners and others who may be less acquainted with SEIPS or its uses. The tools are based on our and our colleagues’ experiences but require validation and evaluations of ease of use and usefulness. Such evaluation might assess the extent to which the models and tools allow users to accomplish their tasks effectively, efficiently and satisfactorily, per the standard international definition of usability. Following usability engineering practice, the model’s and tools’ usability can be assessed by expert rating, user self-report and assessing performance during actual use.50
Over time, we anticipate consumers of SEIPS 101 and its tools will gain expertise with them, consult the broader literature on SEIPS and related work system models and approaches, report their experiences and adaptations of the tools and partner with other systems thinkers including formally trained human-centred systems engineers to improve efficiency and effectiveness. Ideally, future work will produce additional SEIPS tools and off-the-shelf methods, along with simplifications and tools derived from other theoretical frameworks, for easier and more useful practical application in quality, safety and health.
Ethics statements
Patient consent for publication
Acknowledgments
We thank the many collaborators, contributors, and advocates in the SEIPS community.
References
Supplementary materials
Supplementary Data
This web only file has been produced by the BMJ Publishing Group from an electronic file supplied by the author(s) and has not been edited for content.
Footnotes
Contributors RJH and PC jointly conceptualised and wrote this paper.
Funding The authors have not declared a specific grant for this research from any funding agency in the public, commercial or not-for-profit sectors.
Competing interests None declared.
Provenance and peer review Not commissioned; externally peer reviewed.
Supplemental material This content has been supplied by the author(s). It has not been vetted by BMJ Publishing Group Limited (BMJ) and may not have been peer-reviewed. Any opinions or recommendations discussed are solely those of the author(s) and are not endorsed by BMJ. BMJ disclaims all liability and responsibility arising from any reliance placed on the content. Where the content includes any translated material, BMJ does not warrant the accuracy and reliability of the translations (including but not limited to local regulations, clinical guidelines, terminology, drug names and drug dosages), and is not responsible for any error and/or omissions arising from translation and adaptation or otherwise.