Article Text

Abstract
Background There is a need to reduce antimicrobial uses in humans. Previous studies have found variations in antibiotic (AB) prescribing between practices in primary care. This study assessed variability of AB prescribing between clinicians.
Methods Clinical Practice Research Datalink, which collects electronic health records in primary care, was used to select anonymised clinicians providing 500+ consultations during 2012–2017. Eight measures of AB prescribing were assessed, such as overall and incidental AB prescribing, repeat AB courses and extent of risk-based prescribing. Poisson regression models with random effect for clinicians were fitted.
Results 6111 clinicians from 466 general practices were included. Considerable variability between individual clinicians was found for most AB measures. For example, the rate of AB prescribing varied between 77.4 and 350.3 per 1000 consultations; percentage of repeat AB courses within 30 days ranged from 13.1% to 34.3%; predicted patient risk of hospital admission for infection-related complications in those prescribed AB ranged from 0.03% to 0.32% (5th and 95th percentiles). The adjusted relative rate between clinicians in rates of AB prescribing was 5.23. Weak correlation coefficients (<0.5) were found between most AB measures. There was considerable variability in case mix seen by clinicians. The largest potential impact to reduce AB prescribing could be around encouraging risk-based prescribing and addressing repeat issues of ABs. Reduction of repeat AB courses to prescribing habit of median clinician would save 21 813 AB prescriptions per 1000 clinicians per year.
Conclusions The wide variation seen in all measures of AB prescribing and weak correlation between them suggests that a single AB measure, such as prescribing rate, is not sufficient to underpin the optimisation of AB prescribing.
- antibiotic management
- general practice
- healthcare quality improvement
Data availability statement
Data may be obtained from a third party and are not publicly available. Data used for this project cannot be shared, however it can be obtained by application to CPRD.
This is an open access article distributed in accordance with the Creative Commons Attribution Non Commercial (CC BY-NC 4.0) license, which permits others to distribute, remix, adapt, build upon this work non-commercially, and license their derivative works on different terms, provided the original work is properly cited, appropriate credit is given, any changes made indicated, and the use is non-commercial. See: http://creativecommons.org/licenses/by-nc/4.0/.
Statistics from Altmetric.com
Background
Primary care accounts for 81% of antibiotic (AB) prescribing in England.1 AB overuse can lead to antimicrobial resistance (AMR) which is a major public health concern resulting in increased morbidity, mortality and healthcare costs. Without better action to tackle AMR, many common healthcare interventions and procedures could become too risky to undertake. Internationally, an estimated 700 000 deaths are attributed to AMR annually.2 Many initiatives have been taken to reduce the levels of AB prescribing by clinicians. For example, the TARGET toolkit provides information on ABs to prescribers and patients and the Quality Premium incentivises local healthcare organisations in England to reduce AB prescribing.3 4 Recently, the UK published its 20-year vision and 5-year national action plan on dealing with AMR and outlining risks from AMR and actions required to address them.5 The plan aims to reduce UK antimicrobial use in humans by 15% by 2024 (https://www.gov.uk/government/publications/uk-20-year-vision-for-antimicrobial-resistance).
Behavioural sciences are increasingly used to improve the effectiveness of interventions by focusing on understanding and changing behaviours.6 Several cluster randomised controlled trials (cRCTs) have shown promising results. A US cRCT tested the effects of several behavioural interventions and found that peer comparisons reduced rates of inappropriate AB prescribing for acute respiratory tract infections. The intervention involved emails being sent to clinicians that compared their AB prescribing rates with those with the lowest inappropriate prescribing rates (ie, ‘top performers’).7 In a UK cRCT, the provision of social norm feedback to high AB prescribing practices substantially reduced AB prescribing. In that trial, practices were included if their AB prescribing was at a higher rate than 80% of practices in its National health Service (NHS) Local Area Team. Since 2014, each practice in this group receives a letter from England’s Chief Medical Officer.8 This is an annual letter which was coordinated by Public Health England and sent from the Chief Medical Officer to general practices, giving feedback on their prescribing compared with other practices.9 Current national datasets include information on prescribing at practice level rather than individual prescribers, so feedback has always been on practice-level prescribing. A study on high-risk non-steroidal anti-inflammatory drugs (NSAID) prescribing done by Guthrie et al highlighted the importance of considering individual general practitioner (GP) prescribing habits. It was found that there was much more variation in high-risk prescribing between GPs than between practices and that targeting only practices with above-average rates would miss most high-risk NSAID prescribing.10 However, there is only limited information on the prescribing habits of individual GPs. The overall aim of this study was to evaluate the variability between individual clinicians in AB prescribing and assess how feedback on individual clinician prescribing could be targeted.
Methods
Database
This study used data from the Clinical Practice Research Datalink (CPRD GOLD). CPRD contains longitudinal, anonymised, patient-level electronic health records (EHRs) from general practices in the UK with more than 5 million active patient records representing about 8% of the UK population.11 The EHRs include the clinical diagnoses, medication prescribed, vaccination history, diagnostic testing, lifestyle information, clinical referrals, as well as patients’ age, sex, ethnicity, smoking history and body mass index. Prescriptions were classified using the British National Formulary (BNF) sections. The EHR software system automatically records the anonymous identification code for the staff member who enters the information into the EHR.
Study population
The study population included GPs and non-medical prescribers who had provided 500+ consultations at any time between 1 January 2012 and 31 December 2017. This 500+ selection was done in order to exclude temporary clinical staff (the median time between first and last consultation was 0.36 for excluded staff and 2.31 years for included staff). Systemic ABs included oral, rectal or intravenous applications (BNF chapter 5.1, except 5.19, 5.1.10, 5.1.11).
GP characteristics
Three sets of characteristics were assessed for each clinician. The first set were measures of AB prescribing which were based on all AB prescriptions by the clinician during the study period. The second set of measures described the case mix of patients consulting a clinician. This was based on a random 10% sample of the consultations between clinician and patient at the practice during the study period and clinical characteristics of the patients assessed at the date of these consultations (due to the large number of records). The third set of measures included for each clinician the rate of consultations for upper respiratory tract infections (URTIs), lower respiratory tract infections (LRTIs) and urinary tract infections (UTIs) and their level of coding of the indication for AB treatment in patients prescribed an AB.
The measures of AB prescribing included indicators of overall levels of AB prescribing, level of patients receiving multiple AB prescriptions over time, incidental AB prescribing (patients receiving ABs only infrequently), types of ABs prescribed and the extent of risk-based AB prescribing (whether ABs were prescribed more frequently to patients at higher risk of infection-related complications). The specific AB measures for each clinician included:
Crude rate of AB prescribing (ie, the number of AB prescriptions per 1000 consultations).
Age–sex standardised rate of AB prescribing. The age and sex distribution of the sample of patients consulting the clinician was used for this. The age categories were similar to those used to adjust for age–sex differences of practice populations.12
Level of incidental AB prescribing (number of AB prescriptions given to patients without history of AB use in 12 months divided by the number of AB prescriptions by the clinician).
Level of repeat courses (number of AB prescriptions with another AB previously prescribed to the patient in the previous 30 days divided by the total number of AB prescriptions).
Average number of AB prescriptions in 3 years before the date patients prescribed an AB. A previous study has reported that frequent AB use was associated with reduced effectiveness.13
Use of broad-spectrum types of all ABs prescribed by the clinician. The following types were considered broad spectrum: amoxicillin, ampicillin, co-amoxiclav, mezlocillin, cefaclor, cefadroxil monohydrate, cefalexin, cefixime, cefotaxime sodium, cefpodoxime proxetil, cefradine, ceftazidime pentahydrate, ceftriaxone sodium, cefuroxime, cefaloridine, cefalotin, cefamandole, cefodizime, cefsulodin, ceftaroline, ceftibuten, cefoxitin sodium, ciclacillin, cinoxacin, latamoxef disodium, ertapenem sodium, cilastatin sodium/imipenem monohydrate, meropenem trihydrate, aztreonam, ciprofloxacin, levofloxacin, moxifloxacin hydrochloride, nalidixic acid, norfloxacin, ofloxacin, sparfloxacin, enoxacin, grepafloxacin, rosoxacin and temafloxacin.
Predicted patient risk of infection-related hospital admission (if not using ABs). Predicted risks from a recently published study were used based on patients with incidental diagnoses of URTI, LRTI and UTI who had not been prescribed an AB. The individual risks for infection-related hospital admissions were based on predictors including age, sex, clinical and medication risk factors and ethnicity separate for each infection.14 These predicted underlying risks were applied to incidental AB users in the study population (ie, those without prior AB prescribing in 6 months before). In the absence of a record for URTI, LRTI or UTI, a standardised predicted risk was used based on the relative frequencies of these infections in each sex and 10 years age group.
Number Needed to Treat (NNT) to prevent one hospital admission in patients prescribed an incidental AB. This is an epidemiological measure that indicates how many persons need to be exposed to a risk factor to prevent harm in one additional person.15 It was assumed in this analysis that ABs reduced the risk of infection-related hospital admissions by 25% (this was an assumption as no reviews could be found with trial data on the AB effects on hospital admissions). The predicted patient risk of infection-related hospital admission and this effect estimate of 25% was used to estimate the NNT. The interpretation of this NNT is that a lower number may indicate more benefit with the AB and higher number less benefit. The reason that NNT varies between clinicians is related to the patient risks but not the effect estimate.
The consultation rate for URTI, LRTI and UTI was also assessed for each clinician calculated by the number of EHRs for these infections divided by the number of consultations for each clinician. Furthermore, the level of coding in the EHR of the indication for AB treatment by each clinician was assessed. The presence of an EHR entry for a broad set of common infections at the date of the AB prescriptions or in the 30 days before was assessed. This information is typically entered at the start of a new treatment and less likely for repeat AB courses. This variable determined the rate of coding but did not include any free-text information entered into the EHR (which clinicians can also use to record information; this is not available to researchers).
A propensity score was estimated providing an estimate of the case mix of patients consulting each clinician. It was calculated from a logistic model that estimated the OR of getting an AB prescription in the sample of consultations. Predictors in this logistic model included age, sex, Charlson Comorbidity Index, vaccination in the 1 year before, the number of consultations in the 1 year before, and referral in the 1 year before, smoking history, region, month of the year and a missingness indicator for smoking history. A missingness indicator for smoking history was used in the logistic model. The model output was then used to estimate the probability of getting an AB for each of the patients included in the random sample of consultations. For the patients consulting a clinician, the average of this probability was then estimated providing a summary estimate of the case mix of each clinician.
Statistical analysis
The ranges of of the AB measures and consultation rates were estimated and presented by different percentiles. The correlations between these measures were estimated by Spearman correlation coefficients. These were presented in a heat map which graphically presented the correlations (red indicating strong positive correlations, white no correlations and blue strong inverse correlations). Poisson generalised additive mixed effects models (GAMMs) with different AB rate measures as outcome (such as crude AB prescribing rate) were fitted. The GAMMs included a random intercept for clinician, propensity score representing the average case mix of each clinician and the coding level of each clinician. In these random intercept models, a term was added to the regression model capturing the variation between clinicians providing an estimate of the distribution of this variation. This random effect term was assumed to follow the normal distribution with an average of zero and fitted within Poisson regression models.16 17 The variance of the clinician random effect quantified the level of variation in AB prescribing between clinicians. The relative rate (RR) comparing different percentiles (such as the 5th and 95th percentiles) was calculated using the estimated SD of the random effect.16 GAMMs with just a random intercept for practice were also fitted in order to evaluate the variation in AB prescribing between practices.
Another analysis evaluated the relative importance of the various AB measures by estimating the number of AB prescriptions that could be avoided with hypothetical reductions in prescribing to different percentile thresholds (as based on percentiles such as the median of a measure across clinicians). For clinicians with prescribing above a percentile threshold, the number of AB prescriptions was reduced to the threshold as based on peer prescribing. For the measures of the number of ABs received in the 3 years before and NNTs, this was done by stepwise removal of the AB prescription with the highest value until the percentile threshold was reached. All analyses were performed using SAS software V.9.4.
Results
A total of 6111 clinicians from 466 general practices was included in this study. The characteristics of AB prescribing by clinician are shown in table 1. The overall rate of AB prescribing varied considerably. The 5th percentile in the crude rate of AB prescribing by clinician was 77.4 AB prescriptions per 1000 consultations and the 95th percentile was 350.3. Standardising by age and sex did not reduce this variability (age–sex standardised AB rates ranged from 73.5 to 334.7). Clinicians also varied in their propensity of giving repeat AB courses. The 5th percentile of the percentage of AB prescriptions given to patients with a prior AB in the 30 days before was 13.1% and the 95th percentile 34.3%. The use of broad-spectrum AB types varied between clinicians from 25.7% of all ABs prescribed (5th percentile) to 51.2% (95th percentile). As shown in online supplemental table 1, there was considerable variability in the case mix seen by clinicians. The percentage of patients aged 75+ years in those consulting a clinician ranged from 4.0% to 27.0% (5th and 95th percentile). Online supplemental table 2 gives the distribution of the numbers of observations per clinicians for the main AB measures.
Supplemental material
Distribution of measures of AB prescribing between different clinicians
Adjusted RRs comparing different percentiles in the distribution of different measures of AB prescribing of clinicians (based on random effect models) are shown in table 2. The adjusted RR for the overall rate in AB prescribing was 5.23 comparing the 95th with 5th percentile. The variation between practices was smaller (crude RR of 2.68 comparing the 95th with 5th percentile).
RRs for different AB-prescribing measures comparing clinicians or practices in random effect models
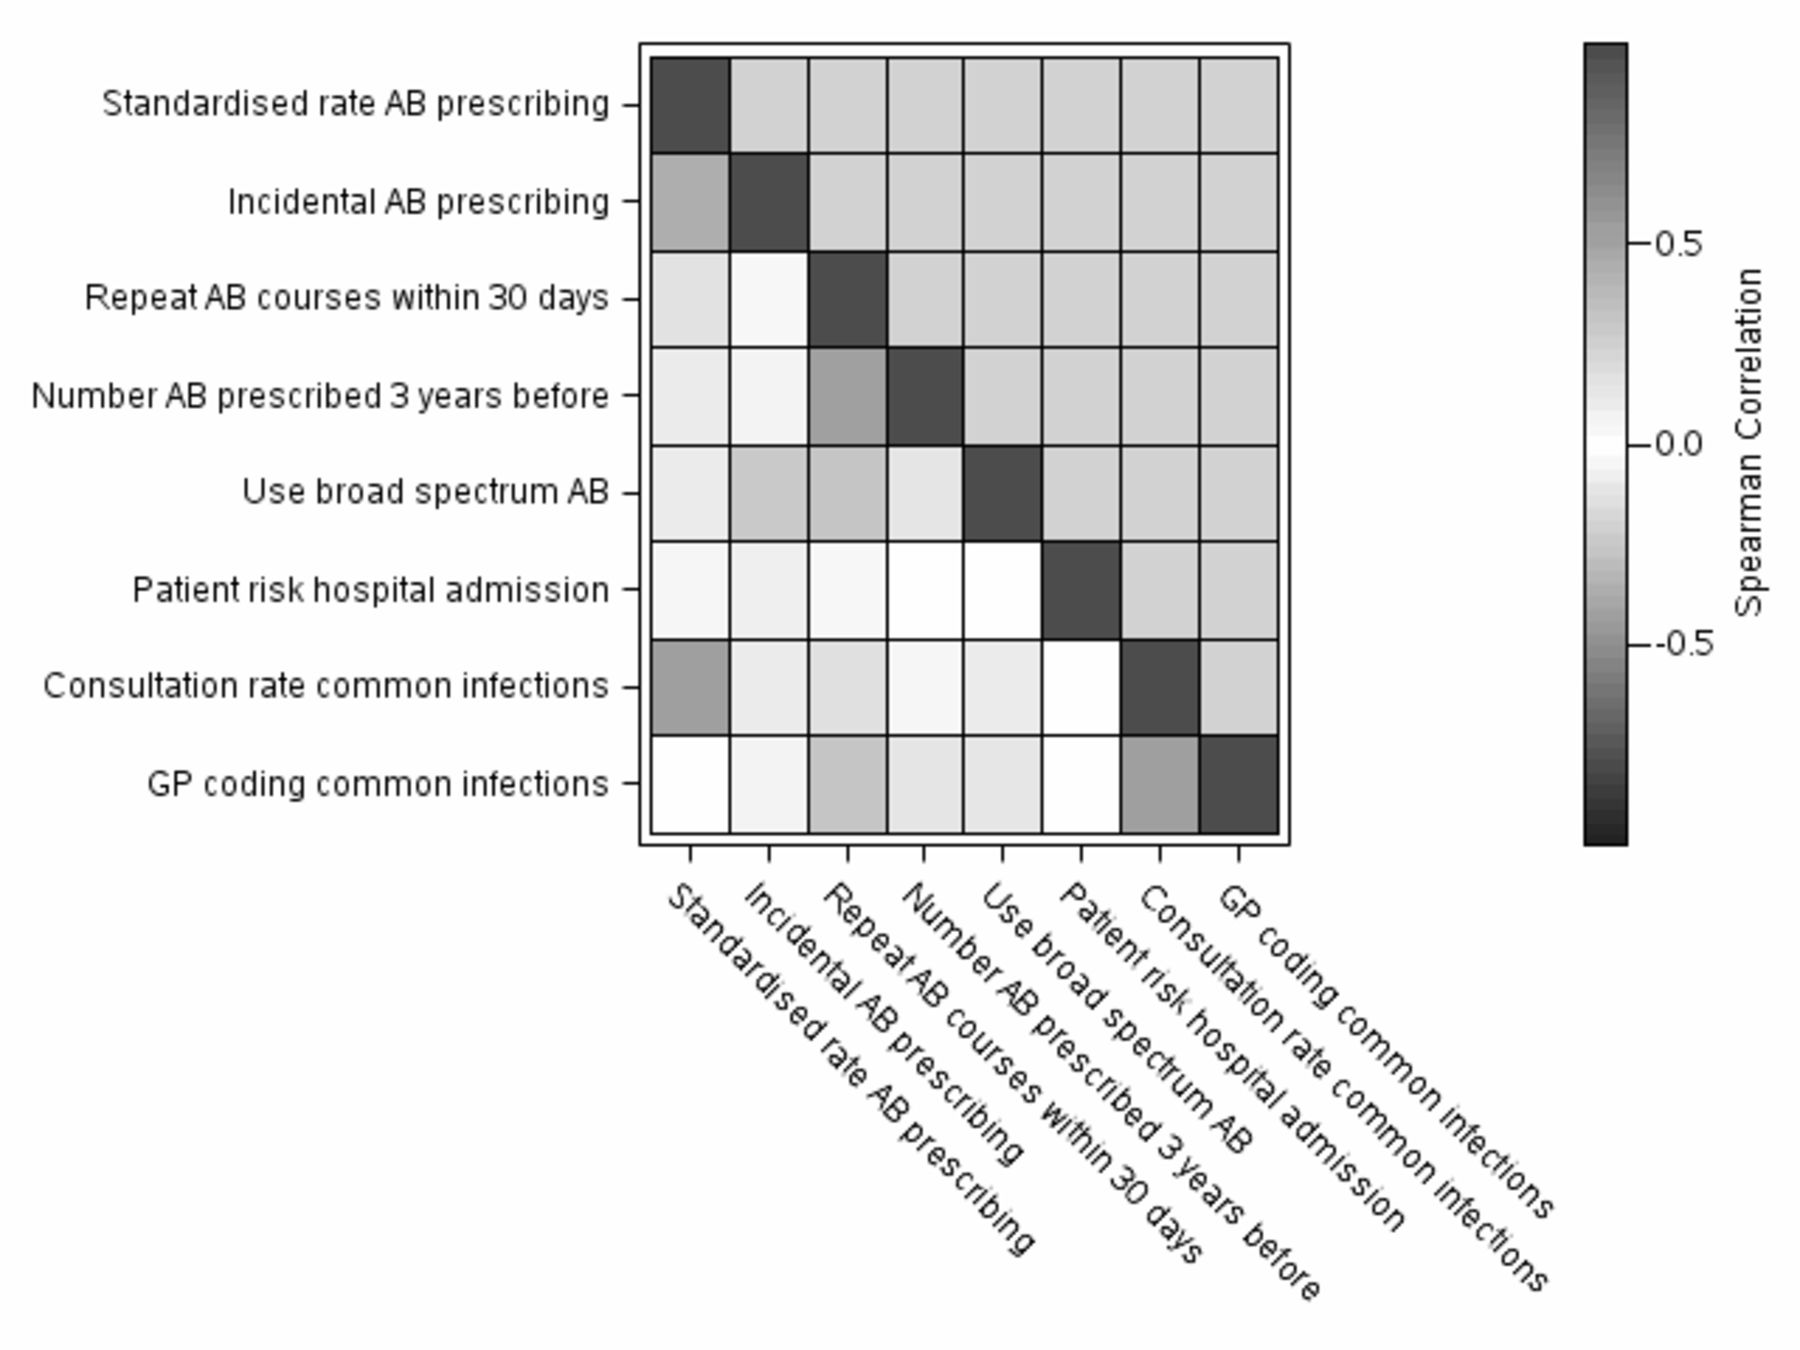
There was a lack of correlation between most of the AB measures as shown in a correlation heat map (figure 1; online supplemental table 3). Only measures that covered overlapping domains (such as level of incidental AB prescribing and repeat AB courses) had higher correlation coefficients. The use of broad-spectrum ABs was inversely but weakly associated with repeat AB courses within 30 days (correlation coefficient of −0.25). The rate of coding for common infections by clinicians was only weakly associated with the various AB measures (correlation coefficient of −0.01 with the standardised rate of AB prescribing) and moderately with the rate of common infection (correlation coefficient of 0.54).
Heat map of Spearman correlations between various measures of AB prescribing, coding of common infections and consultation rates for common infections. AB, antibiotic; GP, general practitioner.
Table 3 provides estimates of the number of AB prescriptions that would be avoided by reducing the prescribing of clinicians to various percentile thresholds (such as the median across all clinicians in the rates of AB prescribing). A reduction of overall levels of AB prescribing to the median level of peer clinicians would save 87 711 AB prescriptions (per 1000 clinicians per year). Reducing AB prescribing based on risk-based prescribing and NNTs had a larger impact compared with the other specific AB measures especially when using higher percentile thresholds. Online supplemental table 4 presents the frequencies that clinicians exceeded prescribing percentile thresholds for six AB measures.
Number of ABs that would be avoided by reducing clinician prescribing to various percentile thresholds for various AB-prescribing measures
Discussion
This study found that there was considerable variability between clinicians in the level of prescribing for a variety of AB measures, with low correlation between these AB measures. The largest potential impact to reduce AB prescribing could be around encouraging prescribing based on risk of infection-related hospital admission (and NNT) and addressing repeat issues of ABs.
Performance indicators and targets are regularly used in healthcare systems. Examples are the Quality Outcomes Framework (QOF) in the UK providing financial incentives based on meeting targets (http://content.digital.nhs.uk/catalogue/PUB18468) or a popular data tool such as OpenPrescribing summarising practice-level prescribing data (https://ebmdatalab.net/). The typical approach for selecting these indicators is for experts to decide on these measures, sometimes without transparent evidence on their effectiveness or relative importance. Also, the monitoring of clinical performance through targets may not always be effective. Despite its major investment, QOF was only associated with a modest slowing of the increase in emergency admissions but without any effect on mortality.18 There may also be challenges with performance targets that do not take into account the variability in case mix or regional pressures.19 AB prescribing is not just related to the prescribing habits within a practice but also to drivers for prescribing that are not controlled by the practices such as local social deprivation.20 Tailored feedback to practices including peer-to-peer comparisons and outline of opportunities21 could encourage quality improvement. It has been reported that there is no evidence that any healthcare system has ever delivered sustained transformational change solely through compliance to indicators, rather than commitment of their staff.22
This study is part of a larger project in which advanced analytics is applied to anonymised data from general practices followed by tailored feedback of results to the practices.23 Part of this feedback could include peer comparisons providing displays on how other clinicians are conducting care. A recent commentary highlighted the important dimensions in designing effective peer comparisons. These include focus on high-value or low-value activities, type of comparative information and provision of individual feedback on an activity that is considered to be either good or bad practice.24 One particular challenge for most measures of AB prescribing, including those evaluated in this study, may be that they do not represent unequivocally good or bad practice. As an example, higher levels of AB prescribing may contribute to the development of AMR. A large longitudinal analysis of urine cultures found that resistance to an AB is strongly related to prior AB use.25 However, practices that prescribe more ABs may possibly have reduced levels of infection-related complications.26 27 Broad-spectrum AB prescribing is generally not advised for less serious infections but is needed for more serious infections.1 The findings in this study do suggest that the approach for optimising AB prescribing should not depend on simplistic ranking of clinicians and general targets based on a single AB measure such as prescribing rate. The finding of low correlation between different AB measures does indicate the need to tailor feedback to each clinician and the local context.
Several studies have reported on the substantial levels of variability in AB prescribing between general practices28–30 and the present study also found this between clinicians, including between those from the same practices. Multiple treatment guidelines have been developed to guide AB prescribing in UK primary care.31 32 However, the guidelines may not fully address the varied clinical challenges in primary care. Repeated AB prescribing occurs frequently in primary care. Patients often return and receive another AB for a particular infection episode,33 and over time they may receive multiple AB courses.13 Most treatment guidelines only deal with the first consultation of a particular common infection (with exception of UTI). AB prescribing for self-limiting infections such as URTI has also been found to be unrelated to a patient’s risk of infection-related hospital admissions, with patients at very low risk as likely to receive ABs as those at much higher risk.14 A recent qualitative study with guideline experts found that there is the potential for a wider range of evidence to be included as part of the guideline development process. Observational data should be included to enhance the guideline development process, as well as help to monitor guideline use in clinical practice and improve the implementation.34
In primary care, patients frequently consult for infections that typically are self-limiting. For example, many young and fit patients, but not all, with a bacterial infection will get better without ABs. While the average risk of complications with conditions such as URTI may be low,35 there is substantial variation in individual risks and patients at very low risk of complications are as likely to receive an AB as patients with higher risks.14 These risks could be estimated based on predictors such as age, gender, clinical and medication risk factors, ethnicity and socioeconomic status.14 This risk-based prescribing approach using risk scores would be similar to cardiovascular risk scores such as QRISK2.36 The risk scores for infection-related complications could then be combined with clinical symptom severity of the infection. Most treatment guidelines for common infections currently do not use a multifactorial risk assessment to decide on antibiotic treatment apart from the mention of considering limited pre-existing comorbidity.35
A key strength of the study was that the dataset was derived from a population of patients and practices that was broadly representative of the UK.11 However, the clinical details of the infection and especially severity were limited. Information on symptoms and symptom scores is often not completely recorded in the EHRs and laboratory samples for bacterial infections are not always requested in primary care. This could potentially explain part of the differences between clinicians in some of the AB measures. For example, the chance of getting an AB prescription for a common infection may depend on infection severity. However, it is unlikely that the considerable differences in AB prescribing will be fully explained by this unmeasured confounding. Several studies have found that there was still considerable variability in AB prescribing even after accounting for individual patient symptom severity.37 38 Another limitation was that there were no details on the characteristics of the clinicians such as experience and time since graduation. The data on patients’ history of AB prescribing may have been an underestimate given access to other healthcare such as walk-in clinics. The analysis of case mix may not have captured the full scale of the variability in roles of clinicians such as dealing with emergencies or covering nursing or residential care homes. A further limitation was that the NNT was based on an arbitrary estimate of AB effectiveness. A different estimate would have changed the NNT but not the ranking of clinicians for this measure. Also, this study did not explore the reasons behind the variability in AB prescribing between clinicians. An example of such a study is one that interviews clinicians from practices with different AB-prescribing levels.39
In conclusion, the findings of substantive variability in AB prescribing habits do suggest that the approach for optimising AB prescribing should not depend on simplistic ranking of clinicians and general targets based on a single AB measure such as prescribing rate. Rather, they may need to consider a wider range of objectives, and varying engagement strategies for all prescribers with feedback tailored to each clinician and local context, bespoke practical recommendations and proactive support from colleagues and local organisations. The effectiveness of this bespoke feedback will need to be tested in the field. Reducing AB prescribing based on risk-based prescribing and NNTs had a larger impact compared with the other AB measures.
Data availability statement
Data may be obtained from a third party and are not publicly available. Data used for this project cannot be shared, however it can be obtained by application to CPRD.
Ethics statements
Patient consent for publication
Ethics approval
The protocol was approved by the Independent Scientific Advisory Committee for CPRD research (protocol number 16_153).
Acknowledgments
We would like to acknowledge all the data providers and general practices that made the anonymised data available for research.
References
Supplementary materials
Supplementary Data
This web only file has been produced by the BMJ Publishing Group from an electronic file supplied by the author(s) and has not been edited for content.
Footnotes
Contributors TVS was involved in conception and planning of statistical analyses, acquisition of data, analyses of data and drafting of the manuscript. YL provided technique details, explanation, clarification, suggestions and sample programs for the main statistical analyses, and reviewed the statistical analyses for random effects and made substantial revisions to the manuscript. VP was involved in planning of statistical analyses and made substantial revisions to the manuscript. NG made substantial revisions to the manuscript. TC made substantial revisions to the manuscript. WW was involved in conception and made substantial revisions to the manuscript. DMA was involved in acquisition of data and made substantial revisions to the manuscript. JB was involved in conception and made substantial revisions to the manuscript. TVS is guarantor.
Funding This study was co-funded by Health Data Research UK, National Institute of Health Research and Public Health England. This study is based on data from the Clinical Practice Research Datalink obtained under licence from the UK Medicines and Healthcare products Regulatory Agency (MHRA).
Disclaimer The funders had no role in the design and conduct of the study; collection, management, analysis and interpretation of the data; or in the preparation, review or approval of the manuscript. The data are provided by patients and collected by the NHS as part of their care and support. The interpretation and conclusions contained in this study are those of the authors alone, and not necessarily those of the MHRA, NHSA, NHS or the Department of Health.
Competing interests None declared.
Provenance and peer review Not commissioned; externally peer reviewed.
Supplemental material This content has been supplied by the author(s). It has not been vetted by BMJ Publishing Group Limited (BMJ) and may not have been peer-reviewed. Any opinions or recommendations discussed are solely those of the author(s) and are not endorsed by BMJ. BMJ disclaims all liability and responsibility arising from any reliance placed on the content. Where the content includes any translated material, BMJ does not warrant the accuracy and reliability of the translations (including but not limited to local regulations, clinical guidelines, terminology, drug names and drug dosages), and is not responsible for any error and/or omissions arising from translation and adaptation or otherwise.