Article Text

Abstract
Background Overuse of diagnostic testing substantially contributes to healthcare expenses and potentially exposes patients to unnecessary harm. Our objective was to systematically identify and examine studies that assessed the prevalence of diagnostic testing overuse across healthcare settings to estimate the overall prevalence of low-value diagnostic overtesting.
Methods PubMed, Web of Science and Embase were searched from inception until 18 February 2020 to identify articles published in the English language that examined the prevalence of diagnostic testing overuse using database data. Each of the assessments was categorised as using a patient-indication lens, a patient-population lens or a service lens.
Results 118 assessments of diagnostic testing overuse, extracted from 35 studies, were included in this study. Most included assessments used a patient-indication lens (n=67, 57%), followed by the service lens (n=27, 23%) and patient-population lens (n=24, 20%). Prevalence estimates of diagnostic testing overuse ranged from 0.09% to 97.5% (median prevalence of assessments using a patient-indication lens: 11.0%, patient-population lens: 2.0% and service lens: 30.7%). The majority of assessments (n=85) reported overuse of diagnostic testing to be below 25%. Overuse of diagnostic imaging tests was most often assessed (n=96). Among the 33 assessments reporting high levels of overuse (≥25%), preoperative testing (n=7) and imaging for uncomplicated low back pain (n=6) were most frequently examined. For assessments of similar diagnostic tests, major variation in the prevalence of overuse was observed. Differences in the definitions of low-value tests used, their operationalisation and assessment methods likely contributed to this observed variation.
Conclusion Our findings suggest that substantial overuse of diagnostic testing is present with wide variation in overuse. Preoperative testing and imaging for non-specific low back pain are the most frequently identified low-value diagnostic tests. Uniform definitions and assessments are required in order to obtain a more comprehensive understanding of the magnitude of diagnostic testing overuse.
- healthcare quality improvement
- health services research
- patient-centred care
- quality improvement
Data availability statement
All data relevant to the study are included in the article or uploaded as supplementary information.
This is an open access article distributed in accordance with the Creative Commons Attribution Non Commercial (CC BY-NC 4.0) license, which permits others to distribute, remix, adapt, build upon this work non-commercially, and license their derivative works on different terms, provided the original work is properly cited, appropriate credit is given, any changes made indicated, and the use is non-commercial. See: http://creativecommons.org/licenses/by-nc/4.0/.
Statistics from Altmetric.com
Introduction
In modern medicine, diagnostic tests, including laboratory tests, imaging and more invasive procedures, figure prominently in clinical decision making surrounding a new diagnosis.1 2 However, the use of a diagnostic test is not always appropriate, as it may generate false positives, produce downstream cascades of more testing, expose patients to radiation or other harms, and create unnecessary patient anxiety, and could therefore be considered of low value.3–7 Recent studies show that low-value diagnostic tests are still widely used and account for a substantial portion of the total amount of low-value healthcare expenses.8–12 However, despite the potential avoidance of both costs and patient harms, the full quantification of low-value diagnostic testing has been difficult to achieve.
Understanding the prevalence of low-value diagnostic testing is essential to spur doctors, health systems and policymakers to take action to reduce its use. Most assessments of low-value diagnostic testing to date have been performed in the USA, Canada and Australia.5 13–17 Only a few assessments have been completed in Europe.18–21 Although multiple assessments of diagnostic testing overuse exist, only a small fragment of the problem has been uncovered.
One systematic review assessing the prevalence of diagnostic testing overuse and underuse in the primary care setting has previously been published by O’Sullivan et al.22 Previous assessments demonstrate that overtesting is not limited to the primary care setting.16 18 19 We therefore chose not to limit our study to one healthcare setting but rather to include all assessments of overtesting irrespective of the healthcare setting in which they were conducted. Furthermore, it is often hard to distinguish primary from secondary care practices due to differences in definitions of primary and secondary care procedures between countries and healthcare systems. In the present study, we therefore chose a more specific approach to the examination of the problem of low-value diagnostic testing compared with O’Sullivan. We narrowed down our scope to studies of similar study design that only quantified the overuse, and not underuse, of diagnostic testing (eg, overtesting) using database data and used guidelines to distinguish appropriate from inappropriate testing to obtain a more uniform overview of the problem. This review might help policymakers and healthcare providers in their efforts to reduce overuse of diagnostic testing and can also help identify new knowledge gaps.
Methods
This systematic review was performed and is reported according to the Preferred Reporting Items for Systematic Reviews and Meta-Analyses (PRISMA) guidelines23 (online supplemental file 1) and Meta-analyses of Observational Studies in Epidemiology statements,24 no protocol has been registered. PubMed, Web of Science, and Embase were searched on 18 February 2020, for studies, of any design, assessing overuse of diagnostic tests. We did not restrict our search with respect to publication start date. The search can be summarised as (Medical Overuse OR Low-value care OR wasteful care OR wasteful healthcare) AND (Diagnosis) AND (Variation OR Volume OR Prevalence OR Frequency) (see online supplemental file 2 for the full strategy). We limited our search to human studies and studies published in English. The reference list of each included study was also searched for potentially relevant studies.
Supplemental material
Supplemental material
Study selection
Full texts were independently screened for eligibility by two reviewers. We included studies that quantified the overuse of diagnostic tests using database data, described a prevalence assessment and mentioned the relevant guideline(s) used to distinguish appropriate from inappropriate diagnostic testing. For the purpose of this study, we defined low-value diagnostic testing (or overtesting) as the overuse of diagnostic practices which are unlikely to benefit the patient given the harms, cost, available alternatives or preferences of the patient.25 We excluded studies that did not quantify or assess provision of low-value diagnostic services; measured against a local guideline only (eg, did not use a guideline published by a government or professional society, but rather used a guideline that is only applicable locally); used survey data as the principal data source; were not published in English; used data derived from countries not in the Organisation for Economic Co-operation and Development (OECD); were intervention studies; or assessed (non-diagnostic) routine (population) screening tests as defined by Wald and Law26 We only included studies using data from countries that are part of the OECD because of the comparability of the social–economic characteristics of the populations. Disagreements regarding the eligibility of studies were discussed by three of the study authors until consensus was reached.
Data extraction
The following information was extracted from each article: author and year, country, study population demographics (age/sex), the guideline used to determine the (in)appropriateness, the low-value care definition used, data sources, collected parameters, healthcare setting in which the assessment was conducted (primary/secondary care/both/unclear), type of low-value diagnostic test examined and the study outcome (prevalence estimate(s)). Assessments of diagnostic imaging procedure(s) were assigned to one of six categories based on the imaging modality they examined: cardiac test, combination, endoscopy, scan, ultrasound and X-ray (see online supplemental file 3) for an overview of the different imaging modalities in each category). The combination category contains assessments of multiple imaging modalities, but which did not report the individual outcomes for each included modality. For example, some studies examined the use of X-ray, MRI and CT in the examination of low back pain but did not report the individual outcome measures for the different modalities, but solely reported the combined outcome. When studies contained assessments for more than one unique diagnostic test, data for each test were collected and presented as an individual assessment. In case assessments were carried out over multiple time periods, only the data from the most recent time period were extracted. Each of the extracted assessments was assigned an assessment lens based on the classification proposed by Chalmers et al in 2017.27 Chalmers et al concluded that different lenses are used to assess low-value care, each of which produces distinct outcomes. In general, Chalmers et al distinguishes two types of lenses that are used: service-centric and patient-centric lenses. Assessments using the service lens focus on the proportion of diagnostic tests that are of low value, while assessments using the patient lens focus on the proportion of the patient population that received the low-value diagnostic tests. Assessments using a patient centric lens can be further subdivided into assessments using either a patient-indication or patient-population lens. Which of the two patient centric lenses is applicable depends on the type of denominator that is used.27 Assessment using a patient-indication lens only include patients with a specific indication in their denominator, while assessments using a patient-population lens include the entire cohort in their denominator.
Supplemental material
The process of assigning lenses to the different assessments was performed in the following manner. One of the authors drafted an initial proposal regarding the applicable lens for each of the included assessments. This proposal was then critically appraised by two other authors, which was followed by multiple rounds of discussion until all authors agreed on the lens used.
Quality assessment
Risk of bias was assessed by three researchers using a modified version of the Hoy risk of bias tool. The Hoy risk of bias tool is a validated tool for the assessment of both internal and external validity of prevalence studies.28 The tool was modified in the following manner:
Three domains (points 4, 7 and 9) from the original tool were found to be not applicable with respect to the identified studies. These domains either required information which is not applicable to retrospective research involving (electronic) database data or examined study designs which were not included in our study. Domain 7 was considered to be not applicable, since we did not grade the underlying evidence of the guidelines used in each of the included assessments. These domains were therefore removed after internal discussion among three authors. Online supplemental file 4 contains the original and modified tool, including more detailed reasoning for removal of each of the three domains.
The wording was adjusted to reflect the prevalence of low-value diagnostic testing instead of the prevalence of disease. Studies were considered at high risk of bias when they scored at least two ‘high’ and one ‘unclear’ among the seven risk of bias criteria. The original Hoy risk of bias tool does not provide a definition of high risk of bias. We therefore decided to use the aforementioned cut-off value for high risk after internal discussion among the authors. The process of grading risk of bias was similar to the one we used to assign lenses to the different assessments. One author drafted an initial proposal regarding the risk of bias scores of the included studies, which was followed by critical appraisal by two other authors and followed by multiple rounds of discussion until consensus was reached regarding the risk of bias score for each of the studies.
Supplemental material
Statistical analysis
The primary outcome of this study is the prevalence of overuse of diagnostic tests across all healthcare settings. Descriptive statistics and median prevalences were calculated across all assessments for diagnostic imaging, laboratory testing and electroencephalogram categories and for the different assessment lenses within those categories. Analysis was performed using R V.3.6.3,29 and data visualisation was done using the R package ggplot2.30 Random-effect meta-analysis with 95% CIs (Clopper-Pearson), according to the DerSimonian and Laird method, was performed on similar assessments applying the same lens using the Meta31 and Metafor package.32 Variance was stabilised using the double arcsine transformation. The among-study heterogeneity was assessed using the I2 statistic. The I2 statistic represents the percentage of total variation across studies that is attributable to heterogeneity rather than change.33 34 When applicable, data from similar assessments were pooled based on the lens that was used to assess the prevalence.
Results
Article characteristics
Our search strategy identified 2542 articles. Of these, 2459 were excluded based on the title or abstract. Thirty-four studies met the eligibility criteria and were included. One additional eligible study was identified through screening of the reference lists of the included studies. A PRISMA flow diagram of the selection procedure is shown in figure 1. From the included studies, seven conducted their assessments in the primary care setting (7/35), five in the secondary setting (5/35) and nine in both settings (9/35). The remaining 14 studies (14/35) did not provide a clear indication as to the setting in which their assessments were conducted and therefore labelled as unclear (also see online supplemental file 6). The included studies were conducted in eight different countries and contained 118 assessments of low-value diagnostic tests. Most studies were conducted in the USA (n=23). The 118 identified assessments are divided into imaging procedures (n=96) and other diagnostic tests (n=22), which included laboratory tests (n=19), and electroencephalography procedures (n=3) (as shown in table 1). The majority of the assessments used a patient-indication lens (n=67, 57%), followed by the service lens (n=27, 23%) and patient-population lens (n=24, 20%). Among the studies included, three studies assessed overuse among different insurance populations,35–37 and one study assessed overuse across two different time periods.38 Of note, since we were interested in the most recent measurements of low-value diagnostic overtesting, we decided to only include the most recent measurements from the study by Flaherty et al. 38
Supplemental material

PRISMA Flow-diagram. OECD, Organisation for Economic Co-operation and Development ; PRISMA, Preferred Reporting Items for Systematic Reviews and Meta-Analyses.
Overview of study characteristics
Risk of bias
Using the Hoy risk of bias tool, we assessed the risk of bias of the included studies based on eight criteria (online supplemental file 4 contains the used modified Hoy risk of bias tool). Assessment of risk of bias revealed 25 studies as low risk of bias and 10 studies as high risk of bias (eg, scoring at least two categories high and one unclear). Almost all studies graded as high risk of bias, scored as being of high risk on the following two criteria: ‘the examined population being a close representation of the national population’ and ‘the use of a clear case definition of the low-value diagnostic test examined’ (online supplemental file 5 contains a detailed description of the risk of bias assessment outcome.
Supplemental material
Overuse of diagnostic tests
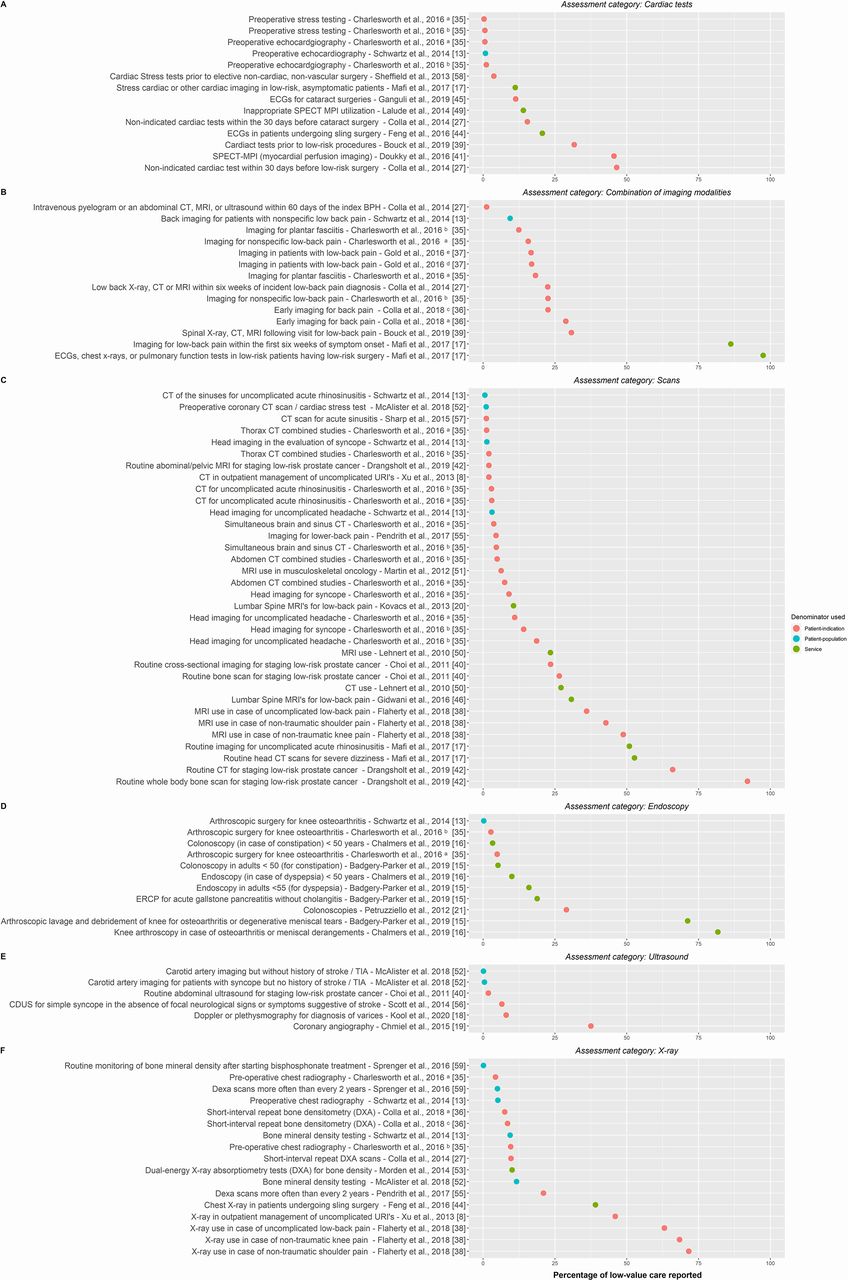
Online supplemental file 6 provides an overview of the studies, characteristics and outcomes. Prevalence estimates of diagnostic testing overuse ranged from 0.09% to 97.5% (median prevalence of assessments using a patient-indication lens: 11.0%, a patient-population lens: 2.0% and a service lens: 30.7%). The majority of included assessments of low-value diagnostic testing (n=85) report overuse to be below 25%. Among the 33 assessments reporting high levels of overuse (≥25%), imaging for uncomplicated low back pain (n=6) and preoperative testing (n=7), such as preoperative baseline lab tests, echocardiography or (cardiac) stress tests,were most commonly assessed. Overuse of diagnostic imaging procedures was most often assessed (n=96), with prevalence of overuse varying between 0.09% and 97.5% (median prevalence of assessments using a patient-indication lens: 11.2%, a patient-population lens: 1.2% and a service lens: 22.0%), as shown in figure 2. Prevalence assessments in the ‘other diagnostic tests’ category (n=22) varied between 0.10% and 78.6%, as shown in figure 3A,B. This category contained two distinct categories: laboratory tests (n=19, median prevalence of assessments using a patient-indication lens: 16.3%, a patient-population lens: 3.5 % and a service lens: 47.5%: 14.0%) and electroencephalography (n=3, median prevalence of assessments using a patient-indication lens: 0.2% and a patient-population lens: 0.1%).

Assessment outcomes regarding the prevalence of low-value diagnostic tests for all assessments included in the diagnostic imaging category: (A) cardiac tests, (B) combination, (C) scans, (D) endoscopy, (E) ultrasound and (F) X-ray. Among the included studies, some studies contained multiple assessments undertaken in different cohorts. These assessments are distinguished by the following: (A) assessment performed among a commercially insured population, (B) assessment performed among Medicaid beneficiaries, (C) assessment performed among Medicare beneficiaries, (D) assessment performed using Kaiser Permanente EPIC Electronic Healthcare Records data, (E) assessment performed using data derived from the Oregon Community Health Information Network. BPH, benign prostatic hyperplasia; CDUS, colour duplex ultrasound scan; CKD, chronic kidney disease; ERCP, endoscopic retrograde cholangiography; PSA, prostate-specific antigen; SPECT MPI, single-photon emission CT–myocardial perfusion imaging; TIA, transient Ischaemic attack; URI, upper respiratory infection.

Assessment outcomes regarding the prevalence of low-value diagnostic tests for all assessments included in the other diagnostic tests category: A) laboratory tests and (B) electroencephalography tests. Among the included studies, some studies contained multiple assessments undertaken in different cohorts. These assessments are distinguished by the following: (A) assessment performed among a commercially insured population and (B) assessment performed among Medicaid beneficiaries. CKD, chronic kidney disease; EEG, electroencephalography; PSA, prostate-specific antigen; PTH, parathyroid hormone; T-Hyst, total hysterectomy; TSHR, thyroid-stimulating hormone reflexive testing; V-Pap, vaginal Pap smear.
The highest prevalence of overuse was reported in the following five diagnostic practices: use of electrocardiograms, chest X-rays or pulmonary function tests in low-risk patients having low-risk surgery (97.5%); imaging for low back pain within the first 6 weeks of symptom onset in the absence of red flags (86.2%); knee arthroscopy for meniscal derangements (81.7%); baseline lab tests for low-risk patients receiving low risk surgery (78.6%); and knee arthroscopy for osteoarthritis (71.7%). Overall, imaging in case of non-specific low back pain (15/118) and preoperative tests (14/118), such as preoperative baseline lab tests, echocardiography or exercise stress tests, were most often assessed diagnostic practices identified in this study. Figures 2 and 3 show that a large variation in assessment outcomes of similar diagnostic tests, irrespective of assessment lens used, exists. For example, Bouck et al,39 Schwartz et al 13 and Mafi et al 17 yielded vastly different results in their respective studies. Bouck et al 39 used a patient-indication lens and reported 30.70% of the identified imaging procedures to be considered as overuse, while Schwartz et al 13 used a patient-population lens and found 4.1% to be considered as overuse. On the other hand, Mafi et al used a service lens in their assessment and reported the level of overuse to be 86.2%.
Variation among assessments of similar procedures
For the two types of diagnostic tests, multiple assessments using similar lenses were identified among the included studies. These included short-interval repeat bone densitometry testing (dual-energy X-ray absorptiometry) and the use of imaging procedures for non-specific low back pain. Considerable heterogeneity was observed between the extracted assessments for both groups (I2≥100%) (see online supplemental file 7 for the generated forest plot). We therefore chose to forgo generating pooled estimates since pooling heterogenous studies could lead to invalid results. In particular, assessments of overuse of imaging for non-specific low back pain showed substantial variation, irrespective of the assessment lens used.
Supplemental material
Discussion
In this systematic review, we identified and summarised the outcomes of studies assessing the prevalence of overuse of diagnostic tests. The majority of the 118 identified assessments examined the overuse of diagnostic imaging procedures (n=96), followed by the category other diagnostic tests, which included laboratory tests (n=19) and electroencephalography tests (n=3). Assessments of low-value diagnostic testing using a patient-indication lens were most common (n=67, 57%), followed by assessments that used a service lens (n=27, 23%) and the patient-population lens (n=24, 20%). Major variation between prevalence estimates was observed, irrespective of the assessment lens used. Prevalence estimates of diagnostic testing overuse ranged from 0.09% to 97.5% (median prevalence of assessments using a patient-indication lens: 11.0%, a patient-population lens: 2.0% and a service lens: 30.7%), although 85 of the included assessments reported the prevalence of overuse to be below 25%. Among the 33 assessments reporting high levels of overuse (ie, ≥25%), multiple assessments exploring the overuse of imaging for uncomplicated low back pain (five assessments) or preoperative tests (seven assessments) were present. Additionally, 11 of the 33 measurements reporting high levels of overuse were extracted from eight studies considered at high risk of bias. Similar to the review of O’Sullivan et al,22 we found substantial variation in overuse among diagnostic services. However, our study adds to this finding by illustrating that variation is not limited to the primary care setting. Substantial overuse of diagnostic testing was also observed among diagnostic services often used in the secondary care setting, such as short interval of bone mineral density testing or non-indicated cardiac testing before low-risk surgery. Through implementation of the concept of the assessment lenses to the included assessments, as proposed by Chalmers et al,27 we were able to better compare the different assessment outcomes for similar diagnostic tests. Comparison of the different assessment outcomes regarding similar tests revealed that the observed variation could in part be explained by the use of different assessment lenses, an aspect which O’Sullivan et al did not account for in their study.22 Furthermore, we found that distinguishing primary from secondary care practices is often difficult and not always straightforward. Reasons are that many diagnostic practices are often provided in both the primary and secondary settings, and the setting in which these practices are provided often differs between countries and their respective healthcare systems.
For the two types of low-value diagnostic testing, that is, short-interval repeat bone densitometry testing and imaging for non-specific low back pain without the presence of red flags, several similar assessments were extracted from the included literature. We tried to pool those similar assessments but refrained from doing so after observing significant among-study heterogeneity (I2≥100%). We therefore chose to report the results of the individual studies instead. The high levels of heterogeneity observed warrant further examination through means of subgroup analysis. However, the examination of potential sources of heterogeneity was hampered by the limited number of assessments present in each group. The limited number of assessments in each group also prevented us from reliably testing for publication bias.40 Although we could not examine the heterogeneity through means of statistical subgroup analysis, we have tried to find possible explanations for the observed heterogeneity in the available literature and comparison of the studies. As mentioned before, substantial variation among the extracted assessments of overuse was observed among the assessments included in our study. This variation could be caused by differences in study design, cohort size or operationalisation of guidelines. Additionally, previous research has shown that factors such as population characteristics, healthcare systems and insurance systems can greatly affect the amount of overuse.7 13 15 16 18 25 35 36 39 For example, the studies by both Bouck et al 39 and Pendrith et al 41 examined the overuse of imaging for low back pain in Canada. However, each study used different data sources (Patient-Level Physician Billing Repository, Discharge Abstract Database, National Ambulatory Care Reporting System versus Ontario Health Insurance Plan claims database, respectively) and therefore used different codes to identify the included cohort. Furthermore, Pendrith et al 41 included all visits to the primary care physician of adult patients (age>18 years) in their examination, while Bouck et al 39 included only the first family physician visit. Although such differences appear small, they can drastically alter the patients included in the cohort and therefore influence the final prevalence estimate. The observed differences in estimates could also be caused by differences in definitions of low-value diagnostic testing. Most assessments are based on recommendations derived from initiatives such as the National Institute for Health and Care Excellence (England) or Choosing Wisely. However, no standardised definitions of low-value procedures or assessments, for the specific countries, exist. The absence of standardised definitions for specific countries could result in different cohorts and thus different prevalence estimates.
Finally, the use of different methods to assess overuse can explain the observed differences in outcomes. Some articles used the method as proposed by Schwartz et al,13 which proposes the use of narrow (high specificity and low sensitivity) and broad indicators (low specificity and high sensitivity) to assess low-value care.13 Narrow definitions are more tightly formulated, resulting in a more distinct cohort of patients/services that is included as compared with the cohorts created using broad definitions. Through a combination of both assessments, a more complete understanding of the problem is obtained. However, while using both narrow and broad indicators appears to be a good way to provide an estimate of the amount of overuse of low-value practices, it was only employed in three of the included articles.13 15 16 In our analysis, we only used the broad assessments from those studies since the underlying definitions of those more closely resembled the original recommendations. Therefore, broad assessment outcomes are more suitable for comparison to the outcomes of studies that directly used the relevant original recommendations in their assessments.
Strengths and limitations
A strength of this study is that we did not limit our review to a single type of diagnostic testing or disease. Additionally, we did not limit the search to a particular setting; as a result, we present prevalence estimates for a wide range of diagnostic tests across all healthcare settings. Furthermore, we included only direct measures of diagnostic testing overuse acquired from data collected from databases.
Our study also faces some limitations. First, we recognise that the measurement of low-value care is often biased. Most existing measurements of low-value care target practices that are easily measured using existing data. These measurements clearly distinguish high-value from low-value services. However, most guidelines do not provide such a clear distinction. Detailed clinical information is often required to accurately distinguish high-value from low-value care but is often not present in the available data.13 36 42–45 Because of these reasons, only a relatively small part of the total amount of low-value services has been examined so far. Unfortunately, we were unable to reliably test for publication bias due to the limited number of similar assessments which used the same scope present in our study.40 Publication bias might be present among assessments of low-value practices because reports of the presence of substantial overuse are undesirable for most parties involved in such assessments. However, while our overview contains such a wide range of assessment outcomes, we have attempted to reduce the publication bias where possible. Second, although we attempted to include all relevant keywords in our search strategy, our strategy may have missed some relevant terms and thus overlooked some studies assessing overuse of diagnostic services. Additionally, we incorporated several terms, such as overuse and low-value care in our search, which have been added to the lexicon relatively recently. Also, our search strategy identifies only studies that explicitly acknowledge the examined tests as representing overuse or low-value care. It is therefore possible our search might have missed studies which did not use these terms yet or that included some appropriate services alongside inappropriate ones in their assessment. Third, we included only studies that assessed overuse in relation to a specific guideline. Although this is a commonly used criterion and seen as an objective method to assess overuse, it is prone to underestimation of the actual prevalence of the problem. Yet, there is a risk of missing patients who do not exactly fit the specific guideline(s) used or falsely classifying a test as (in)appropriate due to the clinical complexity of the patient involved. Furthermore, by requiring an assessment to be performed against a guideline, we did not capture all assessments of low-value diagnostic practices. Different methods are also used to distinguish appropriate from inappropriate care, such as expert opinion, Delphi or RAND appropriateness methods.46 Because we included only the assessment to require a guideline, our study therefore does not capture the full scope of assessments of low-value diagnostic overtesting. Fourth, we used a modified version of the Hoy risk of bias tool.28 This is a validated tool for the assessment of risk of bias in prevalence studies, although we had to slightly adjust it to make it suitable to our research. However, while we tried to keep the tool as original as possible, we do need to consider that the modifications made to the original tool might have affected the outcome of our risk of bias assessment. Lastly, each of the included studies used their own definition of overuse in their assessments. Due to these differences in definitions of overuse, it is often difficult to directly compare assessments of similar procedures since these differences are in part responsible for the differences in outcome. However, by assigning assessment lenses to the included assessment of similar practices, we were able to group assessments using similar definitions of overuse and compare those to one another.
Implications for practice and future research
Most studies included in our review were conducted in the USA, and only a few studies examining diagnostic testing overuse have been conducted in Europe. Findings from one country (such as the USA) are often not generalisable to other countries due to differences in (patient) population characteristics, healthcare and insurance systems. Additional assessments of overuse from different countries are needed to gain further insight into the magnitude of the overuse problem. Insight into the prevalence of diagnostic testing overuse is required to create a sense of urgency among (local) physicians and policymakers and to help develop effective strategies to tackle low-value diagnostic overtesting.47 48 Assessments should be repeated to monitor the problem of overuse of diagnostic testing over time and the effects of implemented strategies and interventions. In our review, only one study assessed overuse across multiple time periods.38 The overview of assessment outcomes generated in this review could be used by both policymakers and care providers as a source of inspiration for (future) assessments in their own organisation(s) and (subsequently) as comparison material for their assessment outcomes.
International agreement on low-value service definitions and standardisation assessment methods (eg, identical denominators, similar lenses and scopes) could contribute to prevalence estimates that are comparable across countries. An example would be the recently completed study which compared the overuse of laboratory testing in USA to that in Canada.49 However, while it would certainly help to have unified definitions and methods for the assessment of low-value care, it would certainly be an ambitious goal to set. Hence, each of the different assessments included in this study were conducted in different contexts and with slightly different purposes in mind. However, what they all do have in common is that they were performed to gain insight into the (local) problem of low-value diagnostic practices. These assessments therefore are crucial first steps in the process of reducing low-value diagnostic practices (locally).
Lastly, it might be of interest to include cost estimates in future assessments because it is known that cost differences exist across countries and healthcare systems. Another reason why costs estimates would be of interest would be that previous research has indicated that low-cost services are predominantly overused.17 We therefore suggest that future studies should include the associated costs of low-value diagnostic tests (possibly including additional downstream costs due to performance of low-value diagnostic tests) in their assessments. However, we would like to emphasise that while cost is an important argument in the discussion of addressing low-value testing, it is not the only and certainly not the most important potential harm of unnecessary testing.
Conclusion
This study shows that there is substantial overuse of diagnostic testing present across all healthcare settings, with much variation among similar diagnostic services. Preoperative testing and imaging for non-specific low back pain are the most frequently assessed and overused low-value diagnostic tests. Effective strategies to tackle the overuse of diagnostic testing must be developed and implemented by health systems, providers, policymakers and others. Additionally, more uniform definitions and assessments of low-value diagnostic tests are required in order to obtain a better understanding of the magnitude of diagnostic testing overuse.
Data availability statement
All data relevant to the study are included in the article or uploaded as supplementary information.
Ethics statements
Patient consent for publication
Acknowledgments
The authors would like to thank Eve A. Kerr, M.D., M.P.H. from the University of Michigan and Mandi L. Klamerus, M.P.H. from CCMR Center for Clinical Management Research, department of Veteran Affairs, for their critical review and contributions to the paper.
References
Supplementary materials
Supplementary Data
This web only file has been produced by the BMJ Publishing Group from an electronic file supplied by the author(s) and has not been edited for content.
Footnotes
Twitter @tijnkool
Contributors JM, RBK, SAvD and GPW all contributed to the design of the study and its development. JM, RBK and SAvD screened the articles and aided in the data extraction. JM took the lead in the principal analysis of the data and writing of the manuscript. RBK, SAvD and GPW contributed to the interpretation and presentation of the results. All authors provided critical feedback and helped shape the research, analysis and manuscript.
Funding This work was funded by ZonMW, the Dutch Organization for Health Research and Development (grant number 80-83920-98-803). ZonMW did not contribute to the design of the study, collection, analysis and interpretation of data and in writing the manuscript.
Competing interests None declared.
Provenance and peer review Not commissioned; externally peer reviewed.
Supplemental material This content has been supplied by the author(s). It has not been vetted by BMJ Publishing Group Limited (BMJ) and may not have been peer-reviewed. Any opinions or recommendations discussed are solely those of the author(s) and are not endorsed by BMJ. BMJ disclaims all liability and responsibility arising from any reliance placed on the content. Where the content includes any translated material, BMJ does not warrant the accuracy and reliability of the translations (including but not limited to local regulations, clinical guidelines, terminology, drug names and drug dosages), and is not responsible for any error and/or omissions arising from translation and adaptation or otherwise.