Article Text

Abstract
Background Part of delivering quality care means providing it in a timely, efficient manner. Improving the efficiency of care requires measurement. The selection of appropriate indicators that are valid and responsive is crucial to focus improvement initiatives. Indicators of operational efficiency should be conceptually simple, generated in real time, calculated using readily available hospital administrative data, sufficiently granular to reveal detail needed to focus improvement, and correlate with other valid indicators of operational efficiency.
Discussion In this paper, the authors propose daily discharge rate as a novel real-time metric of hospital operational discharge efficiency and compare it with average length of stay. The authors also suggest the use of control charts as an effective way to present daily discharge rate data to clinicians and managers in real time to prompt actionable improvements in discharge efficiency.
Conclusion The authors conclude that daily discharge rate has the potential to drive timely improvements in the discharge process and warrants consideration and further study by others interested in improving hospital operational efficiency and the delivery of quality care.
- Efficiency
- metric
- discharge
- control chart
- real-time
- collaborative, communication
- continuous quality improvement
- healthcare quality improvement
Statistics from Altmetric.com
- Efficiency
- metric
- discharge
- control chart
- real-time
- collaborative, communication
- continuous quality improvement
- healthcare quality improvement
Introduction
Part of delivering quality care means providing it in a timely and efficient manner.1 For hospitals, achieving efficiency includes reducing and avoiding costs, reducing inappropriate care and unnecessary variation in processes, and removing waste found within the system.2–4 Improving hospital operational efficiency requires measurement and the selection of appropriate indicators that are valid and responsive to focus improvement initiatives. Indicators of operational efficiency should be conceptually simple, generated in real time, calculated using readily available hospital administrative data, sufficiently granular to reveal detail needed to focus improvement and correlate with other valid indicators of operational efficiency.5 ,6
Hospital efficiency is often measured by risk-adjusted length of stay and cost per risk-adjusted discharge,7 ,8 two data-intensive calculations that lack granularity and limit the ability to drive clinically efficient performance. There is a need for meaningful real-time frontline measures that can report and evaluate performance.
This paper describes the evaluation of such a measure—daily discharge rate (DDR)—applied to the General Internal Medicine (GIM) service of the Toronto General Hospital for two consecutive years.
Rationale for monitoring daily discharge rate
Discharge represents an important efficiency bottleneck
Discharge of inpatients has emerged as a key efficiency bottleneck within hospital operations.9 ,10 As the last process in the inpatient care pathway, delays and variation in discharge are known to have significant repercussions to upstream processes such as emergency department patient flow and elective surgery scheduling/cancellations.11 One study found that delays in discharge accounted for nearly 2% of all inpatient days, so the costs incurred by delayed discharges are potentially significant.12 Therefore, developing tools to measure and monitor discharge efficiency is imperative.
Average length of stay inadequately measures discharge efficiency
Quantifying delays in discharge is one way to evaluate the efficiency of the discharge process. Delays are commonly quantified by measuring ‘unnecessary’ length of stay—number of days where a patient's clinical status was compatible with discharge but discharge did not occur.13 Additionally, discharge improvement initiatives are often evaluated by comparing pre- and postintervention average length of stay (ALOS).14 However, there are significant limitations to reporting ALOS as an indicator of discharge efficiency.
First, ALOS measures the average period of time from hospital admission to discharge. It includes patient and social environment characteristics and hospital characteristics that may change over the course of the hospital stay. As a result, cause-and-effect relationships are more difficult to establish, verify and be held accountable for.
Second, ALOS measures past historical performance with an often substantial lag in reporting, making information less actionable. A more useful metric is expected length of stay (ELOS)—the LOS expected of a typical patient that accounts for various clinical characteristics.15 However, like ALOS, ELOS has operational factors embedded within its value which are not easily extracted from the calculation. Also, the work effort and patient volumes required to calculate hospital-specific ELOS are considerable.
It is well documented that day-of-the-week discharge trends exist and contribute to inefficient hospital discharge.16 ,17 For example, reduced hospital staffing during weekends and limited weekend community capacity to accept referrals are cited as significant reasons as to why Saturday and Sunday are the least common days for discharge.18 ,19 Unfortunately, analysing ALOS by day of discharge cannot readily detect these day-of-the-week trends, since ALOS measures duration rather than counts.
In summary, length of stay, whether average or expected, provides hospitals with an aggregate measure of overall performance and is not intended for identifying and measuring discharge inefficiencies. New leading indicators that provide operational feedback on hospital efficiency are required.
Daily discharge rate: a new indicator to screen and monitor discharge efficiency
We wanted a measure that directs attention towards inefficient discharge processes. Daily discharge rate (DDR), as defined in box 1, is simply the ratio of discharges to census, multiplied by 100. We designed DDR to specifically overcome the limitations posed by ALOS as a measure of discharge efficiency.
What is daily discharge rate?
*To retain a focus on operational factors that can act as bottlenecks in discharge, no of discharges over a 24 h period excludes discharges that are either a result of death or left against medical advice. These patients are however maintained in the total census at the start of the 24 h period. †The time period of 08:00 today to 08:00 tomorrow is chosen because it better reflects the period when decisions are made, and work is completed. Daily discharge rate is measured in units of percentage of 8:00 census discharged per day.
DDR measures shorter periods of time (time span of 1 day) and therefore is more sensitive to operational factors. By definition, it addresses day-of-the-week trends explicitly. Figure 1 presents a box plot of ALOS and DDR values for the 7 days of the week. Subset analyses (Wilcoxon Rank Sum Test) were performed between individual days of the week. Days with the same letter superscript are not significantly different, while days with different letter superscripts are significantly different. For instance, ALOS on Monday, Tuesday, Wednesday and Friday (subscript b) were not significantly different from each other. Similarly, there were no significant differences among Tuesday, Wednesday and Thursday ALOS (subscript c). However, both Saturday and Sunday ALOS showed a significant difference for each pairwise comparison (p<0.05) (Figure 1A); for DDR, in addition to Saturday and Sunday, Friday showed a significant difference for each pairwise comparison (p<0.05) (Figure 1B).
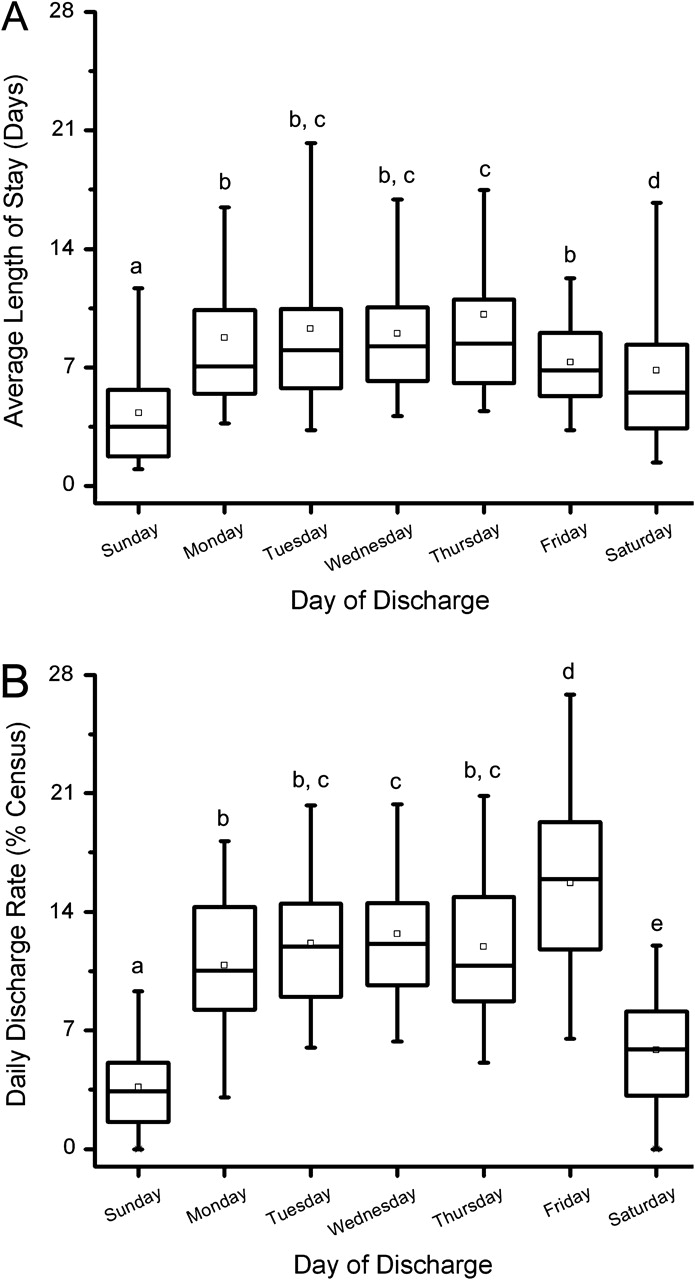
Box plot showing median levels of (A) average length of stay (ALOS) (B) daily discharge rate (DDR), by day of discharge (excluding left against medical advice and deaths) for the General Internal Medicine service, Toronto General Hospital from 15 January 2005 to 15 December for the 2 years 2005 and 2006. Boxes show interquartile ranges, represent mean value, and I bars represent the highest and lowest values not considered as outliers. Differences across the 7 days of the week for ALOS and DDR were assessed by the non-parametric Kruskal–Wallis test followed by the Wilcoxon Rank Sum test for pairwise group comparisons. Medians with different letter superscripts (separated with commas) are significantly different (p<0.05). Statistical analysis was performed using SPSS V.15.0 (SPSS, Chicago, Illinois).
Capable as a sensitive screening tool
We have shown that DDR is sensitive to variations caused by the day of the week. It is also sensitive to other factors, including staff scheduling. Smooth and timely discharge requires the coordinated action of the entire clinical team, where any member can influence discharge. We have found a statistically significant decrease of nearly 50% in team DDR on Fridays where the team social worker is on vacation (9.4% with 95% CI 5.3 to 13.6) to regular Fridays (18.4% with 95% CI 15.9 to 20.9) (p=0.02) (Galati M and Wu RC, unpublished data).
In the instance above, DDR had a direct and positive consequence on social work staffing within the GIM service. Specifically, in lieu of anticipated staff cutbacks, measuring and presenting DDR data to management led to our GIM service retaining a social worker full-time equivalent per GIM team. In addition to retaining the necessary complement of social workers on weekdays, the GIM service is now staffed with a social worker on weekends to ensure continuity of care and help decrease variations in discharge caused by day of the week.
Multiple disciplines including Nursing, Physiotherapy, Occupational Therapy, Respiratory Therapy, Pharmacy and other care providers can affect a patient's status and care plan, and therefore can have potential to impact the discharge process. Each of these disciplines is an appropriate candidate for DDR analysis in relation to staffing levels, workload and bottlenecks in work tasks.
Capable as an ongoing monitoring tool
DDR must be presented in a real-time pragmatic manner in order to be an effective indicator capable of influencing clinician behaviour. Control charts are a form of graphical analysis designed to identify special-cause variation or out-of-control observations to prompt investigation or action.20 Control charts include a plot of data over time with the calculated mean as the central horizontal line. Control and warning limits are typically set to ±3 and ±2SD from the mean, respectively.21 When data points appear, without any unusual patterns within the control limits, the process is said to be exhibiting a common-cause variation and is considered to be in statistical control.22 There are several potential signals to identify special-cause variation within data points on a control chart.21
Figure 2 shows control charts for ALOS and DDR on the GIM service over 48 consecutive Mondays. Each data point in the ALOS and DDR control charts represents the ALOS of patients and the percentage of 08:00 census discharged (excluding deaths and left against medical advice) on that particular Monday for the GIM service, respectively.
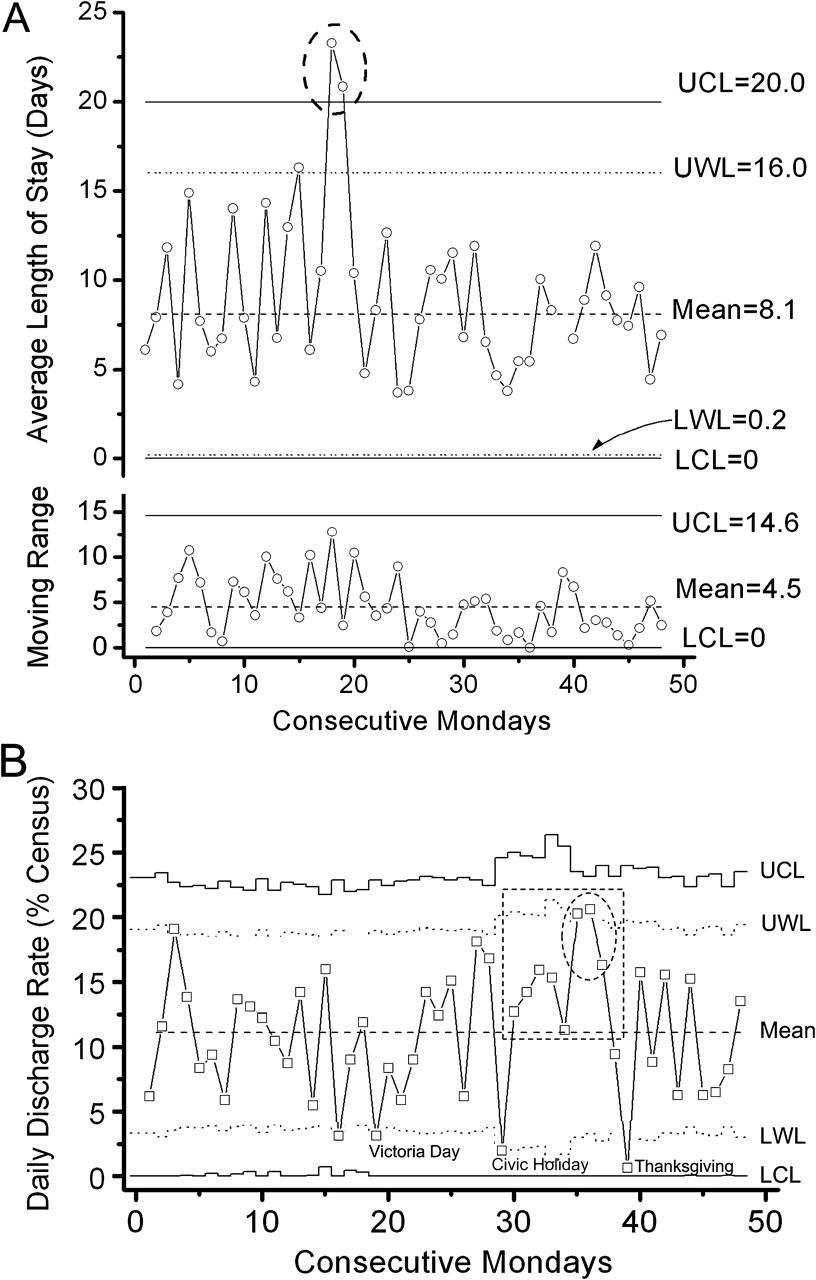
Control charts for (A) average LOS (xmr-chart for continuous data) and (B) daily discharge rate (p-chart for percentage data with varying denominator), on consecutive Mondays from 15 January 2005 to 15 December 2005 for the General Internal Medicine service, Toronto General Hospital. Upper and lower warning limits (UWL, LWL) are set at 62SD from the mean; upper and lower control limits (UCL, LCL) are set at 63SD. In the case where the LCL is below 0, limits are reset to 0.
For the ALOS control chart (Figure 2A), nearly all data points lie within the warning limits. There are, however, two points of special-cause variation (16 May 16 and 23 May). In both cases, further investigation revealed that the cause was associated with specific patients who had extremely long lengths of stay. For this reason, the ALOS was disproportionately high and caused the statistical outliers. Since ALOS is highly sensitive to cases with extremely large and small values, the averaged value may be misleading.23 Plotting median LOS may be an alternative approach.
For DDR, the warning and control limits are stepped because they reflect the changes in the census between consecutive Mondays. DDR appears to be a more sensitive metric for detecting an ‘out of control’ process (Figure 2B). DDRs were higher than expected in consecutive Mondays between 8 August and 26 September (dotted box identifying eight consecutive points above the mean and dotted circle identifying two of three consecutive points between a warning limit and a control limit). Also, three of the four points that lie below the lower warning limit correspond to statutory holidays (Victoria Day, Civic Holiday and Thanksgiving). As ‘out of control’ DDR observations are identified, this may trigger Pareto analyses or fishbone diagrams to look closely at the constraints of those particular days and identify the most frequent reasons for delayed discharges. For example, ‘non-medical’ factors, including temporary reductions in diagnostic and interventional capacity or patients occupying beds waiting for a more appropriate community care setting to become available, may be found to be significant discharge bottlenecks.
Valid relationship with average length of stay
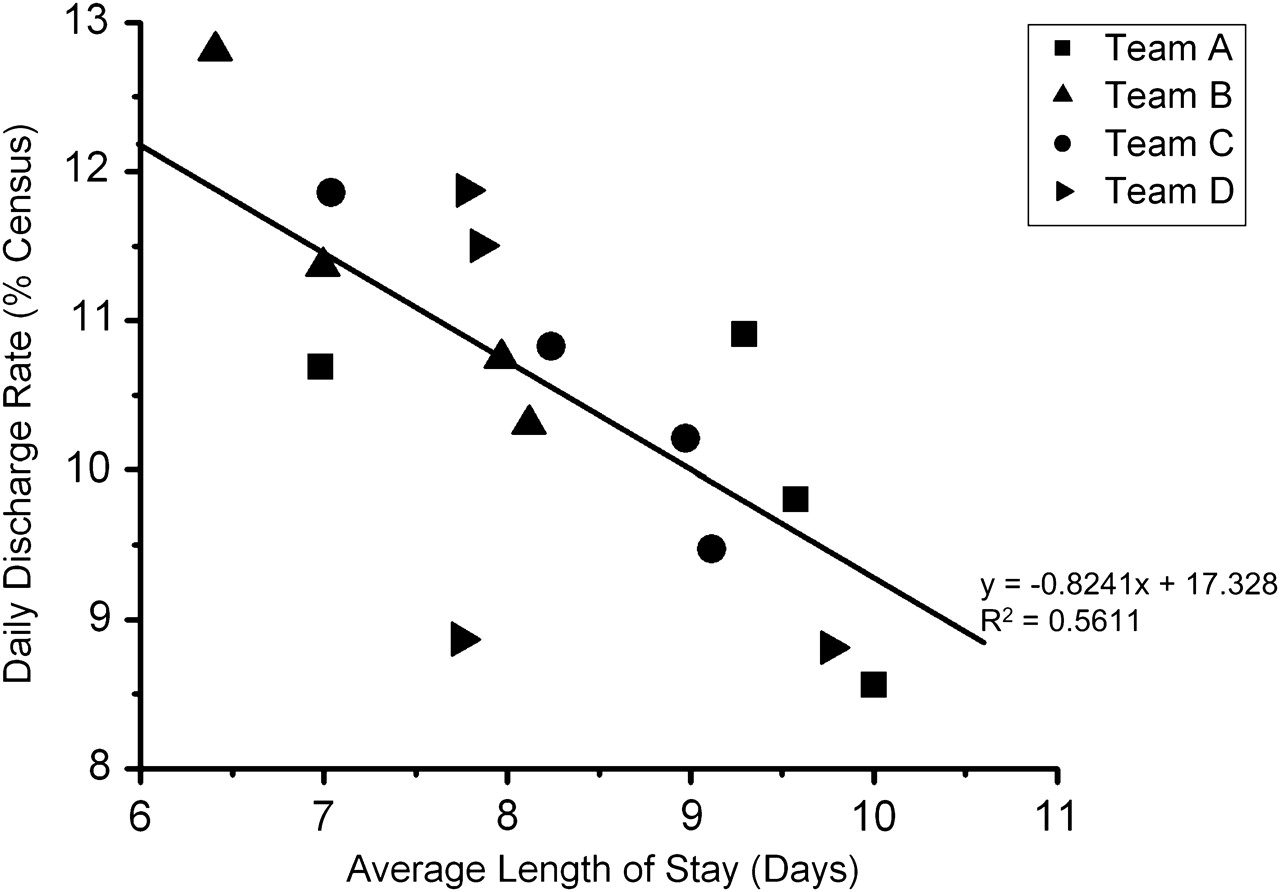
In order for DDR to be considered an indicator of efficiency, it should demonstrate a valid and reliable relationship with other efficiency indicators, such as ALOS. Figure 3 illustrates the correlation between DDR and ALOS for the four clinical teams that provided patient care on the GIM service during the study period. Each coordinate represents the team ALOS and DDR for a 6-month period. In general as expected, as ALOS increased, DDR decreased. Also, over the 2-year period, Team B had the shortest ALOS and correspondingly highest DDR of all the teams while Team A had the longest ALOS and lowest DDR.
Daily discharge rate versus average length of stay. Each point represents a 6-month team-specific average for clinical teams of the General Internal Medicine service, Toronto General Hospital, from 15 January to 15 December for the 2 years 2005 and 2006.
To illustrate the practical implications of DDR, we provide four examples that describe how DDR may be used in day-to-day operations (box 2). While the examples provided are hypothetical, they address a key concern of many hospital CEOs today and demonstrate desirable attributes of an indicator for management of operations: actionable, real-time, accountable and sensitive.
Day-to-day applications of daily discharge rate
Problem
The hospital CEO has asked that all wards aim for a 15% reduction in length of stay. The current average length of stay is 8.1 days, and a 15% reduction equals a target length of stay of 6.9 days. Since length of stay is a lagging indicator that can only be calculated after discharge, achieving this goal requires determining the expected length of stay (expected length of stay takes into account the reason for hospitalisation, age, comorbidity and complications) of each patient and then reducing it by 15%. Unfortunately, the work effort involved in determining individual expected lengths of stay is not reasonable for day-to-day operations. Without access to accurate and real-time information, the likelihood that the CEO and clinical teams will achieve their target length of stay is low.
Example 1: DDR is an actionable indicator
Solution
The linear regression analysis in Figure 3 states that each additional patient day is associated with a 0.8241 decrease in daily discharge rate. Decreasing the length of stay from 8.1 days to 6.9 days requires an increase in daily discharge rate from 9.9% to 11.0%. For an 8:00 ward census of 100 patients, this translates to a working target of discharging 11.0 patients each day. With this calculated value, teams have a goal to work towards and a value against which to compare their outcomes.
Example 2: DDR is generated in real time, facilitating daily decision-making
Solution
While it may not be medically feasible to discharge 11.0 patients every day to achieve the 15% reduction in length of stay as desired by the hospital CEO, daily the discharge rate presented in a control chart provides additional useful real-time operational information. Daily discharge rate can be measured every day for every team on every ward with minimal effort. Teams have a record of their performance, whether in the past 48 h, week or month. This real-time feature allows for rapid course correction. For example, prior to morning rounds, the Unit Manager determines from the control chart that the range of discharges required to maintain within the warning limits based on that morning's 08:00 census of 100 patients is between 4.9 and 17.5 patients. Armed with this useful information, discharge discussions during daily rounds have greater potential to translate from discussion to corrective action. As a result, there is far greater potential to achieving the target length of stay.
Example 3: DDR drives better accountability within clinical teams
Solution
Achieving gains in efficiency is highly dependent on clinical team engagement. Within the hospital, Dr X's clinical team is the most efficient. Suppose, on the first day of Dr X's rotation, he discharges Mr F, who has been in hospital for 100 days as a very complex case. Although Dr X has taken care of Mr F for only 1 day, Mr F's length of stay is assigned entirely to Dr X (attending physician), positively skewing Dr X's average length of stay calculation for his patients and giving the CEO the impression that Dr X is a low-performer. In contrast, the daily discharge rate is unambiguously assigned to a clinical team or physician. The daily discharge rate, by definition, attributes equal weight to all of Dr X's patients, including Mr F. Since length of stay inappropriately allocates the lack of efficiency to Dr X's team, it is very difficult for physicians and clinical teams to accept length of stay as a measure of efficiency. On the other hand, since the daily discharge rate is a leading, real-time, fair and transparent measure, clinicians may feel more comfortable with applying it as an indicator of efficiency. As buy-in increases, there is likely a corresponding increase in probability that the hospital CEO and clinical teams can achieve their goal in reducing the length of stay.
Example 4: DDR is a sensitive screening tool able to capture system interventions
Solution
The VP of Patient Services is trying to create system-level improvements in patient flow across the hospital to help realise the CEO's goal in reducing the length of stay. She chooses to focus on the daily discharge rate, since it is sensitive to daily fluctuations in operations. She analyses variations in daily discharge rate and finds that during weekends and long-weekends, there is a significant reduction in daily discharge rate. Upon further analyses, it is determined that radiology services are closed during these times. The daily discharge rate has prompted the identification of the system-level problem, and now the VP is in a better position to make rational organisational decisions. Instead of maintaining the current state of operations, she decides to trial having radiology services open during weekends and will continue to monitor the daily discharge rate to determine the cost-effectiveness of this intervention.
Caveats for frontline managers considering measuring daily discharge rate
One of many measures in the toolkit of metrics to evaluate care
DDR is designed to be used in conjunction with other indicators. This includes efficiency (eg, ALOS, cost per weighted case), quality (eg, readmission rates, percentage of patients receiving appropriate venous thromboprophylaxis, percentage of completed discharge summaries), safety (eg, adverse drug events, hospital-acquired infections, inpatient falls), and patient and staff satisfaction. Concurrent measurement will ensure that DDR does not come at the expense of other measures.24
Variation as opposed to an absolute number
DDR's merit is based mostly on variation as opposed to an absolute number. The goal is not necessarily to reduce variability but to better understand variation to encourage the appropriate and efficient use of resources. When DDRs are low or high, due to some operational factor, there is likely inefficiency.
Since DDR is a ratio, the denominator (08:00 census) can have a substantial impact on its value. When used as a metric to monitor variation via control charts, the census' impact is taken into account as the warning and control limits vary depending on the calculated value. We caution against the use of DDR as an absolute number to compare individual clinical teams, different inpatient wards, or institutions. Instead, in these settings, it should be used to monitor performance in terms of variation and sustained trends.
Validation in daily discharge rate
We need to further confirm the appropriateness of DDR as a performance metric of operational efficiency, further understand its strengths and limitations, and evaluate its generalisability to hospital operations that affect the entire spectrum of inpatient hospital care. This involves spreading the measurement of DDR to other services within our hospital including Cardiology, Neurology and General Surgery that have different clinical and patient characteristics as well as spreading DDR to other teaching and community hospitals that may have different clinical and discharge practices.
Conclusion
Daily discharge rate is a real-time, sensitive and actionable indicator of discharge efficiency. It is sufficiently granular to effectively measure performance at the operational level and correlates well with ALOS. One of the key features of DDR is that it can be easily measured and reported on a daily basis. Via control charts, clinical teams can monitor, evaluate and characterise delays by responding to variations in their DDR. Measurement and reporting of DDR allows for greater frontline staff accountability and substantially speeds and strengthens feedback of issues that impact discharge efficiency. We believe DDR has the potential to drive timely improvements in the discharge process and ultimately improve the quality of care provided. It warrants consideration and further study by others interested in improving hospital operational efficiency.
References
Footnotes
Competing interests None.
Ethics approval Ethics approval was provided by the University Health Network Research Ethics Board.
Provenance and peer review Not commissioned; externally peer reviewed.