Article Text

Abstract
Background Veterans Health Administration (VA) intensive care units (ICUs) develop an infrastructure for quality improvement using information technology and recruiting leadership.
Methods Setting Participation by the 183 ICUs in the quality improvement program is required. Infrastructure includes measurement (electronic data extraction, analysis), quarterly web-based reporting and implementation support of evidence-based practices. Leaders prioritise measures based on quality improvement objectives. The electronic extraction is validated manually against the medical record, selecting hospitals whose data elements and measures fall at the extremes (10th, 90th percentile). Results are depicted in graphic, narrative and tabular reports benchmarked by type and complexity of ICU.
Results The VA admits 103 689±1156 ICU patients/year. Variation in electronic business practices, data location and normal range of some laboratory tests affects data quality. A data management website captures data elements important to ICU performance and not available electronically. A dashboard manages the data overload (quarterly reports ranged 106—299 pages). More than 85% of ICU directors and nurse managers review their reports. Leadership interest is sustained by including ICU targets in executive performance contracts, identification of local improvement opportunities with analytic software, and focused reviews.
Conclusion Lessons relevant to non-VA institutions include the: (1) need for ongoing data validation, (2) essential involvement of leadership at multiple levels, (3) supplementation of electronic data when key elements are absent, (4) utility of a good but not perfect electronic indicator to move practice while improving data elements and (5) value of a dashboard.
- Continuous quality improvement
- evidence-based medicine
- information technology
- organization
Statistics from Altmetric.com
Introduction
Ferlie and Shortell argue that until healthcare systems implement a comprehensive multi-level change (incorporating leadership at all levels, supporting a learning culture, emphasising the team, and using information technology), substantive sustained improvements in healthcare quality cannot succeed.1 The Veterans Health Administration (VA) is uniquely suited to adopt these elements to transform quality since the VA holds regional leaders accountable for specific processes with an annual performance measurement contract, has invested in a national system for learning, uses an electronic medical record and has a common goal to improve veterans care.2–4
The intensive care unit (ICU) is a perfect target to test such a change given its (1) high costs as a result of higher nurse to patient ratio, (2) high risk population, (3) reimbursement at or below costs and (4) increasing demand.5–7 Such a system might track and provide benchmarks for evidence-based practices, complication rates, and risk adjusted mortality and length of stay.8 This paper describes how a centralised infrastructure, the VA Inpatient Evaluation Center (IPEC), involved leadership and benchmarks ICU processes and outcomes. The infrastructure for learning and implementation tools for improving quality in VA ICUs will be discussed in future papers.
Methods
The project has been reviewed by the Institutional Review Board of the University of Cincinnati.
Setting
The 123 VA hospitals with ICUs are grouped into 21 regions across the USA (online appendix, table A Hospital Characteristics). VA's 183 ICUs average 10±4 beds (range 2–24 beds) and are categorised into 5 ICU types and 4 levels (LVL) of complexity. LVL 1 ICUs provide the most complex services, accounting for 60% of VA ICUs and 65% of ICU beds. LVL 3 and 4 ICUs provide more limited evaluation and treatment, representing 25% of ICUs, and 18% of VA ICU beds.9 For comparison, ICUs are assigned to a single peer group (Cardiac Care Units, Medical ICUs, Surgical ICUs, Medical/Cardiac ICUs, Mixed ICUs [LVL1/2], and Mixed ICUs [LVL 3/4]).
Involving leadership
VA leaders at four levels (national, regional, facility and ICU) coordinate the ICU quality improvement program. The IPEC executive board meets quarterly by teleconference, and includes eight people—(1) a national VA ICU and Quality leader; (2) a regional director, chief medical officer and quality manager and (3) a hospital director, chief of staff and nurse executive. An ICU nurse, manager and physician director from each of the 21 regions participate in the quarterly clinical advisory panel. The clinical advisory panel proposes new improvement projects—scanning recommendations from quality, safety, regulatory or ICU organisations.10–14 They also review measurement strategies, recruit ICUs to participate in pilot improvement projects and lead the regional quality initiatives. Region directors control his/her report access, but universally decided that hospitals in the region would see each other's results. The information generated by the program is protected under Quality Assurance legislation (CFR 38.U.S.C. 5705). VA program leaders (Cardiology, Nephrology, etc) propose new metrics/improvement projects to the IPEC director, which are then presented to the clinical advisory panel and executive board.
Assembling the data
Data sources
A computer programmer developed a computer program customised for each hospital that finds and drops data elements quarterly from the electronic medical record of each medical centre into an analytic file. This program uses the treating specialty field in the VA discharge database (VA Patient Treatment File; PTF) to identify patients with ICU. The program for those patients, then extracts the diagnosis ICD-9-CM codes (International Classification of Disease 9th revision—Clinical Modification codes), results of specific laboratory tests, vital signs, and medication orders for a time period surrounding the whole hospital admission (online appendix, table B and C detail data elements).
Diagnostic grouping
In a previously validated strategy, programming assigns each patient to one of 84 mutually exclusive categories using the ICD-9-CM code facilitated by Clinical Classification Software.15 16 Operative patients, those with operating room (OR) stays within 24 h of ICU admission, are grouped by ICD-9-CM procedure codes from the OR. Non-operative patients are grouped by ICD-9-CM diagnostic codes representing the primary reason for the ICU stay. Where possible, IPEC diagnostic groups match those defined by others. For example, the IPEC ICD-9-CM code groups for congestive heart failure, pneumonia and acute myocardial infarction (AMI) match those used by the Center for Medicaid and Medicare Services.17 Diagnostic groups are used in risk adjustment and to create appropriate pools for process measurement. The classification strategy is available on request.
Data validity (table 1)
As part of data validation policy, analysts at IPEC assume first that hospital outlier status in any data element is related to incomplete or inaccurate data extraction. Data errors could result in false positives (when the electronic extraction incorrectly reports results which are not present) or false negatives (when the electronic extraction fails to pull results which are present). To determine data accuracy, analysts (master's statisticians) rank order the hospitals by a measure of interest, identifying five hospitals at the top and bottom of the list. In each hospital, a program manager (nurse) reviews 10 charts missing the indicator of interest to determine if the electronic extraction matches that of chart review. For example, the program manager reviewed cases with the diagnosis of hip fracture, who electronically did not appear to receive pharmacologic prophylaxis for deep venous thrombosis, selected from sites with the lowest proportion of prophylaxis in hip fracture. Where chart review reveals inaccurate electronic extraction (eg, the presence of a laboratory value or delivery of an evidence based process counted as ‘missing’), the extraction program is reviewed and the site queried for anomalies in data entry. Our rules require that the electronic data matches in 95% of the chart reviews before the measure can be released and reported or the measure is dropped. Mortality is determined from the vital status file in the national VA database linked to benefits.18
Data validation issues and solutions
Analysing and interpreting the data
Internal VA and external experts in risk adjustment, intensive care and implementation science form the centralised methodology workgroup. This group reviews statistical issues in model development, process measurement, result presentation, implementation strategies and methodological limitations for emphasis.
Mortality and risk adjustment
Table 2 defines the five different mortality measures that facilitate interpretation.
Dashboard elements
The logistic (mortality) and linear (length of stay) regression models that account for differences in patient characteristics have previously been described and validated.19–22 Predictors are described in the online appendix, table D.17 23 The risk adjustment models compares (1) ICU mortality rates, (2) determines physiologic case severity index (CSI, the predicted mortality of index ICU divided by the predicted mortality of all VA ICU patients) and (3) throughput—adjusted bed turnover (number of ICU patients annually divided by number of ICU beds times the CSI) and observed minus expected length of stay.
Process indicators
The relevant population, numerators and denominators are defined using diagnosis, treatment, pharmacy and/or laboratory data. For example, in AMI, the number of patients with AMI and a physician order for aspirin within 24 h of admission forms the numerator and the total number of patients admitted with AMI the denominator. Patients with contraindications are excluded from both the numerator and denominator (eg, patients with ICU diagnosis of diabetes are excluded from the measure of mean glucose). Determination of indicator validity was described previously. Others have reported similarity of electronic quality measures compared to chart review.24
Feedback
Quarterly reports are retrieved from a secure website. They contain results depicted in graphic, narrative and tabular form, reported at the national, regional, hospital and ICU level benchmarked to peer group results. Given that all quality is local and that ICU directors are the best judges of the information needed to make process improvements, the IPEC benchmarks create a context for the process and outcome measures of local ICUs.
Results
Demographics
This is the largest continuous quality improvement initiative reported to date. The database includes 880 547 first admissions, averaging 103 689±1156 (±SD) ICU patients annually. The scope of the project is unusual since it includes patients housed in all types of ICUs including 48 smaller ICUs (17% of VA ICU patients/year), a group rarely included in ICU analyses and reports.
Data validation
Validation proved unnecessary in hospitals with a high (90th percentile) rate of cases with electronic measured values present, since these results were invariably correct. We found three types of problems in electronic data (table 1). First, variation in local use of the database altered capture of ICU patients and measures of medication adherence. Next, the database location of laboratory test values varies across the country and continues to move as new reagents or machines are added in the clinical laboratories. Third, the normal values of more recent laboratory tests (troponin or β naturetic protein) from different manufacturers differ significantly and change over time, a problem not seen in older lab tests.
Because the data in electronic health record determine location for delivery of diet and medications or lab draw, gaming length of stay is difficult. When a hospital experiences an abrupt change in a measure, the IPEC program managers contract the hospital to identify possible important changes in practice. To assure data integrity, a running checklist tracks strategies to eliminate known problems prior to report release (online appendix, figure A). These problems are not unique to VA. They exist to a greater or lesser extent in all healthcare information systems but are infrequently described in the literature.
Mortality measurement and reporting
We have previously reported variation in risk adjusted mortality across VA ICUs.20 In addition to patient characteristics managed with the risk model, differences in admission and discharge practices likely influence ICU mortality. For instance, smaller ICUs transfer a larger proportion of patients to another hospital at discharge (LVL4 vs LVL1, 17% vs 2%, p≤0.05). Availability of long-term acute care units (principally for ventilator dependent patients) varies widely as does access to step-down units staffed with nurses at a ratio between that of the ICU and ward. Comparing outcomes among similar peer groups and reporting 30 days as well as hospital mortality allows a more meaningful evaluation. Finally, to avoid wild goose chases related to random movements in point estimates due to small samples and large confidence intervals, a minimum of 200 cases and 20 deaths are required in reports of risk adjusted mortality (online appendix, figure B).
Electronic access to measures
Because no electronic sources existed for some measures of ICU performance, IPEC built a data management website to allow national roll-up and benchmarking of manually collected process and outcomes. Training assures use of standardised definitions. Local hospital staff, generally infection control practitioners, enter information about central line associated bloodstream infections (CLAB) and ventilator associated pneumonia rates (VAP), including device days and adherence to practice bundles (online appendix, table C).
Reports
Reports are issued quarterly by region and average 169±51 pages (range 106–299 pages). Hospital committees can review a single summary page (eg, Critical Care Committees). More than 3700 people nationwide who have access to IPEC reports include quality and safety managers, ICU directors and nurse managers, health systems specialists, infection control practitioners, and regional and local hospital leadership. For each region, the IPEC director highlights the improvement opportunities from their data in a biannual webinair. Leadership interest is elicited by presentation of important variation and inclusion of ICU improvement goals in the performance contract of the regional directors. For instance, the CLAB performance contract linked bonuses to a 25% reduction in CLAB rates (where reference rate was >2.0/1000 line days) or to <2.0 (where 25% of reference rate would be <2.0/1000 line days) or 9/11 months without a CLAB (for ICUs <1000 line days). Survey results found 83% regional and hospital leaders (directors, chief medical officers), 95% of ICU nurse managers and 85% of ICU physician directors had reviewed their IPEC data (Internal VA survey results from 2007). Computer tools to facilitate use of the data include a dashboard (figure 1, table 2) and business intelligence software (figure 2, Proclarity, Microsoft, Boise, Idaho, USA). An example of a report is provided in the online appendix.

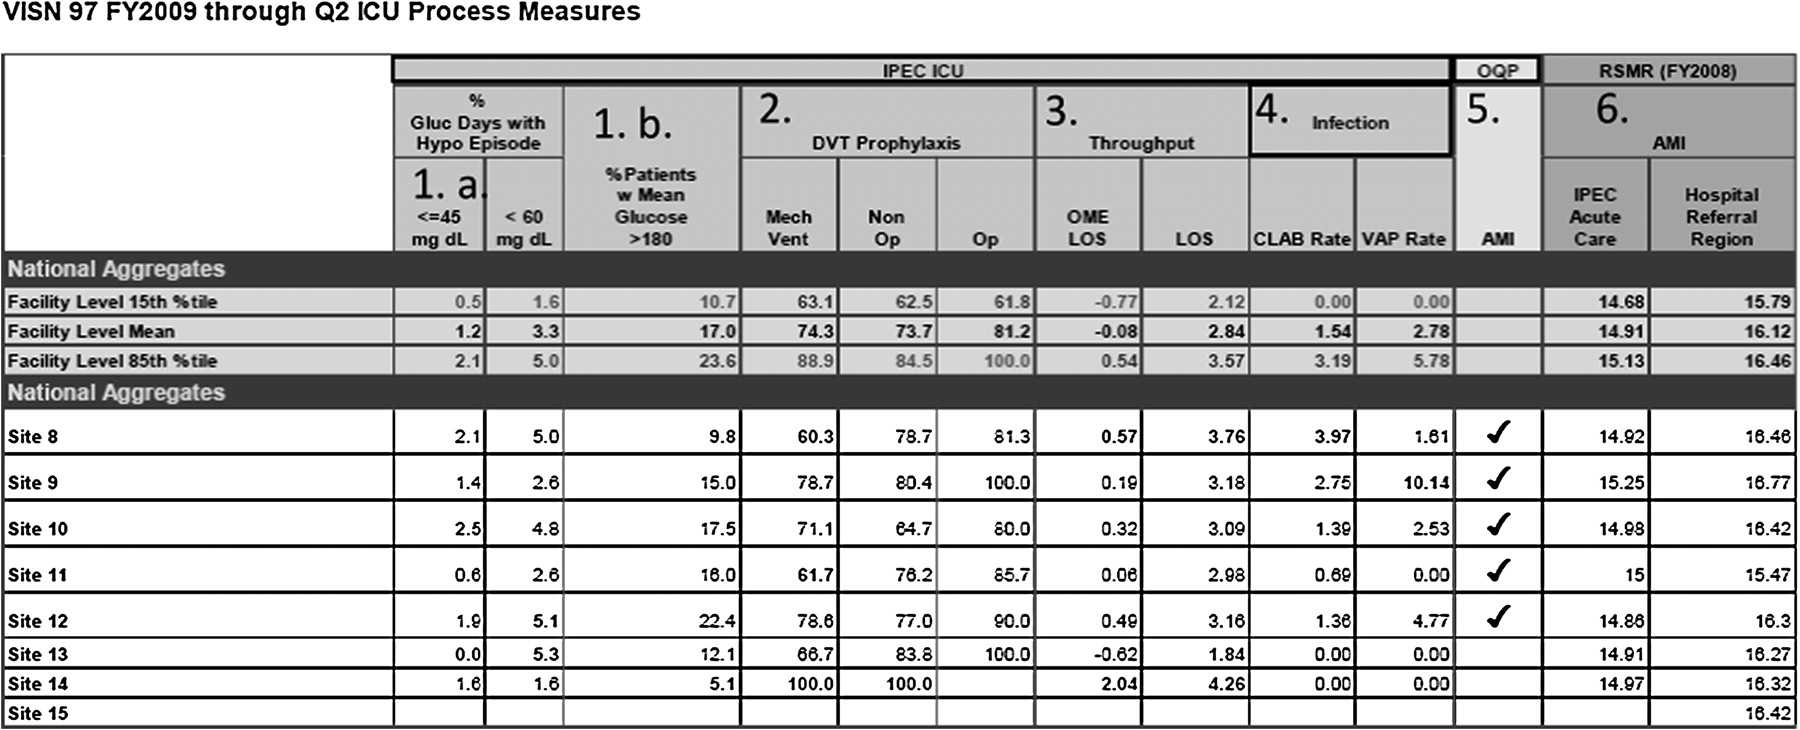
Quarterly VA ICU Dashboard for an imaginary region (VISN 97). National benchmarks in the first three rows depict the range of measure values at the 15th, mean, and 85th percentile. Process measures address 1. Glycaemic control (a) hypoglycaemic rates (number of days in patients receiving a hypoglycaemic agent with a serum glucose <45 mg/dl or <60 mg/dl divided by the total number of patient days during the time period on hypoglycaemic agents) and (b) proportion of patients with a mean glucose >180 mg/dl. 2. Deep venous thrombosis pharmacologic prophylaxis in patients receiving mechanical ventilation, those with high risk non-operative (COPD, CHF, pneumonia, renal failure, sepsis, cancer) and operative (major gastrointestinal surgery) diagnoses. 3. Throughput (a) observed minus predicted length of stay (OMELOS) and mean length of stay (LOS). 4. Hospital acquired infection rates (a) central line associated blood stream infections (CLAB) and ventilator associated pneumonia (VAP) expressed in infections divided by device days. 5. Compliance with Acute myocardial infarction (AMI) process measures. 6. Comparative VA risk adjusted mortality rates (RSMR) in AMI to hospital referral region using a Medicare mortality model.

Business intelligence software allows hospitals to explore results in a more granular fashion. Panel A: 1. Depicts overall (VA national) Observed minus predicted length of stay (OMELOS) in tabular and graphic form. 2. Highlights day admitted. 3. Shows 8 years of results 2002–2009. Panel B shows results when the operator clicks on ‘overall’ (1) expanding view to the region level; (regions A and B shown), (2) drags day admitted to the row box resulting in stratifying the OMELOS by day of the week, (3) to decrease clutter, the operator ‘hid’ years 2002–2007.
Senior leaders and the clinical advisory group selected improving hospital acquired infection rates, rates of hypoglycaemia and hperglycemia, throughput, and deep venous thrombosis prophylaxis. Thus, these elements were included in the dashboard. National benchmarks are reported at the mean, 10th and 90th percentile. ICU measures ≥90th or ≤10th percentile are bolded and in red or green font colours. This strategy allows viewers to quickly identify quality issues with the greatest need for improvement. Business intelligence software allows user-generated stratification useful for identifying a focus for local improvement (figure 2). Dashboard content is revised annually based on current improvement priorities in setting of limited real estate.
Discussion
Hospitals that monitor internal quality and safety indicators, use national benchmarks, and hold healthcare executives accountable to quality improvement have better performance in process measures and lower mortality.25 The measurement and reporting infrastructure provided by the VA Inpatient Evaluation Center provides these tools for the ICU. Few healthcare systems provide reliable benchmarked measures in multiple domains in the ICU. Several factors contribute to use of ICU measures—(1) piloting IPEC in six regions first, (2) selection of relevant measures, (3) leadership buy-in at all levels of the organisation, (4) the assumption that variation first stems from incorrect data, increasing the clinicians' sense of transparency and (5) consolidation of information in a dashboard identifying movable targets.
Individual ICUs in Britain, Australia and the USA participate in large scale efforts to measure and compare ICU performance. Such projects include the Intensive Care National Audit and Research Center (ICNARC, Britain),26 the Australian and New Zealand Intensive Adult Patient Care (ANZIC) database and Critical Care Research Center27 28 and Project Impact in the US29 now folded into a private company. These programs differ from IPEC in that their reports generally include only throughput, severity of illness and risk adjusted outcomes; portions of data collection rely on manual entry, and participation is voluntary. Universal required participation, leadership support and access to the VA electronic medical record have been the key for wider measurement and reporting in VA ICUs.
The selection of quality measures recommended by external regulatory and quality organisations assures clinical relevance. Use of benchmarks stratified by type and complexity of ICU reduces arguments that ‘my ICU is different’ and produces regional competition. These elements drew clinicians into the quality improvement efforts. The persistent findings of only a weak association between mortality and process-based quality measures in observational studies suggest that mortality rates are unlikely to detect moderate differences in quality.30 31 However, we report them because (1) the public has a strong interest in mortality rates as an outcome, (2) providers and management are interested in their mortality rates relative to peers and (3) because other reporting initiatives in the United States continue to report risk adjusted mortality.17 30
The IPEC approach has limitations. Data elements not present in electronic databases limit measurement. The data management website supplements electronic data collection, permitting roll up of manually collected data for hospital acquired infections. Important data elements such as left ventricular ejection fraction and use of mechanical compressive devices in DVT prophylaxis were less easily managed. Application of this infrastructure to another healthcare system likely requires development of leadership support, influence in the ICUs and communication strategies similar to that used by IPEC. Using imperfect measures balances the ability to improve quality with a good available indicator against the goal of perfect measurement. National targets for improvement must take into account the measure's flaws. Next, the delay in feedback, even quarterly, is far from ideal.
A dashboard helps to manage the data overload when there is too much data, time to review the data is limited and/or the volume precludes finding the informative pieces of data.31 But dashboards display information simply, inevitably losing some context and nuance. Commonly, dashboards present performance indicators graphically and are limited to a single page.32 The IPEC dashboard is a work in progress, adding links to primary data sources, and moving to web-based design to allow drill down capability.33
Lessons from this report apply to non-federal institutions, particularly as utilisation of electronic medical records increase. Such lessons include (1) building a flexible infrastructure that allows electronic data collation, (2) data element validation, (3) communication with sites to promote use of the information, (4) the essential involvement of leadership at multiple levels in crafting the product, (5) supplementing electronic data with other forms of data collection when key elements are absent from the databases and (6) being prepared to accept the potential for a good but not perfect electronic indicator to move practice while continuing to work towards improvement of the data elements.
References
Supplementary materials
Web Only Data
Files in this Data Supplement:
Footnotes
Funding This program is funded by the Veterans Health Administration of the US Department of Veterans Affairs.
Competing interests None declared.
Ethics approval This study was conducted with the approval of the University of Cincinnati IRB.
Provenance and peer review Not commissioned; externally peer reviewed.