Article Text

Abstract
Background Evidence that hand hygiene (HH) reduces healthcare-associated infections has been available for almost two centuries. Yet HH compliance among healthcare professionals continues to be low, and most efforts to improve it have failed.
Objective To improve healthcare workers' HH, and reduce healthcare-associated infections.
Design 3-year interrupted time series with multiple sequential interventions and 1-year post-intervention follow-up.
Setting Teaching hospital in rural New Hampshire.
Interventions In five categories: (1) leadership/accountability; (2) measurement/feedback; (3) hand sanitiser availability; (4) education/training; and (5) marketing/communication.
Measurement Monthly changes in observed HH compliance (%) and rates of healthcare-associated infection (including Staphylococcus aureus infections, Clostridium difficile infections and bloodstream infections) per 1000 inpatient days. The subset of S aureus infections attributable to the operating room served as a tracer condition. We used statistical process control charts to identify significant changes.
Results HH compliance increased significantly from 41% to 87% (p<0.01) during the initiative, and improved further to 91% (p<0.01) the following year. Nurses achieved higher HH compliance (93%) than physicians (78%). There was a significant, sustained decline in the healthcare-associated infection rate from 4.8 to 3.3 (p<0.01) per 1000 inpatient days. The rate of S aureus infections attributable to the operating room rose, while the rate of other S aureus infections fell.
Conclusions Our initiative was associated with a large and significant hospital-wide improvement in HH which was sustained through the following year and a significant, sustained reduction in the incidence of healthcare-associated infection. The observed increased incidence of the tracer condition supports the assertion that HH improvement contributed to infection reduction. Persistent variation in HH performance among different groups requires further study.
- Infection control
- MRSA
- nosocomial infections
- healthcare quality improvement
- leadership
Statistics from Altmetric.com
Introduction
Background
Hand hygiene (HH) has long been known to reduce healthcare-associated infections,1–5 but published reports repeatedly illustrate the failure of healthcare professionals to clean their hands regularly.6–10 Most modern efforts to improve HH have failed, or achieved only modest success.11 ,12 Recently, two reports described successful HH initiatives, but they lacked detail regarding implementation, or convincing evidence that linked better HH to better patient outcomes.13 ,14
We report a multifaceted improvement initiative that achieved sustained HH improvement among healthcare personnel, and significant reduction in healthcare-associated infections.
Methods
Setting
Dartmouth-Hitchcock Medical Center is a 383-bed teaching hospital in rural New Hampshire; 60% of inpatient beds are in single rooms. When this initiative began, the culture was one in which autonomy was valued and enthusiasm for quality improvement activities varied; such efforts typically attracted small groups of committed nurses. Physicians frequently were skeptical about efforts to improve quality in general, and about the importance of HH in particular. For many, there was a sense that local efforts to improve safety and quality were not consistently supported by organisational leaders.
Interventions
This 3-year initiative developed iteratively as part of routine operations of our hospital's infection prevention program, which focused its quality improvement efforts on HH performance. Because both the interventions and ongoing measurement were part of normal operations, approval from the Institutional Review Board was not sought. During late 2005 and early 2006, we focused on development of reliable measurement and feedback mechanisms. A series of interventions began in late 2006, and by 2008, explicit interventions were implemented across the medical centre. No new interventions were added after 2008.
Building on the work of Goldmann,15 which framed the need for both system and personal accountability for HH, and drawing on available HH guidelines,8 ,16 we identified five overarching areas for intervention.
Leadership and accountability
Leadership at all organisation levels publicly emphasised the importance of HH in preventing patient harm, the unacceptability of current performance and a public commitment to improve.
Measurement and feedback
We initiated routine HH audits on all units, and continued surveillance for healthcare-associated infections. Monthly unit-specific data were published on an intranet site available to all staff, and reported to executive leadership, clinical leaders and board members.
Hand sanitiser availability
A multidisciplinary workgroup led by the director of Biomedical Engineering and a physician, developed strategies to optimise availability of hand sanitiser (Purell™, 62% ethyl alcohol formulation). They engaged local units to evaluate their clinical environments to determine ideal locations and product types.
Education and training
We developed an electronic learning module and a training video that provided HH education for all staff. It was accessible through the hospital intranet. We implemented a ‘certification’ program, by which staff demonstrated HH competency.
Marketing and communication
Marketing staff created a series of awareness-raising posters and screen savers, stories in medical centre publications and local news outlets, and direct communications with staff about expectations and progress towards goals.
Process and outcome measures
We tracked two primary outcomes monthly: (1) HH compliance rates and (2) healthcare-associated infection rates. In addition to tracking monthly outcomes, we also assessed the number of infections prevented by comparing baseline infection rates during 2006, before most of the interventions were implemented, with post-initiative infection rates in 2009, when no further new interventions were introduced.
We also assessed implementation fidelity in several ways. We measured the number of HH audits, the inventory of hand sanitisers consumed, and the number of HH-related posters, screensavers and articles in internal publications. To assess staff exposure to the interventions, we measured the number of monthly visits to the report card website, the completion rate for the electronic learning module and the number of staff who were certified ‘competent’ in HH.
Our primary process measure was HH compliance, assessed by trained Infection Prevention staff (who were not blinded to the ongoing interventions) through direct covert observation. During training, consistency among observers was validated by ensuring that there was at least 90% agreement in measurement during simultaneous observation periods. Four nurse infection preventionists performed 91% of the audits, counting HH ‘opportunities’ (defined as before and after contact with patients or their immediate environments), and for each opportunity, documenting whether HH was performed. Compliance was calculated by dividing the number of times HH was performed by the total number of opportunities.17 Observations were conducted at least once a month on all inpatient medicine, surgery and paediatric units, including all critical care units, the emergency department and two perioperative units. HH opportunities were recorded by unit and by staff category (physician, nurse or other staff).
Through daily review of microbiology data, with medical record review, infection prevention staff applied standard definitions18 to identify all cases of bloodstream infection due to any organism, clinical infection at any site due to Staphylococcus aureus and Clostridium difficile infection. Infections were attributed to inpatient care using standard criteria.18 Infections were attributed to outpatient care if they occurred within 30 days after an outpatient procedure, or in an outpatient who had a medical device in place. Infections attributable to the operating room included surgical site infections18 and bloodstream infections that occurred within 48 h after surgery.
Our primary clinical outcome measure was the monthly healthcare-associated infection ‘index rate,’ calculated by total occurrences divided by inpatient days. We further categorised infections due to S aureus into those attributable to inpatient and outpatient care (where the interventions were implemented), and those (mostly surgical site infections) that were attributable to the operating room and would be expected to be less sensitive to changes in HH compliance.
We calculated an ‘expected’ number of infections for 2009, our post-intervention year, by multiplying the 2006 (baseline) healthcare-associated infection index rate by the number of inpatient days in 2009. We estimated the number of infections prevented during 2009 by subtracting the actual number of infections in 2009 from the expected number.
Analysis
We used statistical process control charts to monitor improvement over time. We used a p chart to evaluate HH compliance (attribute data), and an XmR chart for the healthcare-associated infections index (continuous data). Control limits were set at 3 ς (equivalent to 3 SD); eight consecutive points below or above the monthly average represented a significant shift in the data (equivalent to p value <0.01).19 We used χ2 analysis to compare 2006 and 2009 unit-specific HH rates. We used pairwise correlation to determine the association between HH compliance and healthcare-associated infections (rates per month).
Results
Implementation of interventions
Leadership and accountability
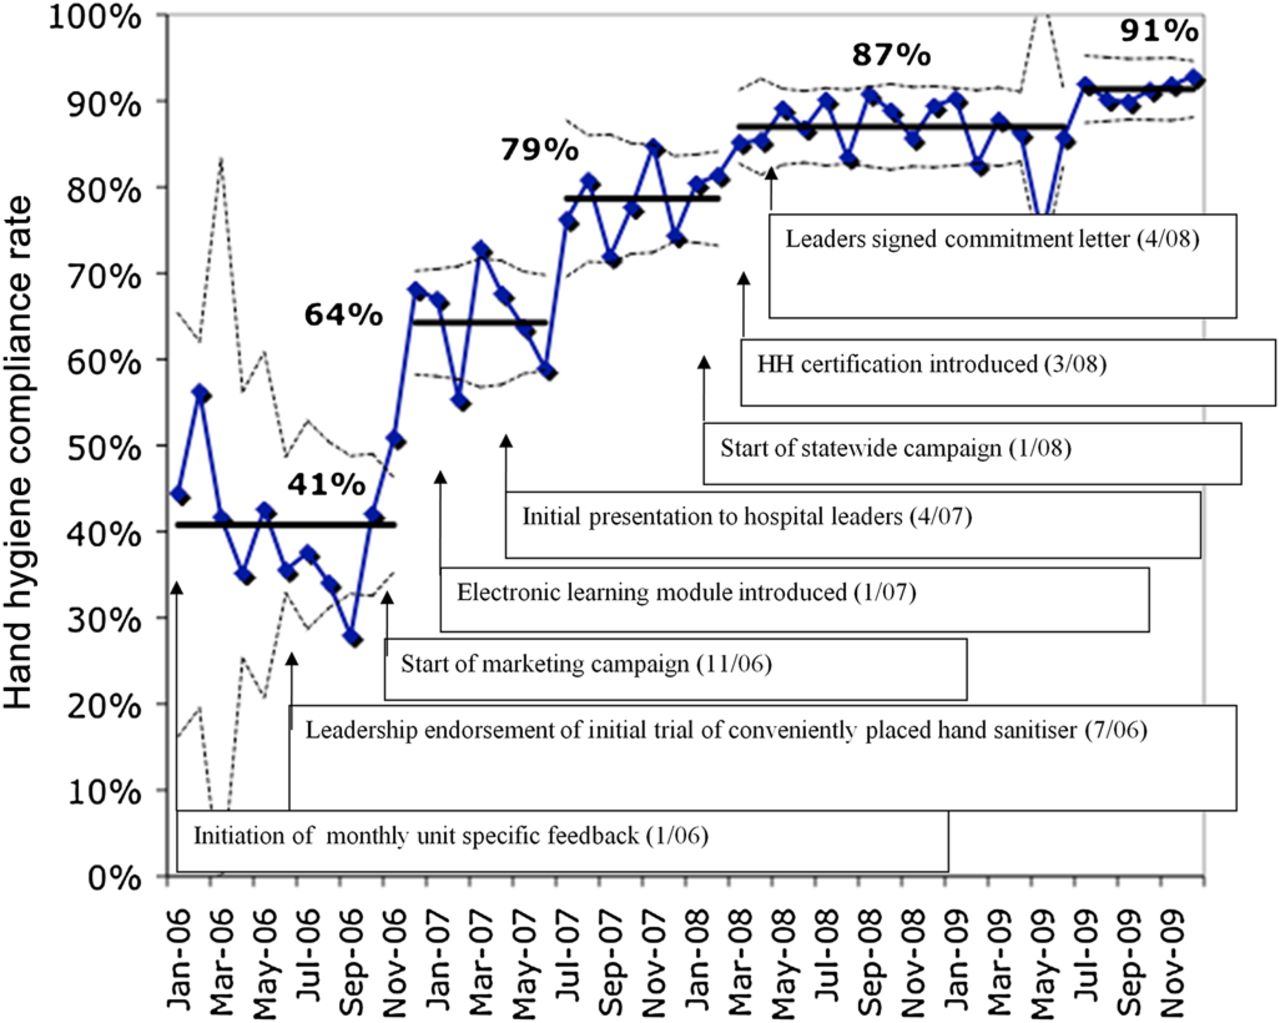
We implemented a series of interventions over a 3-year period (figure 1). Beginning during the baseline year (2006), the professional time of Infection Prevention staff was committed to HH auditing and creation of internal reporting mechanisms. In mid-2006, a review board comprised of senior administrative and clinical leaders debated and ultimately endorsed a project designed to improve HH performance in the preoperative holding unit, which set the stage for more active improvement efforts across the medical centre.20 This successful prototype initiative used process mapping to optimise placement of hand sanitisers within the routine workflow. In early 2007, and again in 2008, the Hospital Epidemiologist made presentations to clinical leadership groups to galvanise attention on the need to improve HH. In early 2008, the physician and nursing governance bodies, the medical centre co-presidents and the trustees publicly signed a letter of commitment to achieve 100% HH, as part of a statewide campaign.

Monthly hospital-wide observed hand hygiene compliance rate for all staff, January 2006–December 2009. Interventions are indicated with arrows. Solid lines indicate mean hand hygiene compliance, and are reset with every significant shift. Dotted lines indicate upper and lower control limits, set at 3-ς. No data is available for April and May 2009 due to H1N1 outbreak.
Measurement and feedback
Between 2006 and 2008, the number of HH audits doubled, with average monthly observations increasing from 244 (95% CI 99 to 349) to 498 (95% CI 450 to 544). Unit-specific HH compliance and healthcare-associated infection data were posted monthly on an intranet website. Between 2006 and 2008, the average number of monthly visits to that website increased fourfold, from 30 to 138.
Availability of hand sanitiser
Over the 3 years, hand sanitiser refills for wall-mounted dispensers increased 37% from 32 960 to 45 184, and the number of desktop dispensers increased 86% from 55 500 to 103 392. The number of litres per 1000 inpatient days increased from 59 to 82. Personal hand sanitiser dispensers were made available for anaesthesiologists in the operating room.21 Electronic counters in hand sanitiser wall dispensers were used to determine optimal locations for dispensers.22
Education and training
An electronic learning module on HH was implemented in 2007. From 2007 to 2008, overall completion rates increased from 83% (95% CI 82% to 84%) to 94% (95% CI 94% to 95%). During 2008, 1457 (96%) of 1512 nurses, 361 (76%) of 475 physicians, and 3550 (96%) of 3702 other staff completed the module compared with 1298 (92%) of 1408 nurses, 227 (53%) of 427 physicians, and 3007 (83%) of 3607 other staff during 2007. During 2008, the first year of the HH certification program, 1429 staff, students and volunteers (a quarter of the workforce) sought voluntary certification.
Marketing and communication
Eleven poster designs were created and distributed sequentially beginning in November 2006. Themes included information and education about HH and its links to transmission of infection, focus on patient-centred care, and celebration of local successes. Beginning in 2008, a series of 13 screensavers (several from Novant Health System's successful HH campaign13) were rotated on inpatient computer workstations. Two articles about the campaign were featured in internal publications as well as the local newspaper.
Hand hygiene improvement
There were three statistically significant increases in HH compliance during the 3-year initiative. The first, from 41% to 64% occurred at the end of 2006; the second, to 79%, occurred during summer of 2007; the third, to 87%, occurred in the early spring of 2008. A fourth increase, to 91%, occurred during the year following the campaign (figure 1).
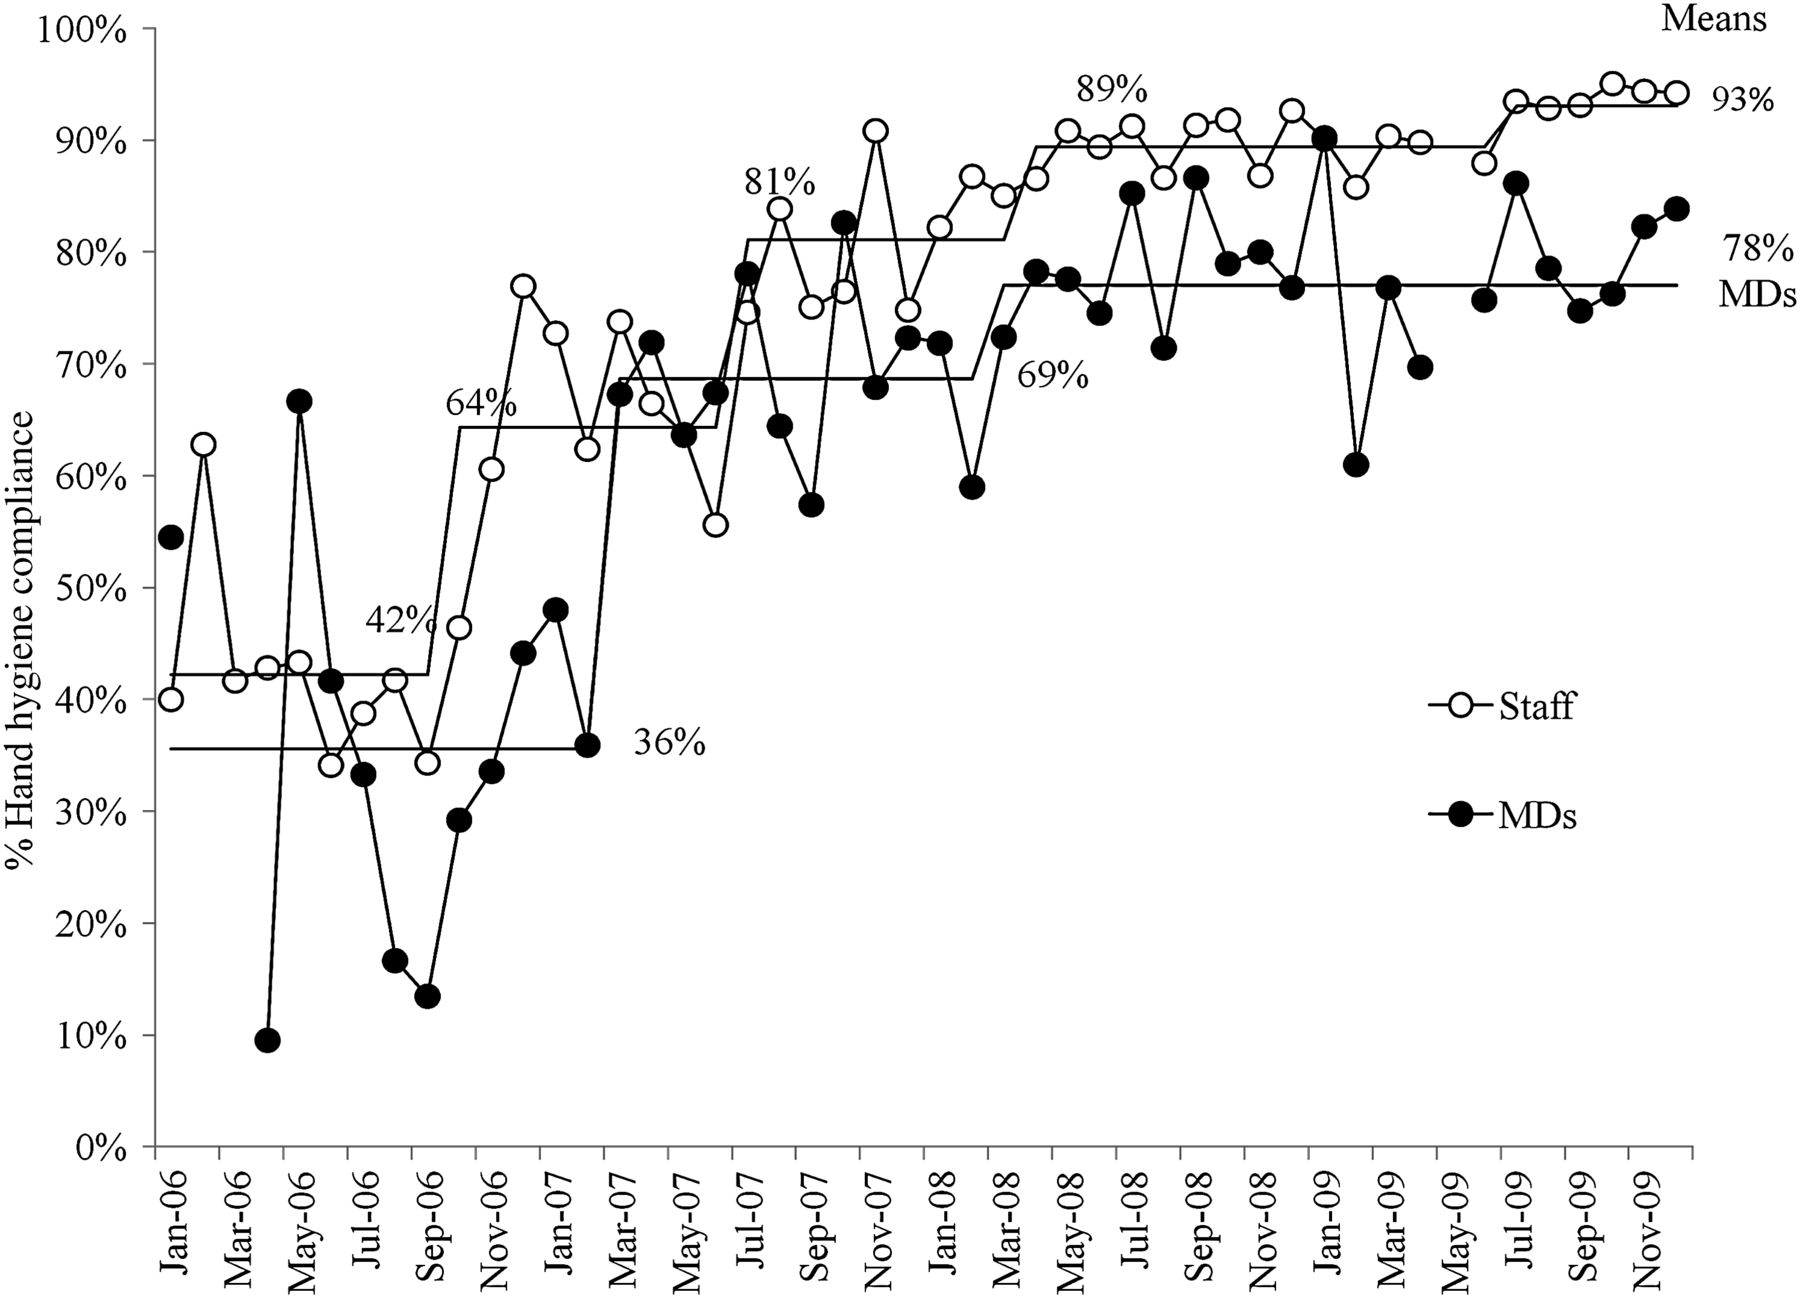
Compared with their baseline performance, 13 of 16 units demonstrated significant improvement in HH performance, with 9 units reaching the 90% target by 2009 (figure 2). In addition, the gap between the highest and lowest-performing units narrowed from 63% to 16%, due mostly to improvement of the lowest-performing units (figure 2). Both physicians and other staff improved significantly between 2006 and 2008; only non-physician staff achieved the 90% target (figure 3).

Hand hygiene compliance by hospital unit type, 2006 vs 2009. *Indicates units with significant improvement (p<0.05).

Monthly hand hygiene compliance in physicians (MD) compared with other staff, 2006–2009. Solid lines indicate mean hand hygiene compliance, and are reset with every significant shift. Upper and lower control limits are not shown, but are set at 3-ς. No data is available for April and May 2009 due to H1N1 outbreak.
Reduced healthcare-associated infections
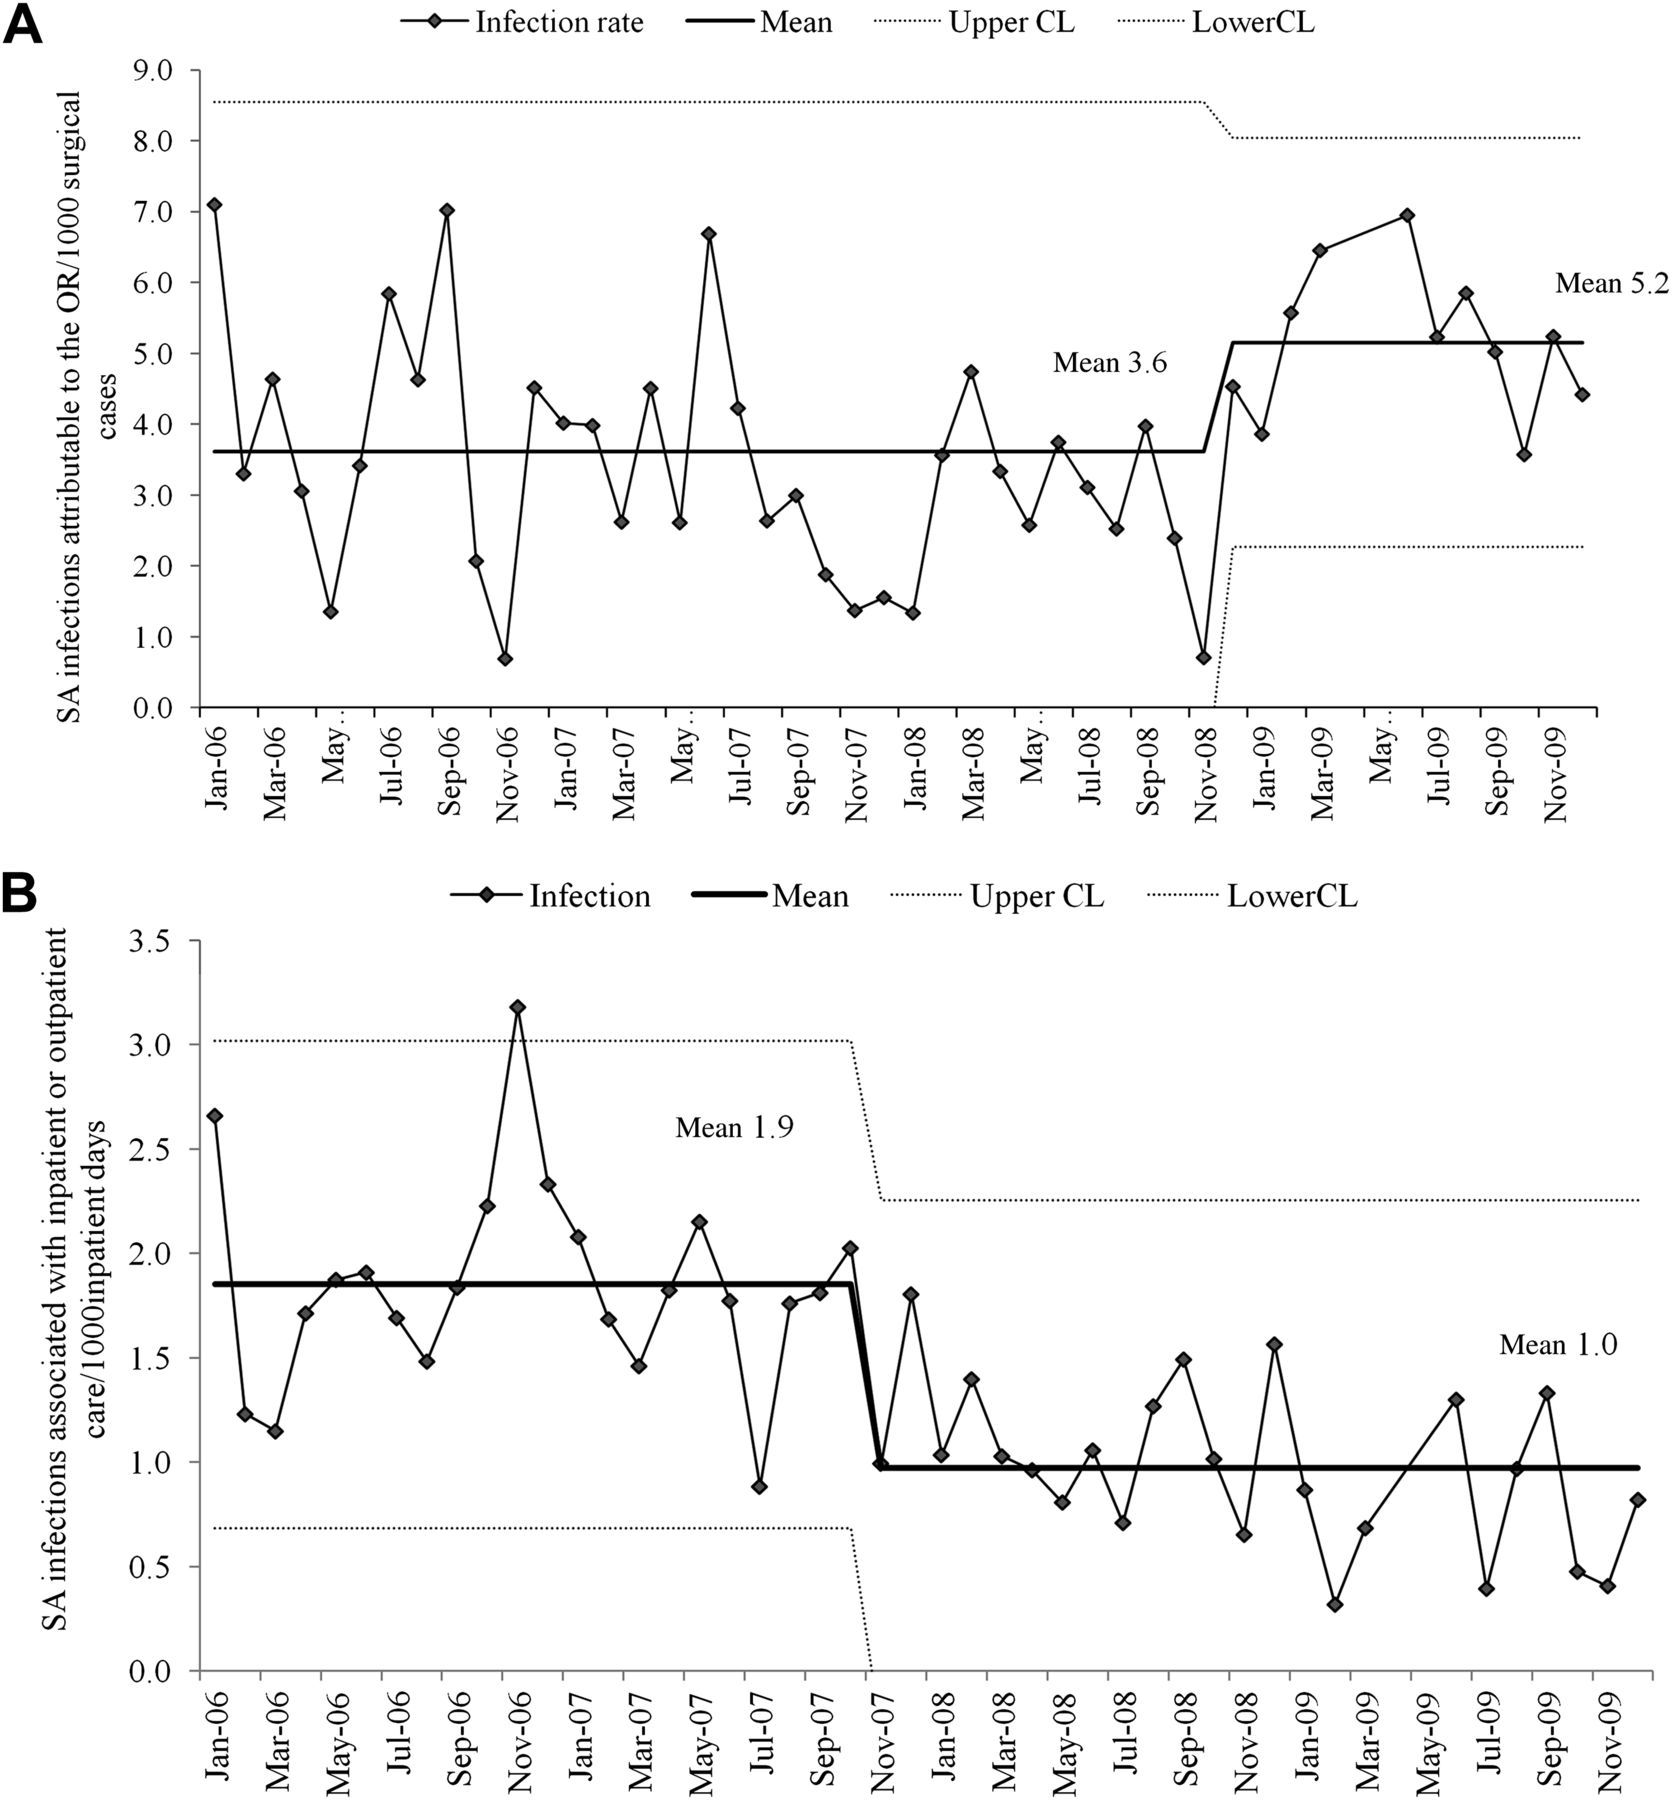
During 2009, 394 patients had healthcare-associated infections compared with 374 in 2008, 493 in 2007 and 538 in 2006. Once during the 3-year period, in the fall of 2007, the healthcare-associated infection index rate changed significantly, falling 31% from 4.8 (95% CI 4.5 to 5.2) to 3.3 (95% CI 2.9 to 3.7) per 1000 patient days (figure 4). The rates of both S aureus infection (2.5 to 1.6 per 1000 patient days, p<0.001) and bloodstream infection (2.1 to 1.4 per 1000 patient days, p=0.004) fell significantly during 2008, while the rate of C difficile infection was unchanged (0.9 to 0.6 per 1000 patient-days, p=0.1). As illustrated in the XmR control charts in figure 5, the rate of S aureus infection associated with inpatient and outpatient care fell significantly, while there was a significant increase in S aureus infections attributable to the operating room. (An investigation of a higher than expected number of infections in early 2009, revealed that multiple strains of S aureus were involved, and we found no evidence for a single root cause to explain the infections.) We estimated that 185 infections were prevented in 2009.

Monthly hospital-wide healthcare-associated infection index rate, January 2006–December 2009. Healthcare-associated infection index rate is the total number of healthcare-associated bloodstream infections, other infections due to Staphylococcus aureus, and Clostridium difficile infections per 1000 inpatient days. Upper and lower control limits set at 3-ς. No data is available for April and May 2009 due to H1N1 outbreak.

(A) Rate of healthcare-associated Staphylococcus aureus (SA) infections attributable to the operating room, January 2006–December 2009. (B) Rate of healthcare-associated S aureus (SA) infections associated with inpatient and outpatient care, January 2006–December 2009.
Finally, the pairwise correlation coefficient between healthcare-associated infections index and HH rate for all healthcare workers was −0.65 (R-squared 0.42, p<0.001) (figure 6).

Scatterplot of monthly healthcare-associated infection index rates and hand hygiene compliance rates, January 2006–December 2009.
Discussion
HH improved, and healthcare-associated infections rates fell significantly during the 3-year, multifaceted initiative. Moreover, these successful outcomes were sustained for the year following the initiative.
Sustained high-level HH performance has eluded healthcare professionals for years.10 Our knowledge about which interventions are required to improve and sustain HH compliance is hampered by the fact that most reports claiming success fail to achieve more than modest, and often temporary, improvement. Authors tend to look for whether interventions work, rather than which interventions work in what settings.11 ,12
Our initiative achieved a similar degree of success, and extends the findings of Lederer et al 13 and Doron et al,14 thereby providing insight into temporal associations among interventions, HH performance and clinical outcomes, and adding evidence linking HH improvement to lower infection rates. By identifying variation in the responses to the initiative across units and healthcare worker types, we can begin to generate hypotheses about the role of contextual factors in HH improvement.
Our monthly data show the single biggest improvement in HH overall, and in physician HH specifically, occurred early in 2007, after a year of measurement and monthly feedback of the poor performance. We believe that simply being made aware of the problem may have been enough to change the behaviour of many. For instance, physicians reported that, for them, regularly seeing data linking HH performance to healthcare-associated infections was important. This contrasts with Pittet's initiative,4 which failed to improve physician HH and may not have linked HH to infection rates so overtly.
Continued improvement occurred at intervals throughout the initiative between 2006 and 2008, as planned interventions related to education and product availability were added sequentially—increases in the number of HH audits, the amount of hand sanitiser purchased, the number of report card website visits, the completion rate of educational modules and the number of staff certified in HH. We suspect our success, like that of others,4 ,8 ,11–14 was the result of a combination of all our interventions.
Our initiative was associated with a significant reduction in healthcare-associated infections, the ultimate aim of improving HH. Although many factors may contribute to lower infection rates, the likelihood that HH improvement was a strong driver of lower infection rates is supported by the lack of improvement in the incidence of our tracer condition (infections related to the operating room, where our interventions would have been expected to have little or no impact). In addition, we demonstrate a significant inverse correlation between HH compliance and healthcare-associated infection rates (figure 6).
Interestingly, our monthly measures suggest that infection rate reduction lags behind HH improvement. This delay suggests that a minimum threshold of HH compliance and/or a sustained period of high performance are required before there is a measurable effect on infections. It is possible that other studies that failed to demonstrate an impact of HH on healthcare-associated infections23 may simply not have reached such a threshold, or continued measurement long enough to record an improvement.
Variation in HH performance, and in responses to improvement efforts, has been documented and discussed by others.4 ,24–28 Our data illustrate persistence of variation, even in the context of improvement among virtually all groups. This persistent variation reinforces our theory that it is crucial to understand local unit context when designing and adapting improvement strategies.29–31 The following five contextual factors may serve to explain some of the variation we observed. First, locations for hand sanitisers varied by unit and may have been hard to find for temporary non-unit staff. Second, a single educational module designed for use by a wide range of staff was not tailored for those with more medical knowledge; physician completion rates of these modules were lower than those of other staff. Third, monthly feedback was stratified by unit, but not by physician section, and thus, may not have had as powerful an effect on physician behaviour. Fourth, while the two highest-performing units housed highly vulnerable patients, both units had previous experience in implementing local quality improvement initiatives. In one of the units, strong physician and nursing leadership for patient and family-centred care was long-standing. These observations emphasise a strong role for unit culture. Finally, lower performance in the intensive care unit and the emergency department may have been attributable to the need to practice more frequent HH in such high-acuity settings.4 ,25
Our study has several limitations. We cannot be certain of the relative importance of individual interventions in bringing about better HH performance. Moreover, we did not have precise measures for all interventions, for example, convenience of product placement, and strength of leadership. Our compliance audits focused on selected HH opportunities that were easily and reproducibly measurable, but did not include opportunities during patient care. We did not track the costs associated with implementation. That said, based on Pittet's conservative estimates, we postulate that the prevention of 185 infections would have resulted in savings far exceeding the cost of implementing our interventions.32 Finally, we believe that the use of a tracer condition adds strength to our conclusion that better HH contributed directly to lower infection rates. We suspect that our initiative had additional indirect effects simply by raising awareness about the importance of preventing healthcare-associated infections. An organisational culture that became more focused on patient safety, partly as a result of our initiative, as well as other quality improvement initiatives during this 4-year period, could also have contributed to lower infection rates.33
A recent Cochrane review rejects almost all the published evidence about which interventions work to improve HH compliance on the grounds that it is methodologically weak.12 Our study might be rejected by this group on similar grounds. However, HH improvement initiatives aim to change behaviour in complex sociocultural environments, not to study single interventions under highly controlled circumstances.31 It is increasingly recognised that the success or failure of such complex interventions and their generalisability, must be considered explicitly in the context of the consistently evolving environment in which they are conducted.34–37 We would assert that embedded in studies such as ours and many of those rejected by Gould and colleagues,12 is potentially valuable information about context: these studies offer glimpses of interventions that appear to be effective in certain settings, and not in others, providing a rich resource for those designing further research or quality improvement initiatives.
Conclusions
While persistence of variation in HH performance by profession and across units indicates both the opportunity for further improvement and the need for additional research, our study adds to the evidence that sustained and significant improvement in HH is achievable. This can be accomplished through implementation of a multifaceted set of interventions targeting leadership, product convenience, measurement and feedback, education and marketing. Moreover, our study adds evidence to support the substantial impact of improved HH compliance on a wide range of healthcare-associated infections.
Acknowledgments
The authors acknowledge the countless healthcare personnel at Dartmouth-Hitchcock Medical Center who make personal commitments to care for patients with clean hands, and thank the many workgroup members and local teams who continue to develop and implement strategies for improving hand hygiene. We also acknowledge the impact of ongoing collaborative work facilitated by the New Hampshire Healthcare Quality Assurance Committee to improve hand hygiene and prevent healthcare infections in all New Hampshire hospitals. The authors thank Frank Davidoff and David Stevens for thoughtful review of earlier versions of the manuscript.
References
Footnotes
-
Competing interests None.
-
Ethics approval Formal ethics approval from the IRB was not sought because the work was done as part of normal operations of our infection control program, which participates in many quality improvement activities.
-
Provenance and peer review Not commissioned; externally peer reviewed.