Article Text

Abstract
Developing quality indicators (QI) for national purposes (eg, public disclosure, paying-for-performance) highlights the need to find accessible and reliable data sources for collecting standardised data. The most accurate and reliable data source for collecting clinical and organisational information still remains the medical record. Data collection from electronic medical records (EMR) would be far less burdensome than from paper medical records (PMR). However, the development of EMRs is costly and has suffered from low rates of adoption and barriers of usability even in developed countries. Currently, methods for producing national QIs based on the medical record rely on manual extraction from PMRs.
We propose and illustrate such a method. These QIs display feasibility, reliability and discriminative power, and can be used to compare hospitals. They have been implemented nationwide in France since 2006. The method used to develop these QIs could be adapted for use in large-scale programmes of hospital regulation in other, including developing, countries.
- Chart review methodologies
- Health policy
- Quality measurement
This is an open-access article distributed under the terms of the Creative Commons Attribution Non-commercial License, which permits use, distribution, and reproduction in any medium, provided the original work is properly cited, the use is non commercial and is otherwise in compliance with the license. See: http://creativecommons.org/licenses/by-nc/3.0/ and http://creativecommons.org/licenses/by-nc/3.0/legalcode
Statistics from Altmetric.com
Introduction
Over the past 10 years, the use of quality indicators (QIs) has been strongly encouraged as a means of assessing quality in hospitals. QIs are now a widely used tool in hospital regulation in developed countries (eg, in performance-based financing and the public disclosure of hospital comparisons).1
It is well established that key attributes of QIs are able to detect targeted areas for improvement on topics of importance, scientific soundness and feasibility.2 For national comparisons of healthcare organisations (HCO), a valid and standardised data collection process is also required, as any errors could affect a hospital's reputation and also have financial repercussions. Three main data sources are used to develop QIs: (1) ad hoc surveys (eg, patient's experience and satisfaction indicators), but these are costly and require recruitment of respondents and high hospital commitment,3 (2) medico-administrative data (eg, patient safety indicators), but these often capture limited information on complex care processes4 and (3) medical records (eg, clinical practice and organisational indicators) which are the preferred option for obtaining accurate and reliable clinical and organisational information.5–9
Most medical records are still paper medical records (PMRs) and entail difficulties in terms of data extraction that remains manual.10 The adoption of interoperable electronic medical record (EMR) systems could promote efficiency by developing an automated process of data extraction. However, it is expensive. Moreover, in the most highly developed countries that invest in this area, it remains arduous. For instance in US hospitals, only 13% reported use of a basic EMR system in 2008, according to a study by Jha et al.11 Although these numbers have significantly increased over the last few years—2011 data shows 35% adoption of basic EMR systems by US hospitals—the rates of adoption are still low.12 A recent national study shows that in France only 6% of medical records are fully electronic.13 In terms of data extraction for the purposes of quality measurement, a basic EMR system does not necessarily enable easy and automatic computation of aggregated data, nor does it preclude the use of partial paper charts, making some data completely inaccessible via the EMR.
We propose a pragmatic method for using PMRs to produce national QIs that display feasibility, reliability and discriminative power, and that enable PMR audits for hospital comparison. The method is based on data extraction from a random sample of PMRs in each hospital. It has been implemented in France since 2006, but could be adopted by other countries interested in assessing large-scale hospital performance.14 We describe the methods development, the PMR sampling strategy and the statistical procedures for ensuring robustness. Each step of the method is illustrated with appropriate examples. Last, we discuss the place of such a method in the context of development of EMR systems.
Background to method development and implementation
The method was developed and has been implemented by the COMPAQH project team (COordination for Measuring Performance and Assuring Quality in Hospitals), a French national initiative for the development and use of QIs, coordinated by the French Institute for Health and Medical Research (INSERM) and sponsored by the Ministry of Health and the French National Authority for Health (Haute Autorité de Santé, HAS).13 ,15
The QIs were selected and designed with the collaboration of the French public authorities and health professionals. Each is categorised within nine priority areas for quality improvement: (1) pain management; (2) continuity of care; (3) management of patients with nutritional disorders; (4) patient safety; (5) taking account of patients’ views; (6) implementation of practice guidelines; (7) promoting motivation, accountability and evaluation of skills; (8) access to care and (9) coordination of care.
Eight of the nine priority areas were selected in 2003 after a thorough literature review, survey of international initiatives and consensus process among healthcare policy makers, healthcare professionals and consumers. The ninth was added in 2009. After defining healthcare priorities, QIs were identified within each area. Following literature review, 81 QIs were selected, and were then subjected to evaluation by healthcare professionals based on three dimensions: feasibility, importance, coherence with existing initiatives. A two-round Delphi method was used in order to select a first set of QIs to be developed and tested. In 2009, with the inclusion of a new priority area, this list was reviewed. QIs that were deemed to be ‘topped out’, or no longer priority measures, were discarded and new QIs were added. As a result, 42 QIs were selected for retooling and further development.16
Since 2006, 24 QIs developed by COMPAQH have been implemented nationwide (depending on the topic, among the 3000 HCOs, including 1300 acute-care organisations). Of the 24 QIs, 16 are based on PMRs, six on administrative data extracted from a national database, and two are based on an ad hoc survey (table 1).
The 42 QIs developed for nationwide use in France
Ten QIs were discarded because of low acceptance or poor metrological qualities.17 We shall use the results for the first six QIs to illustrate the methodology and the challenges encountered during development and implementation (table 2).
Details of the first 6 QIs in nationwide use in France in acute-care hospitals
Medical record sampling strategy
First, the QIs must be designed; a process that employs the collaboration of healthcare professionals and their representatives, in efforts to ensure face-to-face and content validation among stakeholders. After this stage, sufficient and accurate data need to be obtained for QI measurement. Our data collection method is based on manual data extraction from a random sample of 60–80 PMRs per hospital. The sample size needs to be small to limit workload and contain costs (feasibility). However, it also needs to be large enough to ensure reliability (ie, reproducible results for a fixed set of conditions irrespective of who makes the measurement) and discriminative power (ie, ability to detect overall poor quality and/or variations in quality among hospitals statistically).18 ,19 Discriminative power is crucial in order that public reporting and paying-for-performance mechanisms act as incentives for local quality improvement initiatives. Whenever possible, the same set of PMRs is used to measure several QIs.
QI feasibility, reliability and discriminative power
To ensure method validity, we assessed the metrological qualities of the QIs in a pilot test on 50 to more than 100 hospitals (depending on the QI). Three criteria were taken into account in the selection of hospitals: geographical area, volume of activity and status (teaching, public, private-non-profit and private-for-profit).
Feasibility
Poor data collection can diminish the metrological qualities of QIs. We used a 30-item standard grid to assess five dimensions of feasibility (acceptability, workload, understanding of QI implementation, professional involvement and organisational capacity including IT systems) in the pilot test.20–22 The grid was assessed in each pilot hospital by the health professional in charge of the data collection. In general, for each feasibility dimension, the total number of problems encountered was calculated. We considered a ‘no feasibility’ issue as under 5% of problems, ‘middle feasibility’ issue between 5% and 10% of problems, and a ‘feasibility’ issue up to 10% of problems. The feasibility problems encountered were then discussed in an expert panel before validating the content of each QI. In the pilot test, the highest incidence of feasibility problems was encountered with the acute myocardial infarction (AMI)-related QI (11% vs 4.9% for ‘quality and content of anaesthetic records’, and 3.2% or less for the other QIs). The dimension concerned was ‘professional involvement’. Originally, it was stipulated that a health professional of the specialty (eg, a cardiologist) must be involved in the data collection process, but during the pilot test, it was difficult to achieve this aim for all hospitals. The average time spent on data collection was 8.5 days per hospital for the five QIs related to medical or anaesthetic record content, and 5 days for AMI QIs (including sample of the medical records, retrieval from archives, abstraction of the sample, data entry in the computer and verification of data quality). As a result, a national generalisation committee was created, which meets each year, and whose discussions include difficulties, including feasibility, encountered by hospitals during generalisation. Currently, no intrinsic limitation of feasibility has been reported for this or any other QI during nationwide generalisation.23
Reliability
Interobserver reliability is essential for standardised manual data collection. The reliability of our method was tested by double-data capture of 20 PMRs by two independent observers in 10 hospitals. Observer agreement, as given by the Kappa coefficient, was in the range 0.80–0.96 for each QI.
Discriminative power
A QI should be able to detect room for improvement in clinical care. We routinely perform two tests: (1) the QI results obtained are first tested using Student's t test or Wilcoxon signed-rank test against an optimal threshold (100%). If the difference is significant (at 0.05%), the mean QI is below the desired threshold and (2) the dispersion of QI values among hospitals is tested using the Gini coefficient. This coefficient is a measure of statistical dispersion that is commonly used in economics to describe inequalities across groups.24 ,25 It is a ratio ranging from zero (maximum dispersion) to 1 (no dispersion).
Table 3 gives the mean overall scores for each QI in our pilot study. Scores for all QIs varied widely across hospitals (Gini coefficient<0.5) except for ‘order of a lipid test’ (AMI 4.2 in table 3). This QI had a mean score (6.9%) far below the theoretical threshold of 100% (p<0.001). For each QI, performance (mean overall score) was significantly lower than the optimal threshold of 100% (p<0.001). Taken together, these results provide evidence for good discriminative power.
Results for the 6 QIs during pilot testing
Hospital ranking
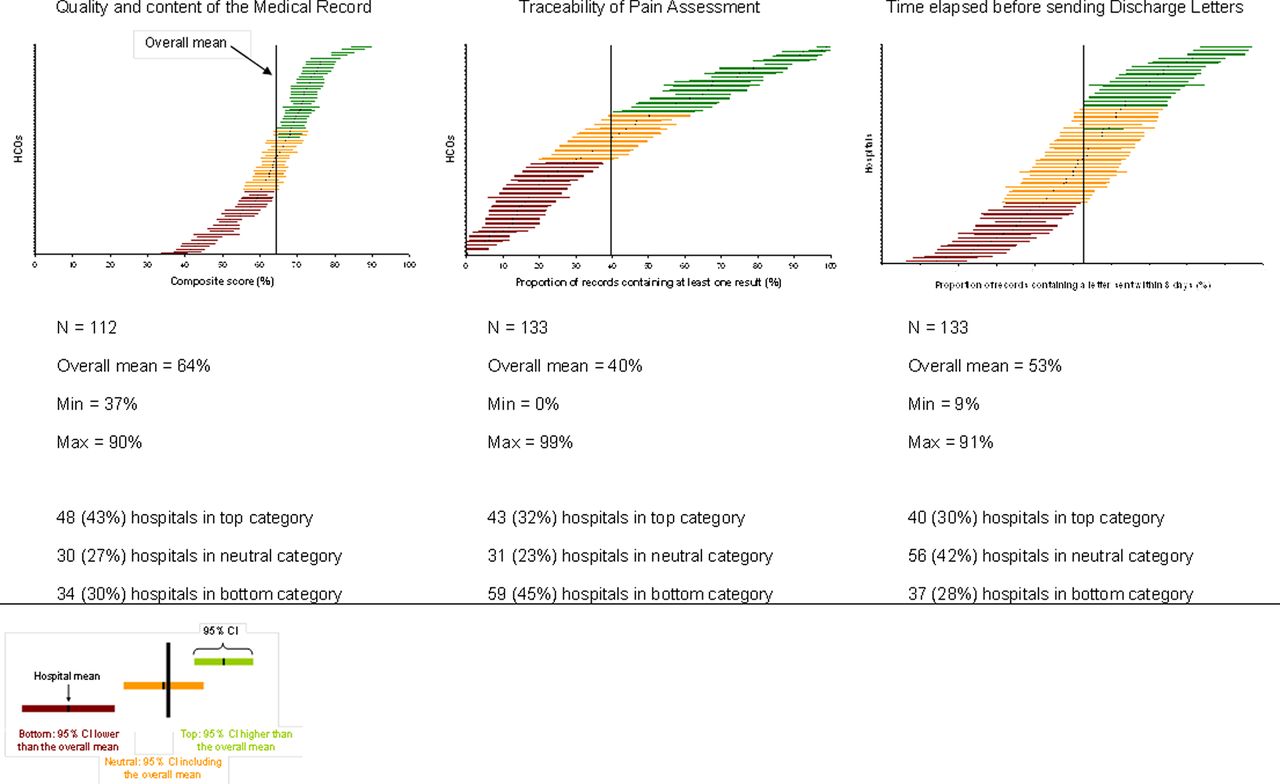
Our QI scores are computed together with their uncertainty, that is, the 95% CI around the mean score. The CI is estimated using the ‘Central limit theorem’ which assumes normal distribution of scores for item numbers above 30. The CI thus depends on the number of PMRs. Because of this, hospitals were ranked according to the Hospital Report Research Collaborative method into three categories (top, neutral, bottom) on the basis of the overall mean for all hospitals, and the 95% CI calculated for a normal distribution.26 Hospitals with fewer than 30 PMRs were excluded. Hospital distribution into the three categories was similar during the pilot test and after nationwide QI generalisation, except for 2 QIs, namely, ‘time elapsed since sending discharge letters’ and ‘screening for nutritional disorders’ (p<0.001) The difference was in favour of the pilot test (figure 1).
Variability in score for ‘quality and content of the medical record’, ‘traceability of pain assessment’ and ‘time elapsed before sending discharge letters’ during pilot testing. The horizontal line gives the mean score for each hospital (with 95% CI). The vertical line represents the overall mean score for all hospitals. The number and percentage of hospitals in each ranking category are given.
Discussion
We propose a method for developing QIs for nationwide hospital comparisons based on manual data extraction from PMRs. Our key concern is reducing the workload as far as possible without detracting from the validity of the statistical comparisons among hospitals. We achieved this by selecting the smallest PMR sample (60–80) that can discriminate among hospitals, by using the same set of PMRs to measure several QIs whenever possible, and by discarding QIs that had shown poor metrological qualities in a low-cost pilot test of feasibility, reliability and discriminative power.
Strengths of the method
Our method was adopted in France in 2006, and has led to the nationwide implementation of an increasing number of QIs. Public reporting of 1200 acute-care hospitals based on these QIs has been available since 2008 on the website of the French Ministry of Health.15 The method has three strengths: (1) the close collaboration of health professionals and their representatives in QI development, from the QI design and definition stage to feasibility testing, auditing and validation of any changes made, facilitates QI acceptability, appropriation of audit results and the introduction of quality improvement initiatives; (2) feasibility, reliability and discriminative power were assessed in a low-cost pilot test, which means that each year a new set of QIs can be prepared for generalisation and (3) QIs yielding poor results could be discarded before generalisation.
Limitations
Our study has limitations. The preset PMR sample size, regardless of the hospital's volume of activity, might introduce a bias. The bias and likelihood of an erroneous classification were limited by combining two approaches: (1) by introducing uncertainty (Van Dishoeck et al recently showed how, depending upon the method used, account can be taken of uncertainty27) and (2) by comparing three categories of hospitals rather than individual hospitals. A second limitation concerns the quality of the data in the PMR sample. Some gaming behaviour and some observer-dependent variability may persist in the data collection process. An ex-post control could be carried out in a sample of hospitals to address this limitation. A third limitation is the fact that this methodology can be time consuming, which limits the number of QIs nationally introduced each year. In order to mitigate this effect, we developed some specific strategies, such as having common collected data for multiple QIs, and a small sample of PMRs required per QI.
Its role in the context of development of EMR system
The above method is a powerful means of implementing an authoritative and valid national QI system, in both developed and developing countries, before EMRs become the norm. As attempts to adopt EMRs have faced several barriers, EMR introduction and adoption at a national level may well take longer than expected.12 In addition, the quality of the data that can be systematically extracted automatically is limited by both technical (IT system compatibility in hospitals) and ethical (confidentiality of information) obstacles to even partial EMR systems.28 Without hampering the development of EMRs and the meaningful use of health information technology, our PMR-based method represents a pragmatic alternative. Importantly, this method may be used in countries with complete paper records, as well as countries with mixed paper and electronic records. We recognise that even in nations with relatively high EMR adoption, often hospitals use both electronic and paper records. This methodology can be applied to the manual extraction of data from EMRs as needed, and act as a bridge to measuring quality in hospitals on a national level pending complete adoption of electronic systems. It is particularly well suited to practice guidelines, organisational issues related to the standardisation of work rules and coordination, and could also be used to assess the quality of patient care pathways.29
Acknowledgments
We thank members of the COMPAQH team and the hospital representatives who took part in the project. We thank HAS for use of their database. Further details are available on the COMPAQH and HAS websites (http://www.compaqh.fr; http://www.has-sante.fr). The COMPAQH project is supported by the French Ministry of Health and the French National Authority for Health (HAS).
References
Footnotes
-
Contributors MC has made substantial contribution to design of the manuscript, has been involved in the drafting and was responsible for the interpretation and statistical analysis of the data. HL and GN were involved in the drafting of the manuscript and brought important intellectual content. LM, CS and FC critically revised the manuscript. EM was involved in the conception and drafting of the manuscript, and has given final approval of the version to be published. All authors read and approved the final manuscript.
-
Funding This work was supported by the French High Authority of Health and the French Ministry of Health.
-
Competing interests None.
-
Provenance and peer review Not commissioned; externally peer reviewed.
-
Open Access This is an Open Access article distributed in accordance with the Creative Commons Attribution Non Commercial (CC BY-NC 3.0) license, which permits others to distribute, remix, adapt, build upon this work non-commercially, and license their derivative works on different terms, provided the original work is properly cited and the use is non-commercial. See: http://creativecommons.org/licenses/by-nc/3.0/