Article Text

Abstract
Background Twitter is increasingly being used by patients to comment on their experience of healthcare. This may provide information for understanding the quality of healthcare providers and improving services.
Objective To examine whether tweets sent to hospitals in the English National Health Service contain information about quality of care. To compare sentiment on Twitter about hospitals with established survey measures of patient experience and standardised mortality rates.
Design A mixed methods study including a quantitative analysis of all 198 499 tweets sent to English hospitals over a year and a qualitative directed content analysis of 1000 random tweets. Twitter sentiment and conventional quality metrics were compared using Spearman's rank correlation coefficient.
Key results 11% of tweets to hospitals contained information about care quality, with the most frequent topic being patient experience (8%). Comments on effectiveness or safety of care were present, but less common (3%). 77% of tweets about care quality were positive in tone. Other topics mentioned in tweets included messages of support to patients, fundraising activity, self-promotion and dissemination of health information. No associations were observed between Twitter sentiment and conventional quality metrics.
Conclusions Only a small proportion of tweets directed at hospitals discuss quality of care and there was no clear relationship between Twitter sentiment and other measures of quality, potentially limiting Twitter as a medium for quality monitoring. However, tweets did contain information useful to target quality improvement activity. Recent enthusiasm by policy makers to use social media as a quality monitoring and improvement tool needs to be carefully considered and subjected to formal evaluation.
- Quality Measurement
- Patient Satisfaction
- Health Services Research
This is an Open Access article distributed in accordance with the Creative Commons Attribution Non Commercial (CC BY-NC 3.0) license, which permits others to distribute, remix, adapt, build upon this work non-commercially, and license their derivative works on different terms, provided the original work is properly cited and the use is non-commercial. See: http://creativecommons.org/licenses/by-nc/3.0/
Statistics from Altmetric.com
Introduction
Twitter is a prominent social media platform with more than 500 million user accounts globally and 350 million messages sent each day.1–3 Research has sought to draw meaningful quantitative signals from tweets, including trying to predict the next hit record,4 election results5 and the price of the stock market.6 The potential application of Twitter to health issues appears to be expanding. For example, analyses of tweets have been used to detect patterns of disease, detecting and mapping outbreaks of influenza, cholera and food poisoning.7–9
It is likely that patients are tweeting about their experiences of healthcare. It has been suggested that it might be possible to use patient's descriptions of their care on Twitter and other social media to monitor the quality of healthcare providers.10 The UK Department of Health's Information Strategy suggests the use of social media aggregation and sentiment analysis to provide a rapid indicator of hospital performance and early warnings of poor care.11 National Health Service (NHS) England recently started aggregating and publishing social media sentiment about the NHS on a public website.12 However, while people have studied what healthcare organisations and physicians are saying on Twitter,13 ,14 and examined tweets on specific health issues,15–17 we are not aware of any study that has systematically measured tweets sent to healthcare providers, to determine the extent to which tweets relate to quality of care provided and whether they can inform quality improvement activities.
This study aims to describe the frequency of tweets directed at acute NHS hospitals in England, and examines their content to see what proportion of tweets are related to care quality and what aspects of care people tweet about. We also compare tweet sentiment at the hospital level, using an automated sentiment analysis technique, with survey measures of patient experience and risk adjusted mortality rates to see if there is any relationship between commentary on Twitter and more traditional measures of care quality.
Methods
Identification and collection of tweets
We prospectively collected tweets aimed at NHS hospitals from the Twitter streaming application-programming interface (API) for a year. We identified tweets aimed at NHS hospitals by using ‘mentions’, where a tweet includes the ‘@username’ of a Twitter user. This is normal behaviour on Twitter for deliberately including someone in a conversation. In order to identify which NHS hospital organisations were on Twitter (and had @usernames), we took the complete list of hospital organisations (known as trusts in England) from the NHS Health and Social Care Information Centre. For each trust, a researcher searched their main web page, their contact information online and for the name of the trust on the Twitter website. In April 2012, we identified 75 (of 166) acute trusts as being on Twitter. Data collection for all tweets mentioning these trusts began in May 2012. Over the period there were occasional outages due to technical reasons, including changes to Twitter's API and server failures, so 64 extra days were added to ensure a 365-day collection period in total.
In order to compare the characteristics of hospitals on Twitter with other hospitals not using the platform, we collected data on hospital bed number,18 total admission rates19 and metrics of performance from NHS England and the Health and Social Care Information Centre. The performance measures used were risk adjusted mortality rate (Summary Hospital Level Morality Indicator 2012–201320) and patient experience (overall rating of satisfaction from the NHS inpatient survey 201221). Comparison between the two groups was done with a two-sided t test.
Measuring volume and frequency of tweets
We performed a simple descriptive analysis of the total set of tweets collected. This included measuring the frequency of tweets by day, and by hour of the day, and by hospital trust to see if there were observable patterns of activity.
Qualitative content analysis
We used directed qualitative content analysis22 ,23 to examine the main themes discussed in tweets mentioning hospitals. A ‘directed’ approach to content analysis makes use of previous theory to consider and identify themes.24 We used the initial theory that tweets about care quality could be divided into the component parts in the NHS quality definition: patient experience, effectiveness and safety.25 In order to develop a thematic codebook, two researchers analysed a sample of 250 random tweets, coding them thematically. A codebook was developed by iterative discussion between the reviewers. We added additional codes to reflect a number of further topics discovered. We also rated each tweet for sentiment, being positive, negative or neutral in overall tone. After final development of the codebook, κ scores for sentiment and the primary theme coding were calculated between the first and the second reviewer for the 250 jointly coded tweets. Once the codebook had been defined, it was then used to code a further 750 random tweets (by one reviewer). No further themes emerged in the subsequent analysis of the remaining group, suggesting saturation of themes had been reached.24
Automated sentiment analysis and comparison with survey data
We performed sentiment analysis of the complete set of collected tweets using commercially available software from TheySay Ltd (Oxford, UK), to produce an overall sentiment score for each tweet of positive, negative or neutral. The underlying sentiment classification method used is based on compositional sentiment parsing, described in previous work by Moilanen and Pulman,26 which emulates human sentiment logic and affective common sense reasoning. The method relies on part-of-speech tagging, shallow chunk parsing, dependency parsing, large hand-labelled compositional sentiment lexica, and a comprehensive sentiment grammar with a large set of recursive compositional sentiment logic and propagation rules.
We calculated the average sentiment of tweets per trust, expressed as a proportion of positive tweets compared with the total number of tweets. We compared Twitter sentiment score with the results of the National Inpatient Survey for 2012, obtained from the UK data service, using the overall rating of experience question from the survey (on a scale of 1–10),21 and the Summary Hospital Mortality Index for April 2012 to March 2013—a risk adjusted mortality figure from the Health And Social Care Information Centre.20 Children's hospitals and specialist (obstetric, cancer and orthopaedic) hospitals were excluded from the comparative part of the analysis because of the different nature of patients they serve. Comparison between sentiment and both quality metrics was performed using Spearman's rank correlation coefficient. Analysis was conducted with Stata SE software.
Results
Characteristics of hospital trusts on twitter
No significant difference was observed between hospitals that were on Twitter and those that were not, according to the four characteristics measured (table 1).
Characteristics of hospital trusts on Twitter
Descriptive analysis of tweet volume and frequency
We collected 198 499 tweets from 17 April 2012 to 26 June 2013. The mean number of tweets per trust with a Twitter account was 2647 and the median was 796. The range was 0–88 169 per trust. The distribution is shown in figure 1. There were three large outliers, two specialist children's hospitals with 88 169 and 19 085 tweets each and a specialist cancer hospital with 15 017 tweets. One trust received no tweets.
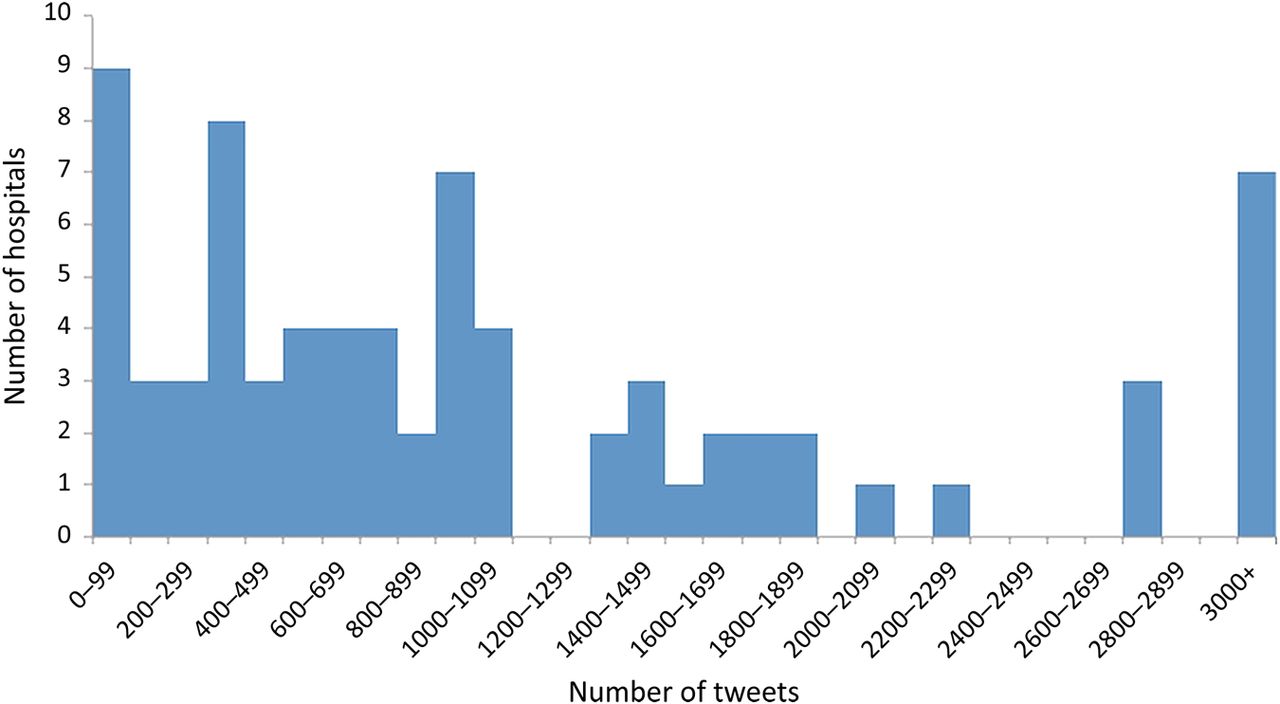
Number of tweets per hospital.
The mean number of tweets about all hospitals was 508 per day and the median was 405 (range 62–3601). The number of tweets varied with time of day, with peaks in activity at 10:30, 14:00, 17:50 and 21:30, and a lull overnight.
Content analysis
We identified six key themes from the tweets examined: (1) quality (2) fundraising activities, (3) health information, (4) organisational or practical information about the hospital, (5) promotional messages and (6) messages to patients receiving care. Within these themes, some were divided into further categories. The final codebook, and the frequency of the codes, is shown in table 1. The inter-rater reliability for the main theme level between the two human raters for each tweet was 86.0% agreement, κ 0.82 (p<0.001). Each tweet could be assigned more than one theme (although in practice due to their brevity, this was rare). Of the 1000 tweets, 47% were positive, 47% were neutral and 6% were negative. Inter-rater reliability for sentiment between human raters was an 84% agreement, κ 0.76 (p<0.001). Examples of each code are shown in table 2.
Codebook of tweet classification including frequency of occurrence and sentiment (from 1000 random tweets)
Tweets about care quality
Tweets about care quality accounted for 11% of those examined. We found the existing approach to describing quality in the NHS—dividing it into patient experience, effectiveness and safety—was feasible for classifying these tweets. Tweets were not distributed evenly between these different classifications—87% of tweets about quality mentioned patient experience, 26% perceived effectiveness and 4% safety. For all tweets related to quality 77% were positive, 21% were negative and 2% were neutral.
Patient experience
The most common topic discussed in tweets about quality was the patient's subjective experience of care. These tweets could often be further broken down into (1) interaction with staff, (2) the environment and facilities within the hospital, and (3) issues of access and timeliness of services.
Fifty per cent of tweets about quality related to staff and how they interacted with patients. Many tweets referred to specific wards, teams and named individuals.
At the [@named hospital] just had an operation on me foot. Outstanding care as usual, & the nurse has just made me a cracking cup of tea :-)
[@named hospital] Want to say thanks to [named clinicians] in resus. Were superb in their care overnight of my mum in law.so compassionate x
There were examples of negative comments, but these were rare.
[@named hospital] [named ward] - Disgusted with your treatment of my mother. Will be making huge complaints.
Ten per cent of the quality related tweets were about facilities. These were relatively balanced, some full of praise for the standards of hospital accommodation, but some negative and occasionally combative. Cleanliness was a topic that came up more frequently.
Be nice if this room had been cleaned before we got it. Blood filled cap from an iv on the bedside cabinet, unflushed toilet [@named hospital]
Spent a night in [named hospital] with my son. Excellent care - spotlessly clean. Thank you [@named hospital]
People also spoke about practical issues of access such as parking.
[@named hospital] Ridiculously difficult to park today anyway near physio dept. People are using drop off and double parking in the disabled
Tweets about food were present. Again people were willing to praise and criticise.
Don't suppose there is any chance of full english [@namedhospital] Been here since 3 yesterday no hot food or drink #poor
Back from another stay [@namedhospital] and have to agree generally the food is excellent - very impressed
The real time nature of Twitter allowed people to make comments about access, often while they were waiting for treatment. Again, these revealed positive and negative experiences, and accounted for 12% of tweets about quality.
[@named hospital] Thanks for squeezing me in with orthoptist [named clinician] today. Great service just so sad that waiting list for [named surgeon] so long :-(
Waiting at [@named hospital]- appointment was over 2 hours ago. can we get takeout delivered??
Effectiveness
Some tweets described perceived effectiveness of care. These usually made an explicit comment about whether a diagnosis was made, whether a treatment worked or not, or some aspect of the technical performance of the hospital in the process of provided care.
My dad home from hospital. Good care [@named hospital]. Community Matron will ensure transition to home is effective. Makes me very happy!
My nan had great care from [@namedhospital] but took a year and several GPs to take notice of her symptoms, despite nhs campaign
Horrific exp [@named hospital].. Nurse had no respect for me, didn't speak to me & I 'm discharged home with the same thing i came in with!!
Safety
Tweets that related to safety were less common, often referring to perceived medical error. All were negative. However, they did contain potentially useful information about perceived error for an organisation seeking to improve care.
[@named hospital]Yes pls. Main concern now is the doctor overprescribing. We worked out the error but vulnerable patient might not
[@named hospital] Also looking at a scan from 2010 when u didn't get scanned until 2011 not good, wrong person, terrible, disgusting
Other themes found in the qualitative analysis
Fundraising
The most common use of Twitter related to NHS hospitals in our study were fundraising and charitable activities, accounting for more than a third (39%) of all tweets. This included people describing their experiences of charitable activity, supporting others and advertising fundraising events. The majority of these tweets had a positive sentiment.
Looking forward to running the Royal Parks Half Marathon for [@named hospital] this wknd
Promotion/advertising
There were examples of people using Twitter for self-promotion (accounting for 9% of tweets), of themselves, their colleagues and organisations.
[@named hospital] Named One Of The UK's 40 Top Hospitals for the Fifth Year Running [weblink]
Health information
There were occasional examples of people seeking medical guidance, and of health advice being provided (4.4% of tweets). We did not observe specific medical information being provided for individuals, instead the guidance tended to be generic health promotion advice that might be relevant for the public.
The sun has its hat on but have You? Remembering sun rules has to be better than a visit to [@named hospital] ED..ouch! [weblink]
Organisational information
There were also examples of tweeting functional information about health services, to keep patients up to date about the health services—accounting for 7% of tweets. Within the organisational information, there were examples of hospitals keeping their patients up to date about their services and community activities. These were often tweets by hospital staff, or retweets of hospital tweets.
RT[@named hospital]: Most outpatient clinics running today We'll be reviewing afternoon clinics & if any cancelled, we'll contact patients
Support for patients
Some tweets (11%) were simple messages of support for patients in hospital. These were often personal, individual messages. Some were large organised campaigns that had grown virally and contained numerous retweets with celebrity endorsements.
He will remain in the ITU [@named hospital] he's very poorly but he's a little fighter #staypositive #thankyou
No theme
A proportion of the tweets (20.8%) contained no identifiable theme. This is because Twitter messages are short and often part of longer conversations that cannot be understood out of context.
Multimedia approach
People were creative in how they used Twitter messages—there were examples of people including other media in their tweets. Twitter allows users to embed images and videos—and some patients used this approach, particularly when talking about facilities. For example, a concerned mother tweeted about the food that had been given to her young son—accompanied by photo (figure 2):
[@named hospital] Cannot believe I have been served this for my 18 month old. Tastes disgusting and hardly nutritional! [link to photo]
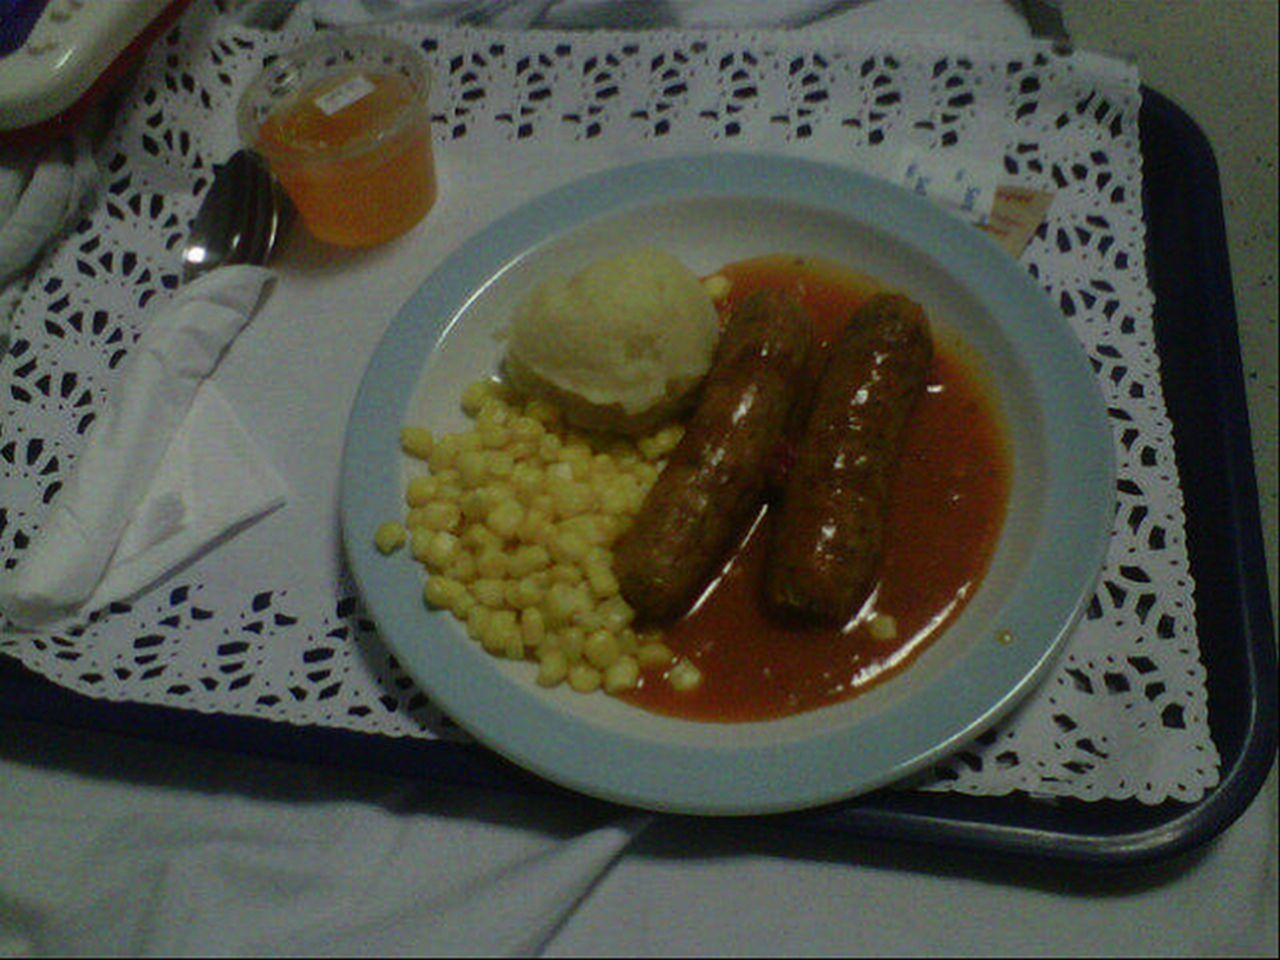
Example of a tweeted picture.
Celebrity endorsement
Many of the tweets contained references to celebrities, either seeking their support, or describing when a celebrity took part in fundraising activity. For example in this analysis, we found that over 20 000 tweets referred to Piers Morgan (@piersmorgan)—a television presenter—because of his prolific fundraising for children's hospitals. On each of the 4 days when there more than 3000 tweets, this was driven by multiple retweets of a celebrity's activity. The most frequently shared message in our sample (retweeted 3489 times), related to Piers Morgan after losing a bet, and making a donation to support a hospital.
RT @Piersmorgan: Most painful tweet of my life: well done [named individual] - I am sending a cheque to [@named hospital] for 10k today.
Unmoderated comments
One of the peculiarities of comments left on Twitter when compared with physician or hospital rating websites is that there is no moderation. The consequences can be seen in some of the comments left. Many of the comments refer directly to staff members—with good and bad comments aimed at particular individuals. People are willing to be direct, sometimes even rude:
[@named hospital] [Named chief executive] should come down onto the wards n see what's really going on under her nose. I wish my nan was in [another hospital]
[@named hospital] Shit on floor wet sheets, visitors having to change bedding, shit in toilet, ignorant staff- [name ward]!! Stay away!
Associations with conventional quality metrics
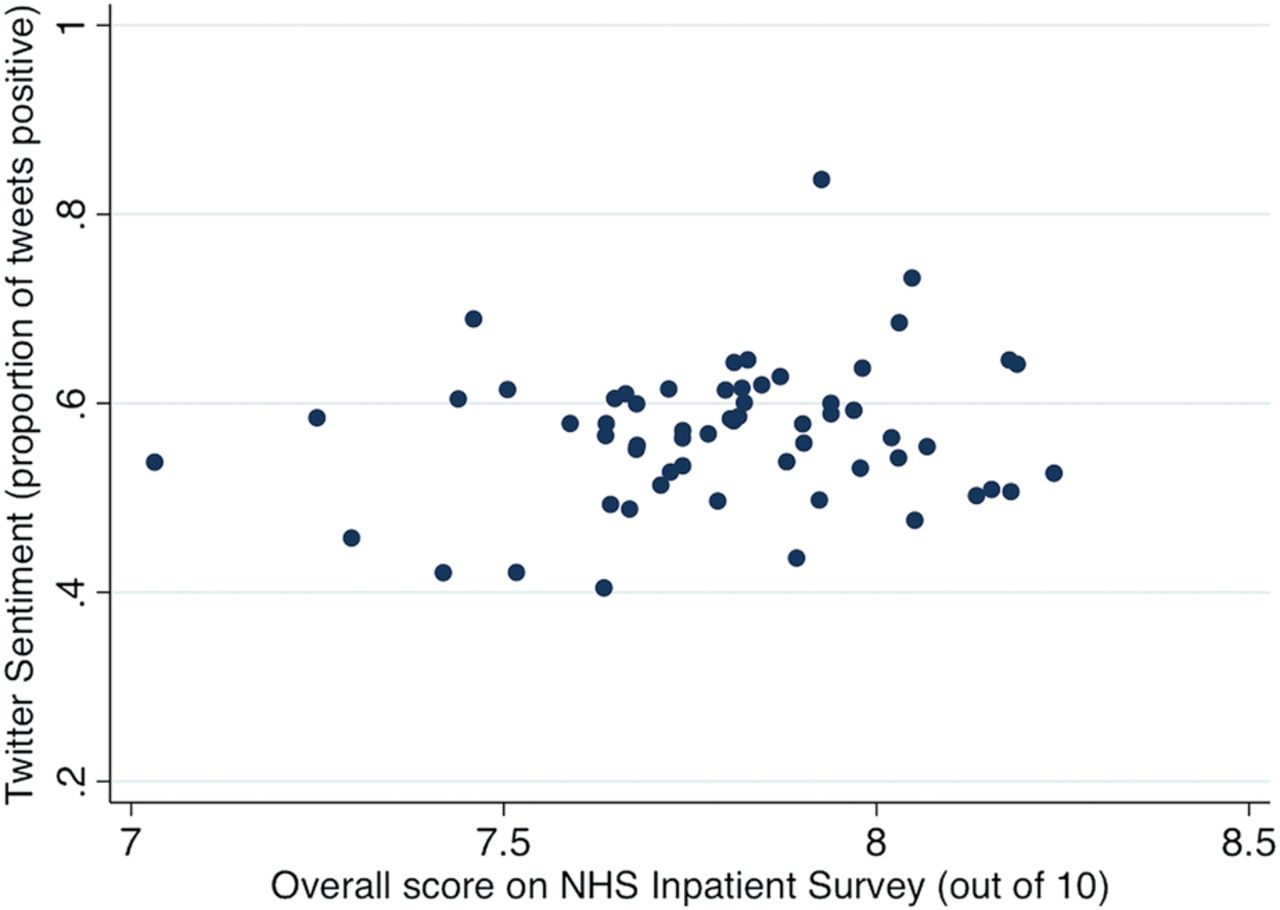
The Spearman rank correlation coefficient between the overall patient experience score from the NHS inpatient survey and the automated Twitter sentiment analysis score was 0.14 (p=0.30), demonstrating no significant association (figure 3). The equivalent correlation coefficient between automated Twitter sentiment and mortality was 0.15 (p=0.24). The agreement between manually rated sentiment and automated sentiment analysis was 71% (for classification as positive, negative or neutral). This represents a κ statistic of 0.39 (p<0.001).

Trust level association between Twitter sentiment and the National Health Service (NHS) patient survey.
Discussion
These results show that people talk about their experiences of hospitals and care quality on Twitter. However, tweets that describe care are in the minority (11%), and a wide variety of other topics are being discussed as well. When patients tweet about care, they discuss many of its aspects—particularly their experiences of staff, facilities and processes of care, and most of the experiences described are positive. Tweets contained information that could be useful for monitoring performance of hospitals, and fostering an improved dialogue between hospitals and their patients.
While no other studies have looked at tweets aimed at hospitals, Lagu and colleagues analysed the comments about care left on review websites.27 They also found that the most common topic was interaction with staff (in 90% of comments). However, in these longer reviews, comments about technical aspects of care were also common (in 62% of comments), and 26% identified perceived medical errors. These aspects were discussed much less on Twitter, where only 4% identified safety issues—possibly a result of the enforced brevity of Twitter messages.
No associations were observed here when comparing Twitter data to conventional metrics of clinical quality such as patient experience and mortality. Previously associations have been demonstrated between reviews of care on internet healthcare rating sites and such measures.28–32 These data demonstrate the frailty of social media as a source of comparable information on care quality. Promotional tweets look similar to praise from the public—speaking about the hospital in a positive tone—but represent a biased view, less useful for monitoring performance. Similarly, the frequency with which celebrities are mentioned, and the autocatalytic effect they had to create spikes of viral activity, may have skewed the results. In addition, the real-time nature of Twitter may result in patients describing their experiences in a more direct, emotional way than is captured by other patient experience measures.
While Twitter has been demonstrated to be a useful tool for signal detection in fields as varied as political polling and disease detection, in this case the ability of social media to act as a monitoring tool for poor quality is limited by the signal to noise ratio. Interference from other clinically irrelevant topics may have crowded out those useful comments about care quality. In addition, the automated sentiment analysis process was not as accurate as the manual approach, which may have limited the ability to detect appropriate signals.
Despite the lack of association with other measures of quality, this work suggests that social media may provide a new and complimentary way to understand patient experience. The recent Francis Inquiry33 and Berwick Report34 highlighted the need for improved ways to channel the voice of the patient to those providing and organising services in the NHS. Although there are limitations to this approach, paying attention to the views of patients via social media adds to a wide collection of other information sources such as surveys, complaints and adverse incident reporting through which a hospital organisation can understand the quality and safety of the care it provides. In addition, if the public is aware that health services are monitoring this channel, they may become more likely to leave comments about their experiences of care.
Strengths and limitations
With a comparatively new technical approach and data source, there are limitations. We are uncertain about the completeness of the information from the Twitter API as there may be filtering methods in place that we are not aware of. Also, there are demonstrable biases in the people who use Twitter. Its usage has been shown to be larger in younger groups and minority ethnic populations.35 However, these groups have often been hard to engage in other participatory healthcare activity, so this might represent an opportunity for wider population engagement with healthcare services.
The study may also have missed many important conversations. Our analysis is limited to situations where people deliberately targeted messages at hospitals. Many people discussing their experiences using social networks might not do this. People might also be concerned about risk of censure if they make critical comments, and may not identify specific hospitals in these tweets. In addition, people may refer to hospitals by their informal or local names, rather than the formal names, which we would not detect. Twitter enables people to have conversations, but we looked only at messages sent one way—to the hospitals. A more wide-reaching study might attempt to look at the nature of the interaction across multipart conversations.
Strengths of this study include the prospective nature of the data collection and the attempt to gather data over a prolonged period of time for all the trusts on Twitter at a national level. The relatively high κ coefficients for inter-rater reliability for thematic and sentiment measurement provide some reassurance about the qualitative analysis approach we employed. The similarity of hospitals using Twitter compared with those who were not using it (at least according to the four characteristics we measured) is reassuring, in that we were not measuring an unrepresentative group of hospitals.
Policy implications
The NHS in England has suggested it might be possible to detect institutional poor performance via social media and has taken steps to publicly report social media content. Our findings suggest caution should be taken in adopting this approach. Although social media may not provide a reliable comparable source of information for patients to choose between providers, it may provide useful information for providers to understand areas of weak performance and highlight areas to target internal improvement activity. It may also provide a mechanism for positive feedback to staff and to demonstrate what hospitals are doing well. The findings suggest that hospitals should at least be listening to patient views on social media, and acting on concerns raised. The volume of tweets sent to hospitals, almost 200 000 in a year, shows that there is a substantial body of information to be listened to. For the median hospital, this represents two to three tweets a day—which is feasible to monitor and respond to. In addition, social media represents a further possible source of information for health system regulators.
Further research
Our findings show that while sentiment analysis of tweets is possible, the task of correctly processing information to measure care quality is difficult. Further research is needed to develop improved collection techniques (to capture more of the messages about care) and better filtering techniques (to sort those relevant to quality from those that are not). In addition, work should evaluate the value of social media descriptions of patient experience as a stimulus for driving quality improvement activity. While this study only examined messages sent to hospitals, future research could also explore tweets sent to individual clinicians and regulatory agencies to see whether this might also provide useful information.
Conclusions
Our analysis of Twitter data suggests that there is relevant information about care quality contained within tweets, but it is unrefined and not abundant. While some tweets contain valuable information, it is unstructured, poorly labelled and hidden within a larger set of less relevant information. As such, we need to be cautious in using social media to judge the quality of services. That said, Twitter may provide insights from patients about their experience of care that we do not get from other routes. As social media usage becomes a cultural norm,36 health systems should pay attention to information from this source, and think about how it can be used to improve the standard of care.
Acknowledgments
Imperial College London is grateful for support from the National Institute for Health Research Biomedical Research Centre Funding scheme, the National Institute for Health Research Collaboration for Leadership in Applied Health Research and Care scheme, and the Imperial Centre for Patient Safety and Service Quality.
References
Footnotes
-
Contributors FG had full access to all of the data (including statistical reports and tables) in the study and can take responsibility for the integrity of the data and the accuracy of the data analysis. Study design: FG, DRC and CM. Acquisition of data: FG and DRC. Analysis and interpretation of data: FG, AL, DRC, SP, KM, AD and CM. Drafting of manuscript: FG and CM. Statistical analysis: FG, SP and KM. Critical revision of the manuscript for important intellectual content AL, DRC, SP, KM, AD and CM. Study supervision: AD and CM.
-
Competing interests SP and KM are directors of TheySay Ltd, a company that provides sentiment analysis services. FG is supported by the Commonwealth Fund and the National Institute for Health Research. CM is funded by the Higher Education Funding Council for England and the National Institute for Health Research Collaboration for Leadership in Applied Health Research and Care scheme (CLAHRC) for North West London.
-
Ethics approval This study only used data already in the public domain and therefore ethical approval was not required. Permission was obtained to use the image in figure 2 from its author.
-
Provenance and peer review Not commissioned; externally peer reviewed.
-
Data sharing statement Data may be obtained by writing to the corresponding author.