Article Text

Abstract
Objective To describe the characteristics of sustained improved nutritional outcomes through the use of quality improvement (QI) methodology.
Design Retrospective analysis of a QI intervention in two institutions, implemented as part of larger national collaboratives.
Setting Paediatric cystic fibrosis (CF) programmes in academic centres in Alabama and Illinois.
Participants All paediatric patients enrolled in the CF Foundation (CFF) Patient Data Registry were included.
Interventions Improved and sustained nutrition outcomes occurred through implementation of the CFF practice guidelines for CF nutrition management via care delivery processes, nutritional interventions, team engagement and data display.
Measurement Mean body mass index (BMI) percentile, percentage of patients less than 50th percentile and percentage less than 10th percentile for all patients aged 2–20 years were tracked through run charts and statistical process control charts. Mann–Whitney U and χ2 tests were used to determine significance between each centre and national outcomes.
Results Each centre achieved rapid improvement in mean BMI percentile in patients, one centre rising from the 40th percentile in 2001 to the 49th percentile in 2003, the other rising from the 37th percentile in 2003 to the 45th percentile in 2004. These centres have also maintained improved nutritional outcomes, so that they were at the 60th and 55th percentiles, respectively, in 2011. Sustained improvement was accomplished through QI methodology, use of data as a driver for improvement and a change in culture.
Conclusions Participation in collaboratives led to improved nutrition outcomes while a strong culture of QI facilitated sustained improvement.
- Collaborative, Breakthrough Groups
- Healthcare Quality Improvement
- Paediatrics
- Quality Improvement Methodologies
Statistics from Altmetric.com
- Collaborative, Breakthrough Groups
- Healthcare Quality Improvement
- Paediatrics
- Quality Improvement Methodologies
Introduction
Quality improvement (QI) collaboratives provide a structured process for multidisciplinary teams to identify best practices, apply improvement methods, report results and share information about ways to achieve improvement.1 Collaboratives have been shown to facilitate improvement in the short term.1 In order to accelerate the rate of improvement of care for patients with cystic fibrosis (CF), the CF Foundation (CFF) funded a collaborative through the National Initiative for Children's Healthcare Quality (NICHQ), then developed a series of Learning and Leadership collaboratives (LLCs) to train CF clinicians in improvement science, encouraging QI activities at the individual CF centre level throughout the CFF care network.
CF is a life shortening genetic illness characterised by progressive lung disease and pancreatic insufficiency, leading to poor growth unless treatment is optimised. Achieving acceptable nutritional status, defined as body mass index (BMI) at or above the 50th percentile, is important for effective treatment of individuals with CF and impacts lung health.2 There is a strong association between lung health and nutritional health, with nutritional parameters at age 3 correlating with lung function at age 6, and greater weight at age 4 being associated with fewer complications and improved survival through age 18.3 ,4 Despite the importance of robust nutritional outcomes, in the 2002 CFF Patient Data Registry, the median BMI for patients aged 2–20 years was only at the 44th percentile, with considerable variation between centres.5
There has been a significant acceleration in improvement of CF outcomes since the beginning of the CFF QI initiative.6 Results of specific collaboratives in other populations of patients with conditions other than CF have led to improvement.7 However, most collaboratives only showed improvement in the short term and there is no significant evidence of long-term benefit.7–9 In most published literature, the median follow-up time for intervention was 1 year, with improvements made from collaboratives diminishing over time.8 ,10 Thus the impact of participation in the collaborative, compared to other changes in patient care over time, cannot be assumed.
The Ann & Robert H. Lurie Children's Hospital of Chicago CF Center (Lurie Children's) and the University of Alabama at Birmingham CF Center/Children's of Alabama (UAB/COA) participated in the NICHQ and an LLC collaborative, respectively, with the goal of improving the nutritional health of paediatric CF patients. At the beginning of participation in different collaboratives, Lurie Children's median BMI was at the 42nd percentile in 2002, while the UAB/COA centre's was at the 37th percentile in 2004, both well below the CFF goal of a median BMI of >50th percentile.2 Each centre chose to participate in CFF sponsored collaboratives to learn QI methodologies to improve nutrition in paediatric CF patients. Here, we describe the elements of our intervention and context that led to sustained improvements in nutritional outcomes.
Methods
At each centre, participation in the CFF Patient Data Registry was approved by institutional review boards at each institution.
Lurie Children's paediatric CF programme currently manages approximately 180 patients. Lurie Children's participated in a collaborative QI initiative, ‘Improving Care for Children with Cystic Fibrosis’, starting in 2002. This project was funded by the CFF and developed through NICHQ using a modified ‘breakthrough collaborative model’. Details on collaborative goals and interventions have been published previously.11The CF centre at UAB/COA is a larger CF centre with approximately 330 patients in the paediatric programme. The centre participated in the CFF funded initiative LLC II in 2004 that used the clinical microsystem framework.12 ,13
Both Lurie Children's and UAB/COA had strong leadership in the CF centre but limited organisational resources and expertise related to QI. QI structure and culture was lacking in each programme prior to involvement in the collaboratives, which served as catalysts for change. This culture of improvement continued to flourish and develop over time. Each centre worked to improve nutritional outcomes through multifaceted interventions. These interventions were organised in four areas: care delivery processes, nutritional interventions, team engagement, and data display. The focus of all interventions was to improve the implementation of the CFF nutrition guidelines.2 ,14
Care process changes
Changes to the processes of care delivery included a standardised clinic worksheet used to document the history and physical parameters as a method of reminding clinicians of the patient data to be assessed and documented. This worksheet was updated to facilitate documentation of nutritional status, including the specific criteria for the 2002 guideline categories of acceptable (BMI equal or greater than the 25th percentile for US children), at risk (BMI percentile at the 10th–25th) and nutritional failure (BMI less than the 10th percentile).14 Care processes were updated to reflect the change in classification in 2008, to: acceptable (BMI equal or greater than the 50th percentile for US children), at risk (BMI percentile at the 10th–49th), and nutritional failure (BMI less than the 10th percentile).2 Once an electronic health record was implemented at each centre, CF clinic ‘templates’ were developed to include the tools previously developed for the paper charts. Process measures were collected for the planned interventions during the collaborative and manually collected at each site over time.
Nutritional interventions
Comprehensive nutritional interventions were implemented. First, an algorithm was developed to assure that appropriate evaluation and follow-up was documented, with increased visit frequency—every 2 months for children who were at risk and monthly for those in nutritional failure. Patients with inadequate nutritional status were encouraged to develop goals and individualised action plans towards improvement of nutritional outcomes. When the CFF Nutrition Consensus Guidelines were updated in 2008, the chart classification categories and algorithm were updated.2
Many specific interventions were included in the algorithms. Each centre adjusted the dosage of the replacement pancreatic enzymes based on the child's symptoms and growth parameters. At each centre, the dietician saw every patient with less than acceptable nutritional status to focus on increasing calorie intake. Assessment of mealtime behaviour was incorporated as a standard assessment. At UAB/COA, the Behavioral Pediatric Feeding Assessment Scale (BPFAS)15 was used to assess behaviour, while at Lurie Children's, the dieticians assessed and counselled about behavioural issues surrounding feeding. Lurie Children's also give parents copies of Ellyn Satter's book, How to get your kid to eat, but not too much.16 Lurie Children's also ensured specific enzyme doses (minimum of 1500 lipase units/kg/meal for all CF patients, and a minimum of 2000 lipase units/kg/meal in patients with less than acceptable nutritional status, not to exceed 2500 lipase units/kg/meal). Each programme increased visit frequency for patients with suboptimal nutrition, and ‘dietician only’ visits were offered. Existence of co-morbidities that impacted nutritional status, such as CF related diabetes was also systematically evaluated. Earlier discussions of gastrostomies for supplemental feedings were held. Lurie Children's found specific success in placement of gastrostomy tubes, through early introduction and extensive education, including G-tube dolls, use of Child life services and both a booklet and video regarding feeding tubes in CF. UAB/COA had more success with behavioural interventions. Specifically, UAB/COA referred patients to a licensed counsellor or a local feeding clinic for further intervention.
Team engagement
Team members were educated about how to accurately measure weight, height and head circumference, and plot them on percentile charts (plotting was no longer necessary after the implementation of an electronic health record). In addition to training, this education was also in the form of a ‘playbook’ containing detailed written instructions on how to measure growth, and images depicting correct methods. All team members were involved; including those whose practice did not traditionally include nutrition evaluation or treatment. Team members were also encouraged to lead some aspect of improvement with mentorship in QI methodology by the team leadership.
Data display/analysis
Data display was an essential tool to promote awareness of the need for change and provide encouragement as improvement was achieved. During participation in the collaborative, there was frequent review of centre process and outcome measures using run charts. Since then, in both CF centres, data are continuously reviewed with the CF care team at both an individual patient level on a weekly basis and as a programme quarterly and annually through the CFF Patient Data Registry Center Specific Data Report.
Both collaboratives assessed success through the following nutritional outcomes for patients aged 2–20 years: (1) mean BMI percentile; (2) percentage of patients with BMI less than the 50th percentile; and (3) percentage of patients with BMI less than the 10th percentile. The goal changed when practice guidelines were updated in 2008: to achieve a BMI of greater than or equal to the 50th percentile.2 Data were extracted from the CFF Patient Data Registry for outcome measures and compared with the national averages from the CFF Patient Data Registry Report. At Lurie Children's numerous data elements were displayed graphically, however our primary goal of >95% of patients having a BMI >25th percentile and >60% of patients having a BMI >50th percentile, were calculated quarterly with a basic graph in Microsoft Excel. UAB/COA similarly used Microsoft Excel to show their median BMI percentile by birth cohort (figure 1).

Example of data display at Lurie Children's and University of Alabama/Children's of Alabama (UAB/COA). Top: Lurie Children's two goals are outlined (grey lines) for both % of patients with body mass index (BMI) ≥25th percentile (goal >95% of patients) and BMI ≥50th percentile (goal >60% of patients) with Lurie Children's programme results (black lines) for each displayed. Bottom: median BMI percentile by birth cohort for the UAB/COA paediatric programme. Each line represents a different 5-year cohort.
The CFF Patient Data Registry is the source of the data documenting absolute and comparative improvement in nutritional outcomes. This registry currently tracks the health outcomes of approximately 23 000 patients in 115 CF centres. The data analysis from the registry includes centre specific data as compared to other centres as well as progress over time for the measure of BMI percentile. For the purpose of this comparison between Lurie Children's and UAB/COA, the registry data were compared at three single points in time as well as continuous data. The time period for the data reviewed was 2002–2012 for children 2–20 years of age. The specific patient outcomes compared included median and mean BMI percentiles, and percentage of patients with a BMI percentile less than the 50th percentile and less than the 10th percentile. Data were compared at three time points: prior to participation in the collaborative (2002 for Lurie Children's and 2003 for UAB/COA), at end of participation in the collaborative (2004 for Lurie Children's and 2005 for UAB/COA), and at the most recent time point (2012 for each programme). At each time point, the mean BMI percentile, median BMI percentile, percentage of patients <50th percentile for BMI and percentage of patients <10th percentile were compared between the individual programme and the national data. For the continuous variable, the data were not normally distributed, so the Mann–Whitney U test was used to determine significance. For categorical values, the χ2 test was used to determine significance between each centre and national outcomes.
Results
Processes
Based on collaborative process goals, Lurie Children's initially achieved nutritional classification for approximately 15% of patients in the first month of the evaluation, however the percentage increased rapidly to a consistent 100% classification by the fifth month of the collaborative. The proportion of visits with a documented evaluation for patients either at risk of nutritional failure or in nutritional failure was 100% at the start of the collaborative, but dropped as low as 50% before rapid improvement back to consistent application with all patients by the seventh month of the collaborative. Lurie Children's also had an increase in use of G-tubes from 11% of patients (18/157) in 2002 to 18% of patients (37/148) in 2011. The UAB/COA centre quickly noted that documentation of growth percentiles occurred in fewer than 40% of the patient encounters. This improved to 90% by the third month of the collaborative and was maintained for the duration of the collaborative.
Clinical outcomes
Demographics
Lurie Children's followed between 97 and 168 patients aged 2–20 during the years 2002–2012, while UAB/COA followed 153–242. Each centre had roughly equal male and female patients in this age group; based on the predefined age range, the median age was around 11 years. As would be expected in CF, the majority of patients were of Caucasian race, with only 4% African American/Black at Lurie Children's and approximately 7% at UAB/COA, and about 2% Asian at Lurie Children's and about 2% other races at UAB/COA. Additionally, as expected, Lurie Children's had about 80–92% of patients on pancreatic enzyme replacement therapy, however UAB/COA has >95% of their patients on pancreatic enzymes. UAB/COA's protocol until 2008 was to start all patients on pancreatic enzymes, including patients with a normal elastase but malabsorptive symptoms. Genetic mutations at each programme were distributed as expected, with approximately 40–50% of patients being homozygous for ΔF508, 35–40% heterozygous for Δ F508 and the remainder having other mutations.
Mean BMI percentile
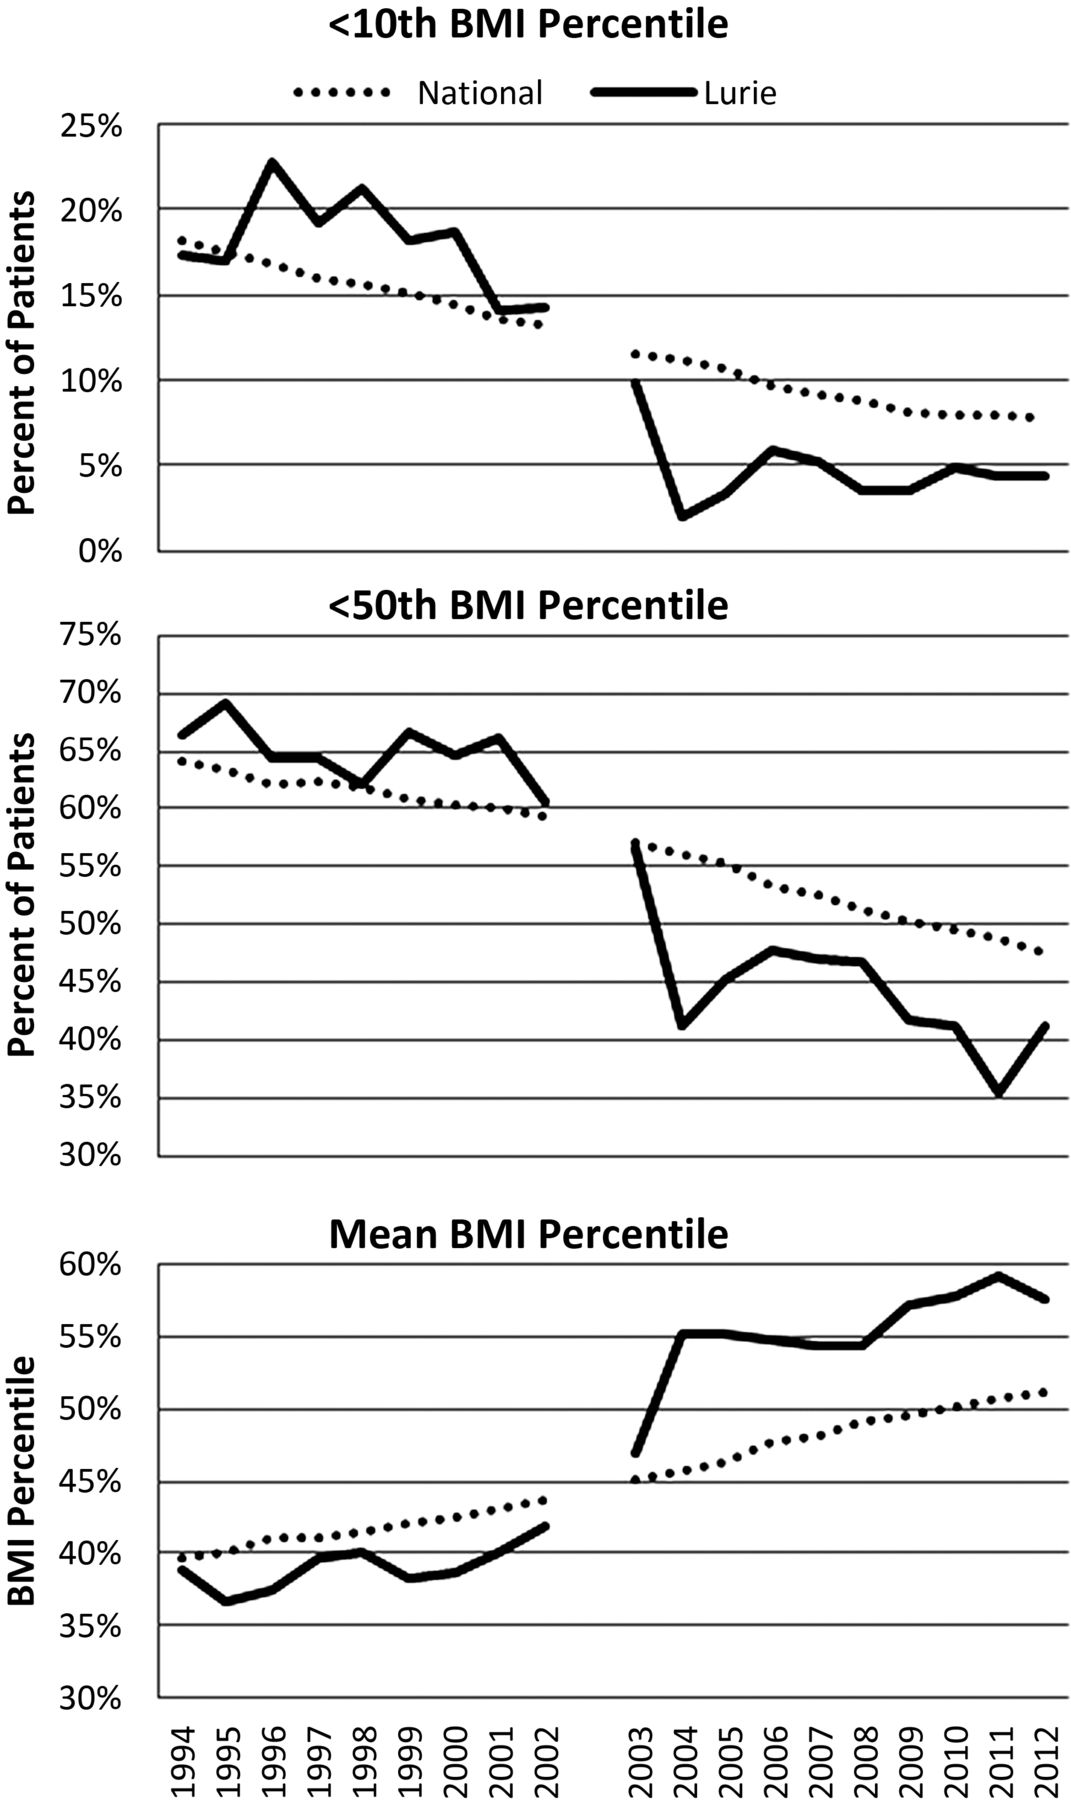
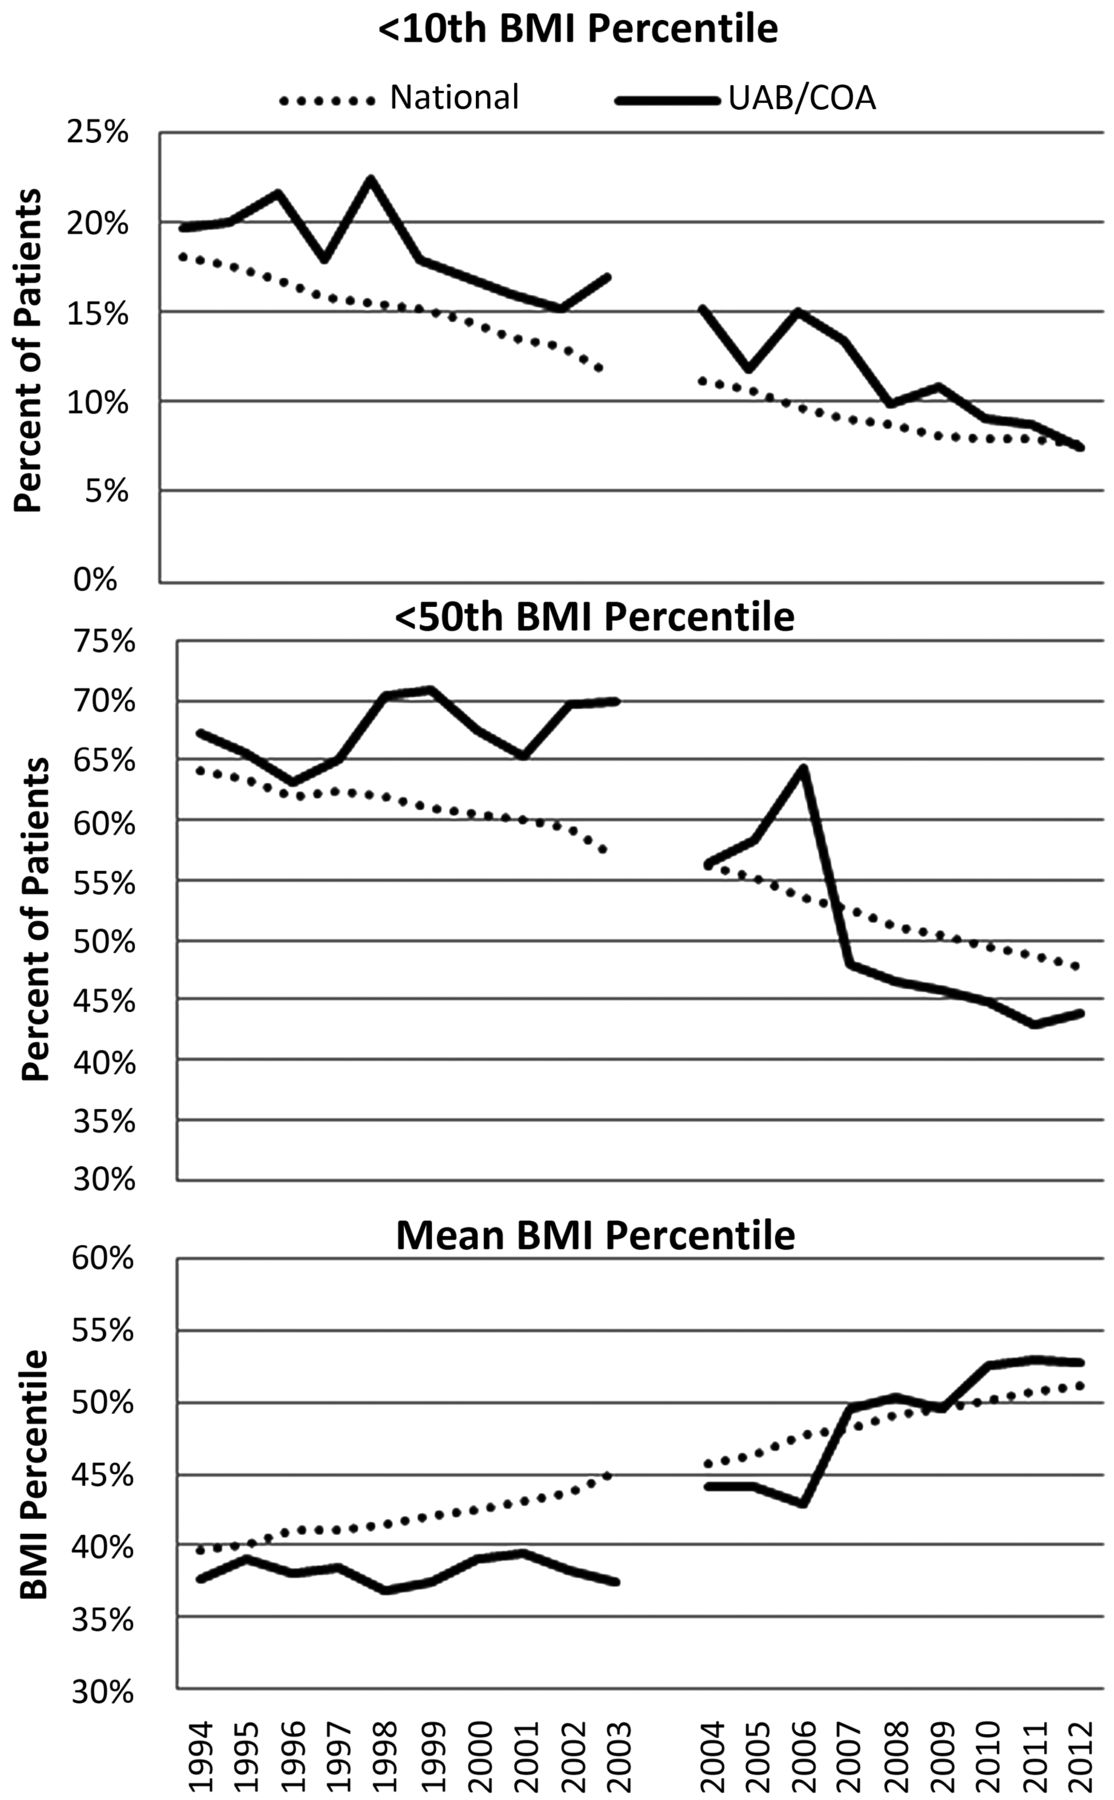
Prior to participation in the collaborative, in 2002 the mean BMI percentile at Lurie Children's in patients aged 2–20 was at the 42.2 (SD±26.8) percentile compared with the 44.3 percentile nationally (SD±27.4) p=0.39), and by the end of the collaborative (2004) was at 54.4 percentile (SD±25.1) compared with the national percentile of 46.2 (SD±27.3) (p=0.0006) (figures 2 and 3). Lurie Children's has been able to maintain a mean BMI above the 50th percentile for 10 years after collaborative initiation (2012), with an unadjusted mean BMI at the 60.4 percentile (SD±26.1), compared with the national 51.5 percentile (SD±26.8) (p=0.003). The mean BMI percentile at UAB/COA increased from the 37.2 percentile (SD±26.6) pre-collaborative (2003) compared to the 45.8 percentile (SD±27.2) nationally (p=0.0003) to the 44.2 percentile (SD±28.4) at the end of the collaborative (2005) compared to the 47.1 percentile nationally (SD±27.2) (p=0.203); improvement was sustained for 9 years after collaborative initiation, reaching the 54.9 percentile (SD±28) (2012) in contrast to the national percentile of 51.5 (SD±26.8) (p=0.303).

Each graph represents years 1994–2012, with the split in the graphs representing approximate time of participation in the collaborative. Comparison is made between patients aged 2–20 years at Lurie Children's Hospital of Chicago (Lurie Children's) (black solid line) and all cystic fibrosis centres (National) (black dotted line). Top: percentage of patients in nutritional failure (body mass index (BMI) <10th percentile). Middle: percentage of patients who did not have acceptable nutritional status (BMI <50th percentile). Bottom: mean BMI.

Each graph represents years 1994–2012, with the split in the graphs representing approximate time of participation in the collaborative. Comparison is made between patients aged 2–20 years, at University of Alabama/Children's of Alabama (UAB/COA) (black solid line) and all cystic fibrosis centres (National) (black dotted line). Top: percentage of patients in nutritional failure (body mass index (BMI) <10th percentile). Middle: percentage of patients who did not have acceptable nutritional status (BMI <50th percentile). Bottom: mean BMI.
Percentage of patients with BMI <50th percentile (at risk nutrition)
At Lurie Children's, the percentage of patients less than the 50th percentile started at 60.3% pre-collaborative (2002) compared with 58.6% nationally (p=0.63) and dropped to 41.2% at the end of the collaborative (2004), compared to 55.4% nationally (p<0.05), and remained low 10 years after collaborative initiation at 40.4% (2012) when compared to 46.5% nationally (p=0.11) (figures 2 and 3). In similar fashion, the percentage of patients at UAB/COA with a BMI percentile of less than the 50th decreased from 70.3% pre-collaborative (2003) compared with 56.2% nationally (p<0.05). At the end of the collaborative (2005) this number dropped to 59% (2005) in contrast to 54.4% nationally (p=0.17). This success has been maintained for 9 years after collaborative initiation (2011) with 41.7% compared with a national rate of 46.5% (2012) (p=0.15).
Percentage of patients with BMI <10th percentile (nutritional failure)
Prior to the collaborative, the percentage of children with a BMI <10th percentile at Lurie Children's was 14.7% (2002) in contrast to a national rate of 12.3% (p=0.33); by the end of the collaborative it had decreased to 2.1% (2004) compared with 10.4% nationally (p<0.05) and remains low 10 years after collaborative initiation at 3.2% (2012) in contrast to a national rate of 6.8% (p=0.06) (figures 2 and 3). This category also showed improvement at UAB/COA, with 17.6% of patients in nutritional failure prior to the collaborative (2003) compared with 10.9% nationally (p<0.05), with a decrease to 12% by the end of the collaborative (2005) compared with a national rate of 9.9% (p=0.37), and with continued decline to 6.5% by 9 years after collaborative initiation (2012), in contrast to 6.8% nationally (p=0.80).
Discussion
After participation in QI collaboratives, our programmes have shown sustained improvement in nutritional outcomes, exceeding the national goal of a mean BMI equal to or greater than the 50th percentile. This is novel because of the long-term, sustained improvement with 10 years or more of ongoing improvement work since initial and time-limited participation in a collaborative. Improvement at each centre was influenced by three major factors: application of QI methodology, the use of data to drive improvement, and a change in the culture within the CF centre teams (box 1).
Factors sustaining improvement in nutritional outcomes
Application of quality improvement methodology
-
The team members who were able to attend the collaborative sessions shared the knowledge and techniques of quality improvement (QI) with the larger cystic fibrosis (CF) team to create a core team with specialised knowledge in not only CF care but also QI.
-
Assistance to team members with ideas for change involved intense education of QI techniques and individual coaching.
-
Educational sessions on QI techniques were held regularly and QI techniques continued to be reviewed with the team.
Use of data as a driver of improvement
-
Patterns of care and patient outcomes were displayed.
-
Continued improvement has been maintained by rapid response to change in both the process and outcome data.
Change in culture
Recruitment of staff to support QI
-
Methods used to sustain improvements included a leadership style that promoted creativity and interdependence as well as empowered team members to make changes within the realm of their discipline.
-
Team development is the cornerstone for all other activities of quality improvement.
-
Every team member was encouraged to lead some aspect of improvement.
Leader as a champion and coach
-
The team leadership mentored team members in the integration of improvement into daily workflow, thereby increasing team engagement and efficiency.
-
The leadership of the centre provided coordination of these improvement efforts in order to provide recognition and leadership opportunities for each team member.
-
The team leadership continued expanding their knowledge in quality and process improvement.
Patient and family involvement
-
This involvement added a different level of accountability.
-
Patients and families continue to be integral to improvement processes through satisfaction surveys, focus groups and as advisors.
-
Transparent sharing of centre outcomes and goals at family meetings.
-
The details of the QI efforts were also shared in several newsletters sent to families, with both English and Spanish language materials shared.
-
At the University of Alabama (UAB) centre a parent advisory group was recruited to assist in improvement ideas.
Managing up
-
Other team development techniques included involvement of hospital administration.
-
At Lurie Children's, the administration was informed of the efforts but did not attend meetings. Outcomes have been presented to several committees of the Hospital Board of Directors.
-
At UAB/Children's of Alabama, hospital administration was involved through recruiting the medical director of the hospital as a regular member of team meetings as well as regular reports of processes, improvements, and patient outcomes to the hospital board of directors and hospital leadership.
QI collaboratives have been shown to achieve improvement in the short term but do not have strong evidence of long-term benefit.1 ,8 ,10 Indeed, published literature indicates that improvements diminish with time and the median follow-up for intervention was 1 year.8 ,10 Our study confirms the findings of another CF centre in which there was a relative improvement in median BMI by 19% in 15 months.17 At Lurie Children's the relative improvement in mean BMI percentile improved 30.8% and in the same time frame, UAB/COA had a relative improvement of 18.5%. The prior report used median; our median change was of similar magnitude as our mean change (data not shown).
The first factor contributing to the long-term success in nutritional outcomes is the application of QI methodology. In a qualitative analysis of a collaborative,7 Parand et al7 reported that programme improvement methodology is one key in sustaining improvement, bringing attention to the need for improvement in patient outcomes while introducing process improvement techniques.8 QI methodologies within collaboratives most predictive of long-term success include the early adoption of QI such as rapid cycles of change, implementation and adherence to clinical practice guidelines in a systematic manner, and the learning of new ideas.8 ,9 ,18 ,19 Lurie Children's and UAB/COA paediatric programmes’ early involvement in CFF QI collaboratives led to rapid improvements in nutritional outcomes. Other factors that contributed to the success of these two CF centres included the systematic use of clinical practice guidelines to improve patient nutrition, continued application of new ideas to programme improvement, incorporation of QI methodologies into daily processes, and input and participation of patients and families. In-depth knowledge of QI methodology has assisted in training the team and led to a change in culture that has facilitated sustained improvement.10
Continuous collection and display of data have been identified in the literature as a second predictive factor of maintenance of improvement. 1 ,7–9 ,19 Data display provides motivating feedback while giving improvement a high profile.7 The CFF data registry has proven to be an essential data tool for both a benchmark with other CF centres and an external requirement for target performance goals for key patient outcomes such as BMI percentile. Each programme has not only used and displayed data from the annual CFF Center Specific Registry Report but also relied on a significant amount of additional data generated at the centre level to track patient outcomes and process measures.
The final factor contributing to the success in sustained improvement in each programme is a change in culture. This change in culture has been reported in the literature as essential to maintain improvement. 7 ,8 Although at the outset of the collaboratives, neither programme had a history of a strong culture of improvement, both teams have been able to effect a change in programme culture. The most important methods that each programme used to change culture were to recruit staff to support QI, having a leader serve as a champion and coach, patient and family involvement, and managing up. Staff have been encouraged to participate in all levels of the QI work, from initiating ideas to leading change. By empowering the staff to realise that their ideas for change make a difference in the care delivery for patients with CF, an ongoing culture of QI was supported. Leaders from the initial collaboratives have gone on to mentor and coach, both within their own programmes and for other CF programmes, facilitating the spread of QI culture. Each programme has also involved patients and families as integral members of QI teams as well as having advisory boards, which increases the level of accountability for the individual projects. In addition, outcomes were made transparent to all patients and their families to demonstrate each programme's commitment towards improvement. The leadership of both teams has successfully engaged senior institutional leadership in centre specific improvement, resulting in institutional support in the form of allotted time for improvement work and education and through opportunities to share improvement work with other care teams.
The similar success of these two programmes is important in light of the variation in care delivery, both for CF and for general healthcare across the USA. In general healthcare, as shown via the Child Health Index (per cent low birth weight infants, infant mortality rate, child death rate, teen death rate, and teen birth rates), living in the Deep South region of the USA (Mississippi, Louisiana, Arkansas, Tennessee, Alabama, Georgia, North Carolina, South Carolina, and Florida) is a stronger predictor for poor child health outcomes than other consistently collected and reported variables.20 Similarly, in 2011, the CFF Patient Registry report had mean BMI percentiles that varied from approximately 38% to 65%.21 The CF programme in Alabama was able to improve the care of patients and decrease variation through application of strong QI principles and culture.
While this work is focused in CF, it is an example for improvement in chronic care. Through the participation in a collaborative to improve care, each programme was able to not only improve care for the time they participated in the collaboratives, but has been able to sustain these outcomes for an extended period of time. This demonstrates the success any chronic care delivery team can have in the lives of the patients for whom they provide care. Consistent application of QI principles can leading to lasting changes.
The limitations to this study include the inference of BMI percentile as the measure of nutritional status without consideration of other nutritional measures such as weight, height and head circumference. In addition, the data were cross-sectional, with a high probability that the same patient contributed multiple measurements over time. The retrospective nature of this analysis also limits the authors’ ability to control for confounding variables. The data were not adjusted for confounders such as the death of sicker patients with surviving better-nourished patients continuing to contribute to the data. An additional confounder includes a varying composition of the cohort of patients as patients transfer into and out of the programme's care. Finally, it is not clear that the improvement in patient outcomes over time is solely due to the interventions, particularly since most process measures were only tracked for a limited time period, and because there have been other advances in CF care.
Despite these limitations, we believe that the consistent review of the process of care delivery has undeniably improved nutritional outcomes. This application of QI methodology to processes related to nutritional care for CF patients has improved BMI percentiles at each centre. Indeed, we conclude from our separate experiences that, first, participation in the collaborative improves outcomes, and second, through culture change, continual focus on data and focus on QI methodology gains made through collaboratives can be sustained.
References
Footnotes
-
Contributors SAMcC, HHG, LJB, KP and APS all had the following contributions: substantial contributions to the conception or design of the work; or the acquisition, analysis, or interpretation of data for the work; drafted the work and revised it critically for important intellectual content; final approval of the version to be published; and agreed to be accountable for all aspects of the work in ensuring that questions related to the accuracy or integrity of any part of the work are appropriately investigated and resolved.
-
Funding Cystic Fibrosis Foundation.
-
Competing interests None.
-
Ethics approval Institutional review boards at each institution.
-
Provenance and peer review Not commissioned; externally peer reviewed.