Article Text

Abstract
Background In New South Wales serious publicised adverse events in 2006 brought quality and safety to community attention. The Garling external review of 2008 made 139 recommendations, including the creation a single children's hospital. This was addressed by the creation of the Sydney Children's Hospitals Network (SCHN) in June 2010. SCHN brought together the boards and management structures of Sydney Children's Hospital Randwick and the Children's Hospital at Westmead.
Objectives In business, restructures are often implemented to improve performance, safety and customer satisfaction, but improvement has been difficult to demonstrate in healthcare. This study asks whether quality and safety have been improved by the formation of SCHN in June 2010.
Methods Quality data within IHI domains of quality (safe, effective, patient-centred, timely, efficient) has been compared pre and post SCHN. Results are analysed in split control charts, with Chi squared analysis, P scores and benchmarking with data from the Clinical Excellence Commission NSW, and “Solutions For Patient Safety” a North American collaboration of 80 children's hospitals. Restructuring of clinical governance was based on the principals of alignment, networks and improving situational awareness.
Results Significant improvement was seen in several parameters of quality and safety including fewer serious incidents, fewer medico legal cases, fewer medication errors, better access to emergency departments, fewer complaints and maintaining readmission rates despite a 20% increase in activity.
Conclusions At SCHN organisational restructuring has improved quality and safety performance. Structural alignment within agreed quality standards, network roles that share learnings between facilities and better situational awareness are thought to be responsible.⇓⇓⇓⇓⇓⇓⇓⇓⇓⇓⇓⇓⇓⇓⇓

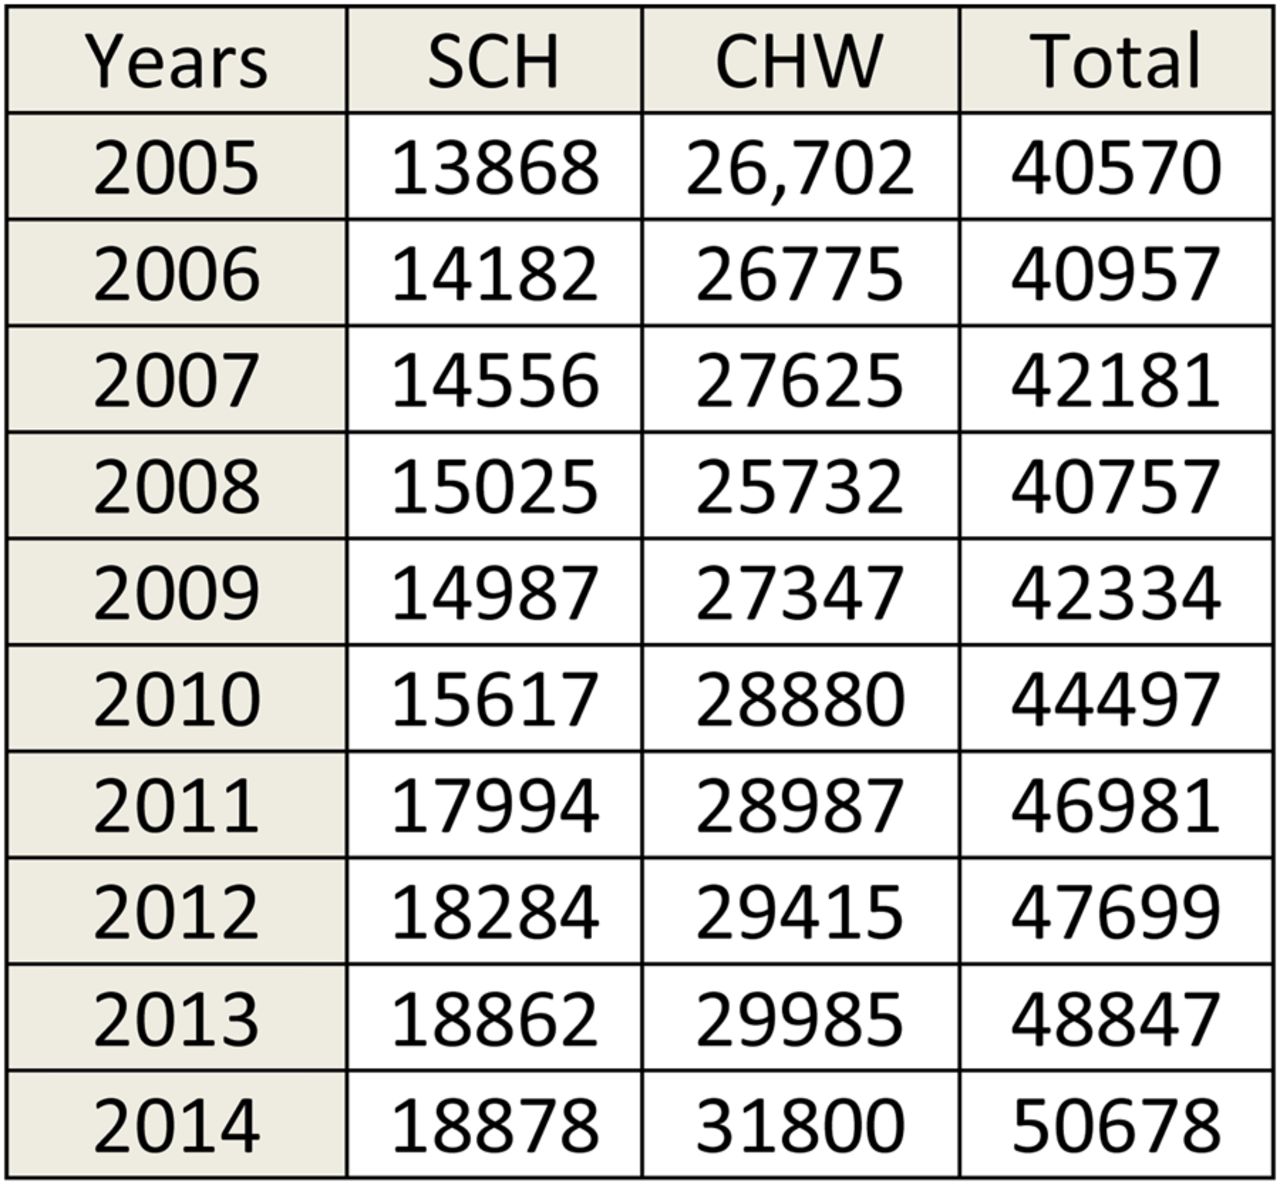
SCHN inpatient activity including day cases 2005–2014.
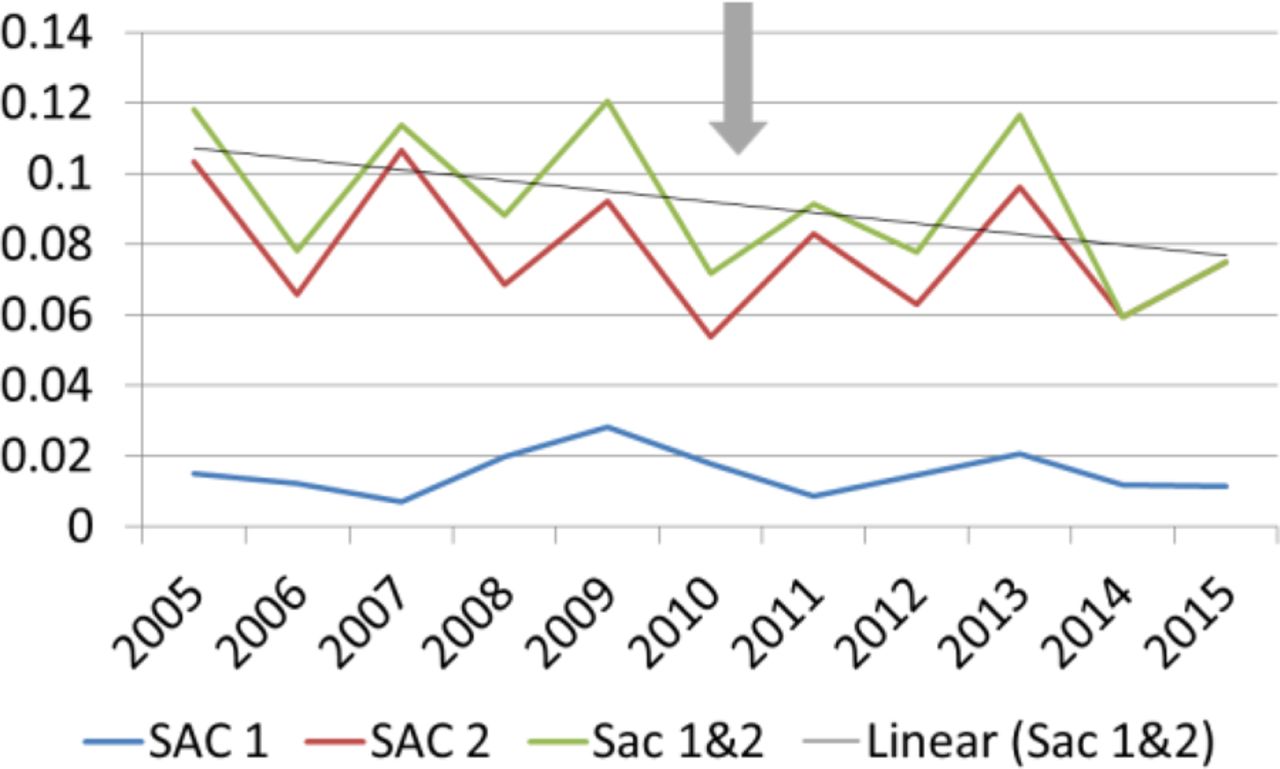
SCHN SAC 1 and 2 incidents as a % of separation.
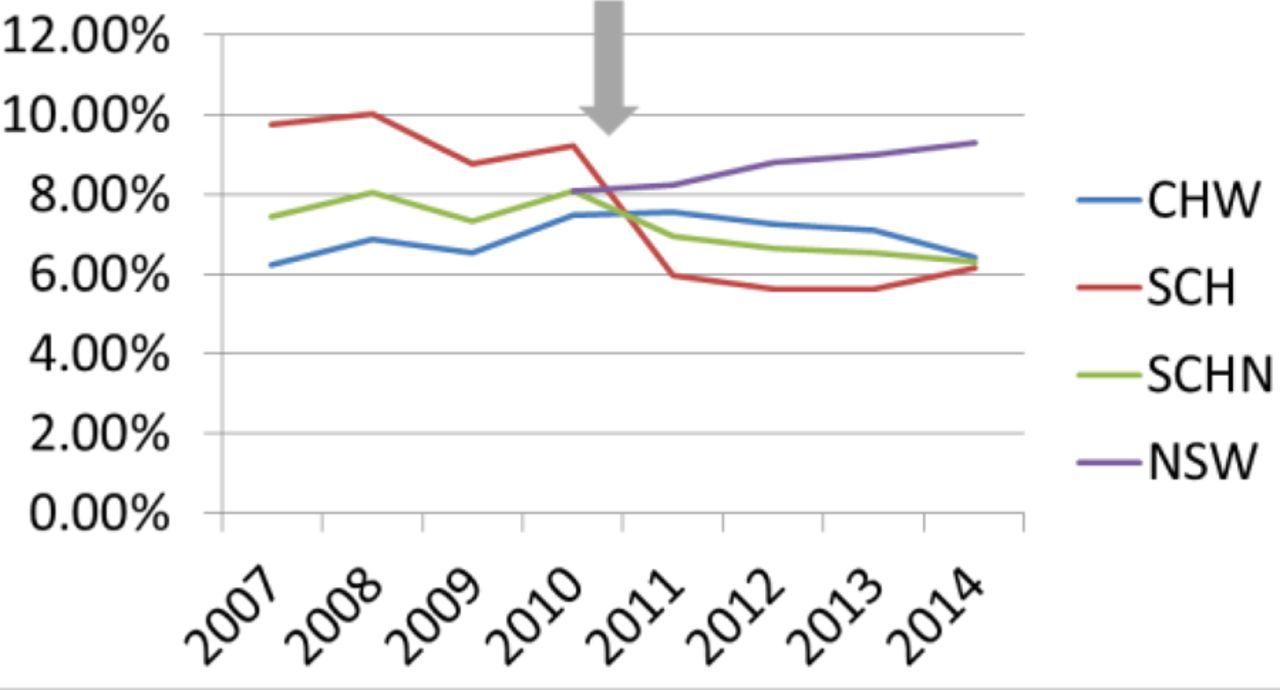
Total incidents reported SCHN as a percentage of separations.

Total incidents reported at CHW increased p<0.05.

Total incidents reported at SCH decreased p<0.05.

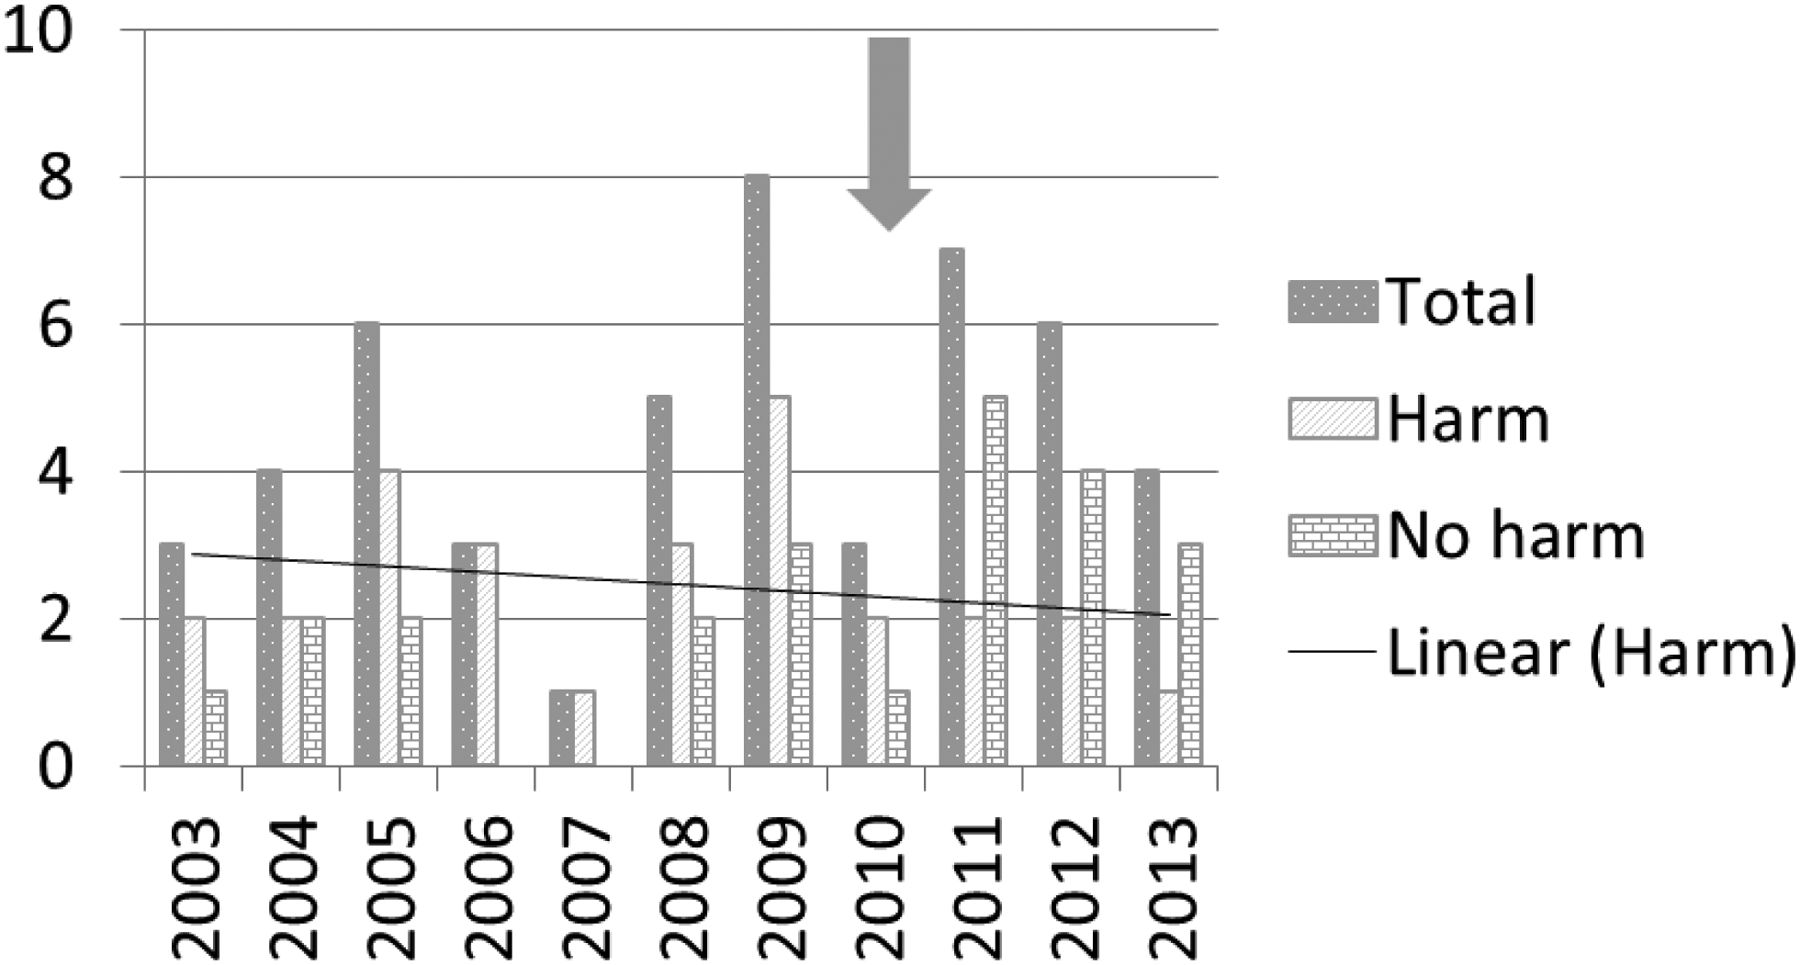
SAC 1s at CHW: harm is reduced.
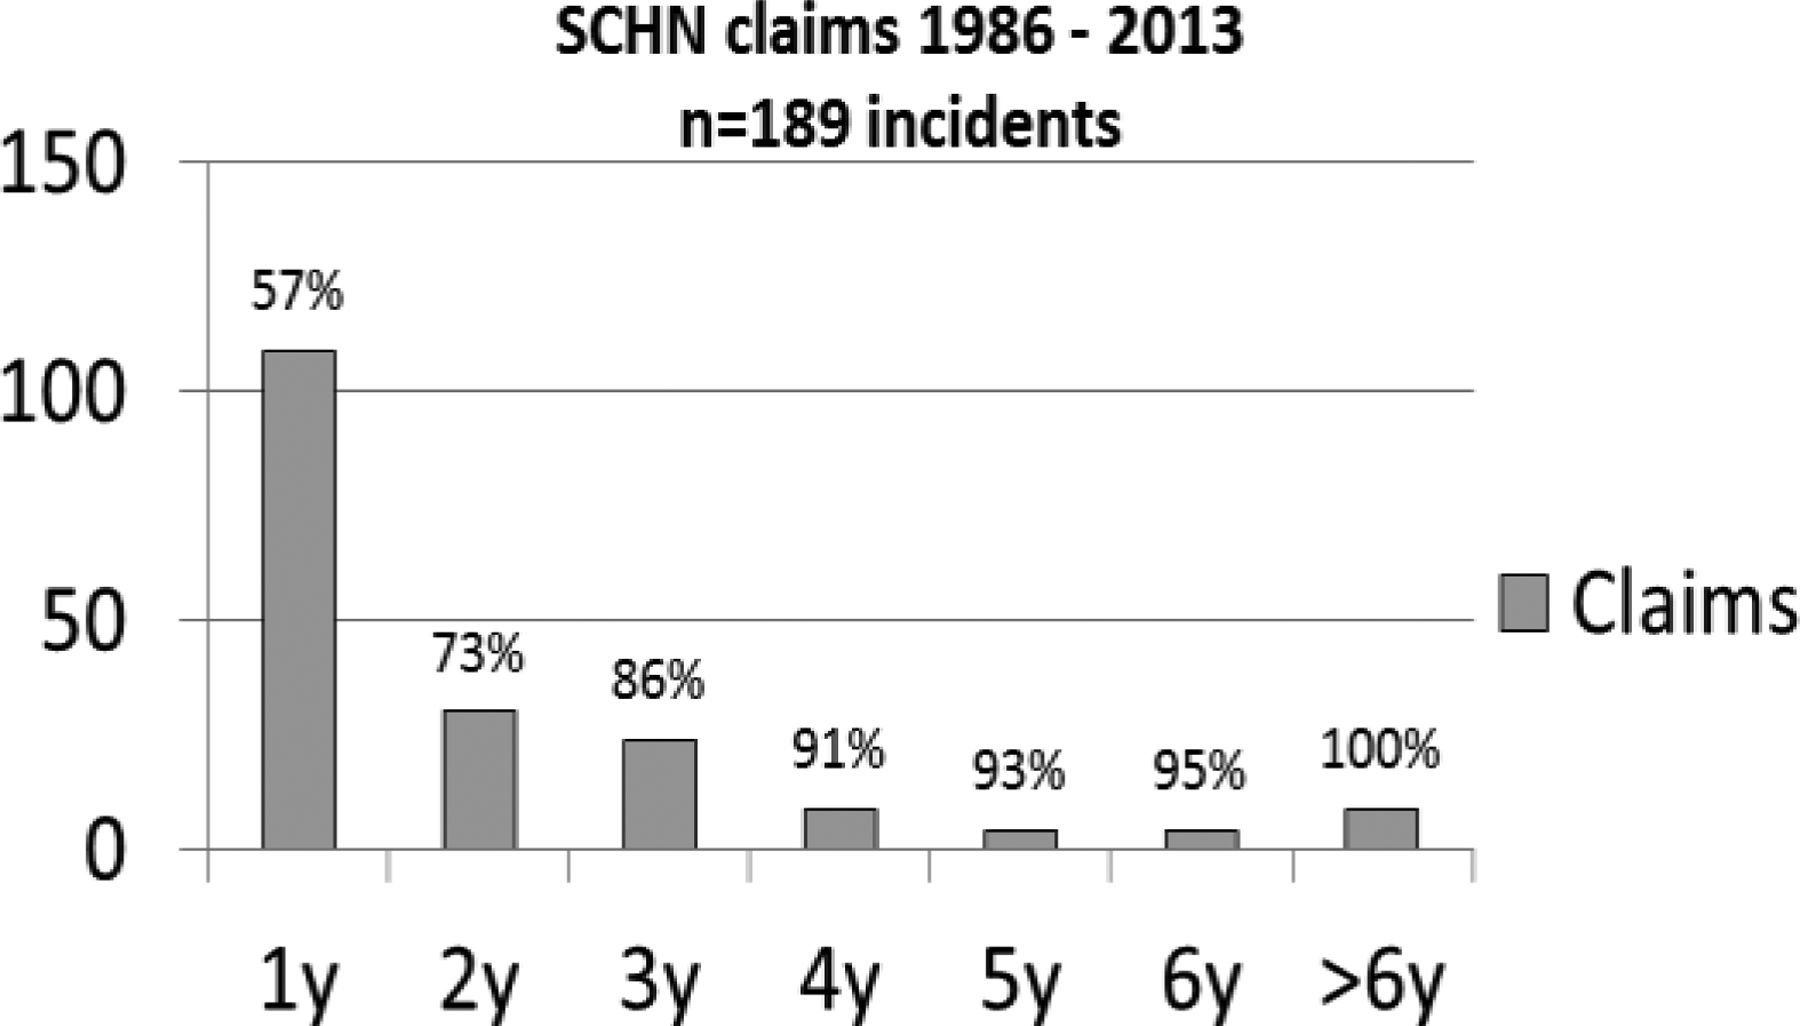
Time delay in medicolegal notifications.
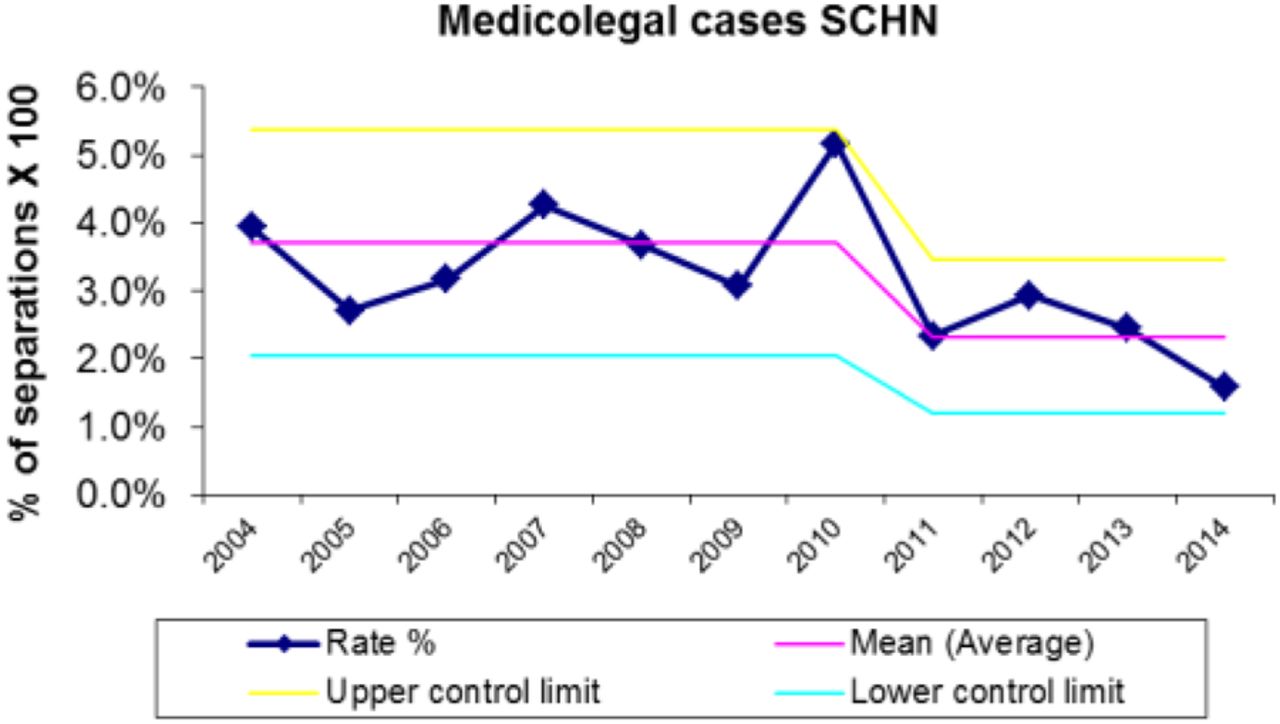
SCHN Medicolegal cases reduced (p<0.05).

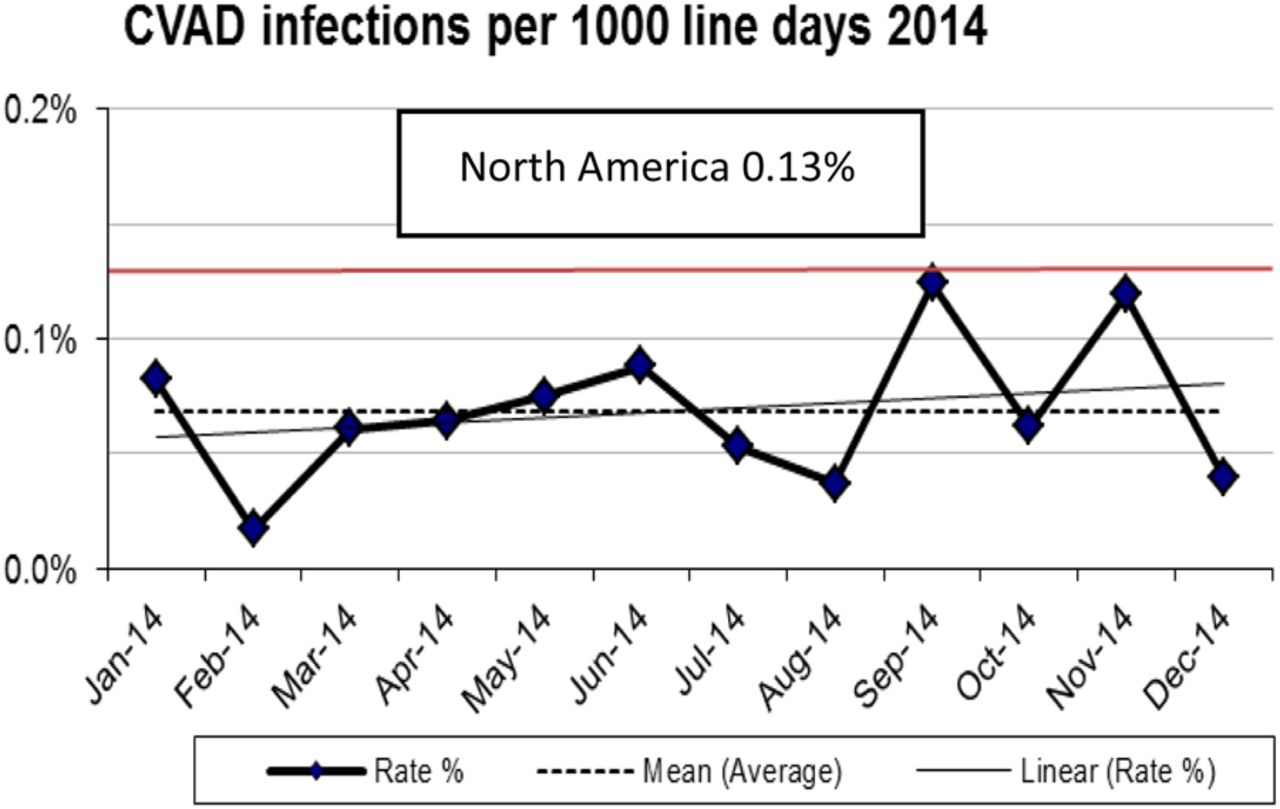
SCHN CVAD infections: benchmarking with North America.

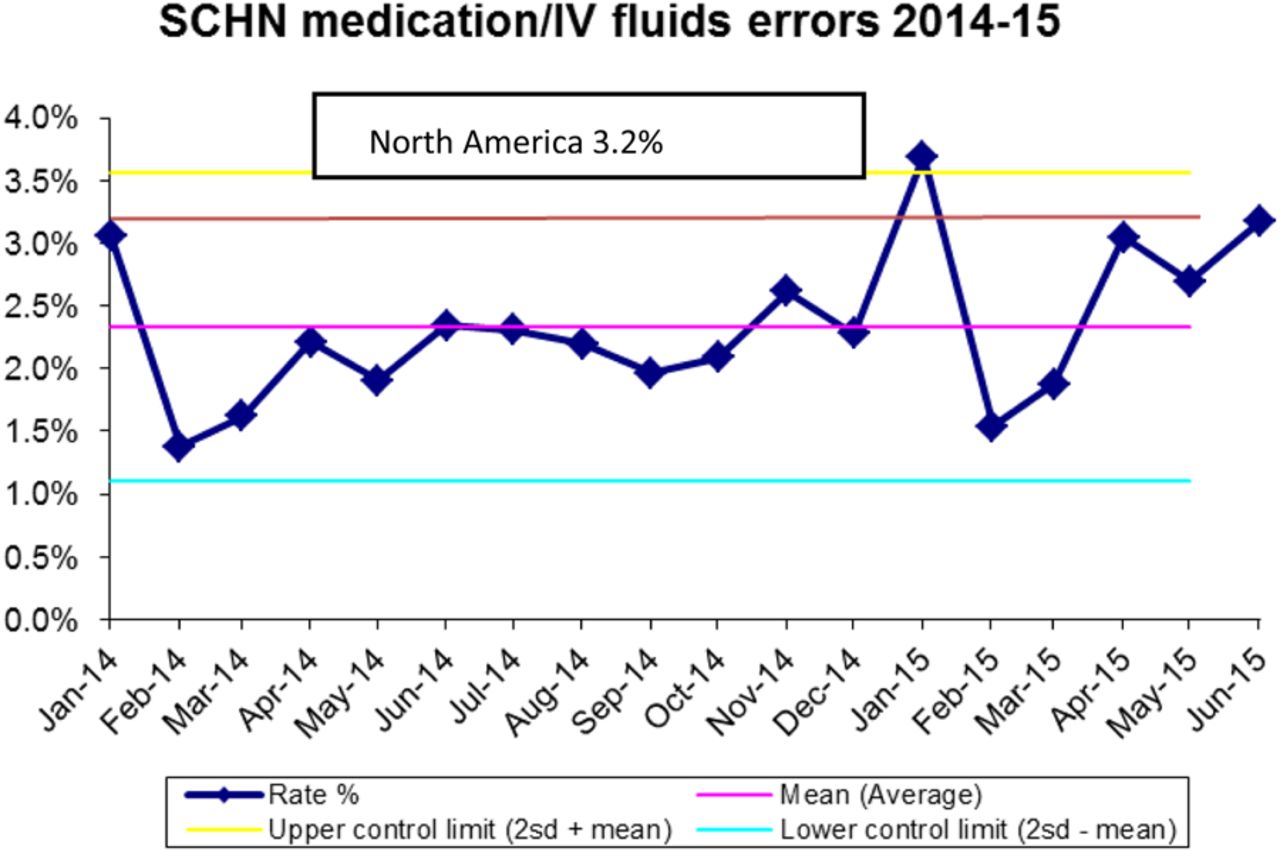
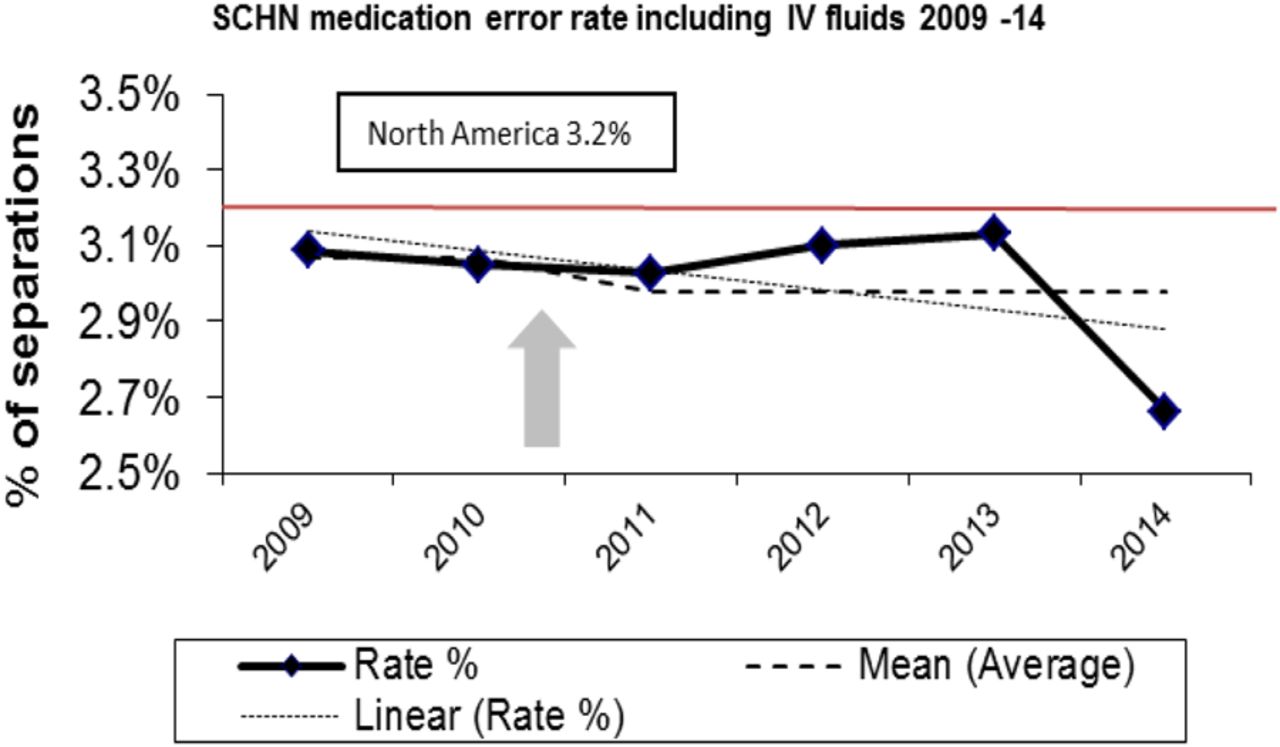
SCHN medication errors: benchmarking with North America.

SCHN medication errors 2009–2014.

Total number of ward arrests: benchmarking with Cincinnati Children's Medical Centre.

SCHN readmission rates increased at 28 days.

SCHN “Did not wait” significantly reduced (p<0.01).

SCHN formal complaints reduced (p<0.1).