Article Text

Abstract
Background Infant mortality (IM) is a key barometer of a nation's health, and the US IM rate is almost three times higher than other developed countries. The national expansion of the Collaborative Improvement and Innovation Network (CoIIN) aims to extend, nationwide, early successes, in HRSA Regions IV and VI, of using Quality Improvement (QI) to decrease IM.
Objectives A key objective of the IM CoIIN is to build states' capacity to utilize QI, using vital records data they already collect, to inform improvement efforts around infant health.
Methods National experts, improvement advisors, and federal and state partners created a common set of measures accessible to all states. Surveillance data were identified by pilot states as critical in tracking their progress around infant health. To increase state buy-in, we developed key indicators utilizing publicly available vital records data and are working with states to achieve quarterly (rather than annual) reporting. Applying QI has shown state stakeholders that QI techniques are valuable to understand existing data in more real-time ways.
Results States are utilizing rapid cycles to produce quarterly vital statistics, as opposed to standard minimum time lags of one year. More than a third of the 47 states participating in data entry for the IM CoIIN entered quarterly data based on vital statistics.
Conclusions Moving to a new model can be resource intensive and there is resistance to changing surveillance data and their usage. However, momentum is growing across states to increase their access and capacity to provisional vital statistics and application of QI statistical techniques.⇓⇓⇓⇓

National Sudden Unexpected Infant Death Rate per 1,000 live births from 1990-2013 using annual data from CDC Wonder.

National Sudden Unexpected Infant Death Rate per 1,000 live births for the duration of the IM CoIIN work from 2009–2013 using quarterly data from CDC Wonder.
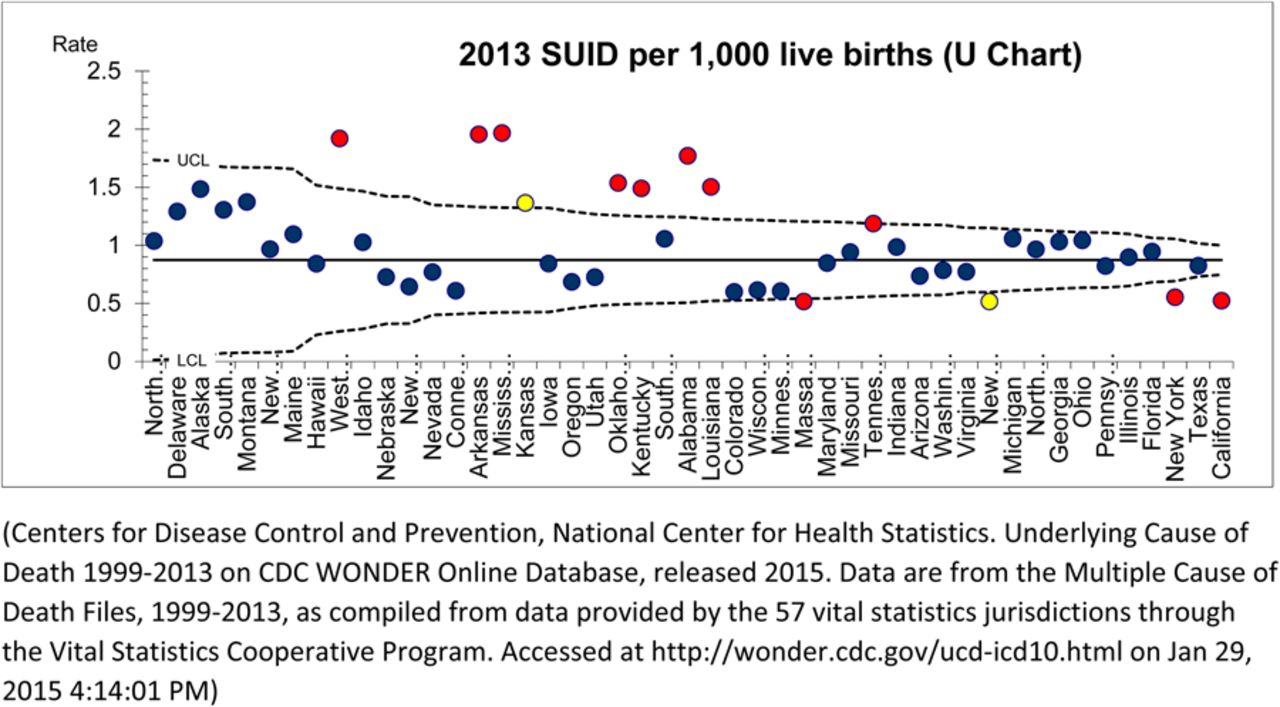
Funnel chart of Sudden Unexpected Infant Deaths (SUID) by State for 2013, with states organized from lowest number of births to highest number of births across the x axis.

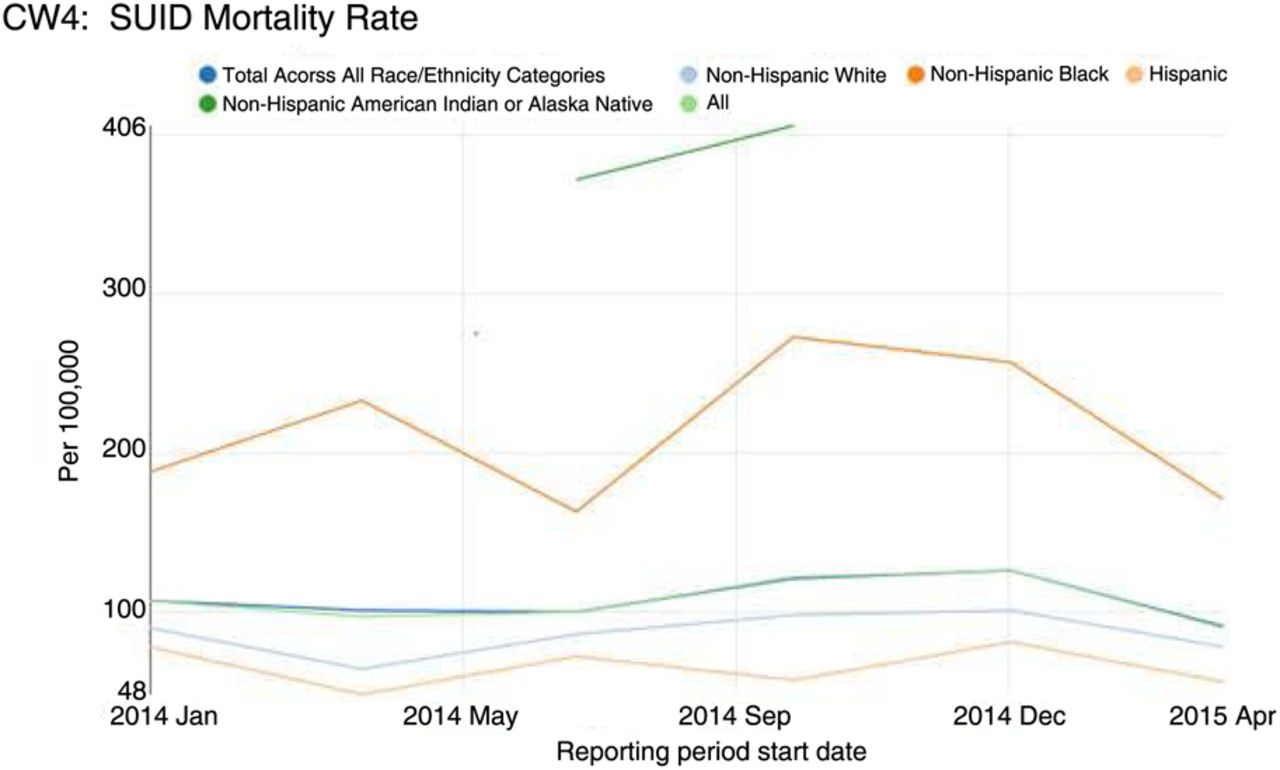
Data provided by states (n=15) demonstrating SUID rate, provided quarterly for the IM CoIIN.