Article Text

Abstract
Objectives To assess whether, compared with previous years, hospital care became safer in 2011/2012, expressing itself in a fall in preventable adverse event (AE) rates alongside patient safety initiatives.
Design Retrospective patient record review at three points in time.
Setting In three national AE studies, patient records of 2004, 2008 and 2011/2012 were reviewed in, respectively, 21 hospitals in 2004, 20 hospitals in 2008 and 20 hospitals in 2011/2012. In each hospital, 400, 200 and 200 patient records were sampled, respectively.
Participants In total, 15 997 patient admissions were included in the study, 7926 patient admissions from 2004, 4023 from 2008 and 4048 from 2011/2012.
Interventions The main patient safety initiatives in hospital care at a national level between 2004 and 2012 have been small as well as large-scale multifaceted programmes.
Main outcome measures Rates of both AEs and preventable AEs.
Results Uncorrected crude overall AE rates showed no change in 2011/2012 in comparison with 2008, whereas preventable AE rates showed a reduction of 45%. After multilevel corrections, the decrease in preventable AE rate in 2011/2012 was still clearly visible with a decrease of 30% in comparison to 2008 (p=0.10). In 2011/2012, fewer preventable AEs were found in older age groups, or related to the surgical process, in comparison with 2008.
Conclusions Our study shows some improvements in preventable AEs in the areas that were addressed during the comprehensive national safety programme. There are signs that such a programme has a positive impact on patient safety.
- Patient safety
- Chart review methodologies
- Hospital medicine
- Medical error, measurement/epidemiology
This is an Open Access article distributed in accordance with the Creative Commons Attribution Non Commercial (CC BY-NC 4.0) license, which permits others to distribute, remix, adapt, build upon this work non-commercially, and license their derivative works on different terms, provided the original work is properly cited and the use is non-commercial. See: http://creativecommons.org/licenses/by-nc/4.0/
Statistics from Altmetric.com
Introduction
Patient safety has been high on the international agenda for several decades since the Harvard Medical Practice Study (HMPS) in 1990 and the 1999 Institute of Medicine report ‘To Err Is Human’.1 Many retrospective patient record review studies in various countries have followed the HMPS in an attempt to evaluate patient safety. Reported adverse event (AE) incidence rates range from 2.9% to 16.6% of all hospital admissions, preventable AE rates range from 1.0% to 8.6%.2–7 These results have increased the demand to take measures to guarantee further the safety of patients in hospitals. Large-scale quality improvement and patient safety programmes have started in many countries, such as the Partnership for Patients,8 the 100000 Live Campaign in the USA9 and the Safer Patient Initiative (SPI) in the UK.10
In the Netherlands, two large programmes have taken place, the ‘Better Faster’ programme (2003–2008) in a selection of hospitals and ‘Prevent Harm, Work Safely’ (2008–2012) aimed at all Dutch hospitals (box 1). To keep track of changes in patient safety at a national level, three patient safety measurements with patient records from 2004, 2008 and 2011/2012 have been carried out in the Netherlands. The results of the first AE study were, partly, the reason to start the safety programme ‘Prevent Harm, Work Safely’ from 2008 to 2012.4 The overall goal of this national programme was to decrease the number of preventable AEs in Dutch hospitals by 50% through the implementation of a Safety Management System in all hospitals and through improvement modules on 10 more practical clinical themes. Part of the improvements between 2008 and 2012 were directed towards complex, often elderly, patients, the surgical process and medication processes, more specific medication verification and high-risk medication (box 1). The AE studies of 2008 and 2011/2012 coincide with the start and the conclusion of the most recent national safety programme (box 1). They have been performed in order to keep track of patient safety in our country.
Context patient safety in the Netherlands 2004–2012
Patient safety in the netherlands 2004–2012

A number of factors may have influenced patient safety in Dutch hospitals. There have been two specific programmes on quality and safety, while surgical checklists have been implemented on a broad scale. It is impossible to provide a complete overview of factors and initiatives that may have influenced patient safety in recent years. We will describe what we believe have been the largest initiatives at a national level.
2004–2008
The national programme ‘Better Faster’ was launched in 2003. Between 2004 and 2008, 24 of the 93 hospitals joined a multilayered programme aimed to enhance the quality of hospital care and to stimulate performance management.15 At a national level, the aim was to create awareness and introduce approaches from business and industry into healthcare. Priority was given to issues of safety, logistics, accountability and innovation. Transparency was introduced in order to guide purchasing decisions and the improvement efforts. A national set of standardised safety indicators for hospital care was developed and maintained by the Health Care Inspectorate.
2008–2012
A national safety programme, ‘Prevent Harm, Work Safely’, was set up between 2008 and 2012 by the different stakeholders in healthcare. The overall goal of this programme was to decrease the incidence of preventable adverse events (AEs) in Dutch hospitals by 50%. All 93 Dutch hospitals were offered support in this programme to implement improvements in patient safety. This safety programme had two pillars. First of all, a Safety Management System (SMS) was implemented in the hospitals. By the end of 2012, all hospitals in the Netherlands were obliged to have an accredited SMS. The basic requirements of a SMS for leadership, management, personnel, patient participation, prospective risk assessment, retrospective risk assessment and improvements were recorded in the Dutch Technical Agreement (NTA 8009) in 2007.16 In 2011, basic requirements for communication, third-party management and management measures were added to the NTA (NTA 8009:2011).17 The second pillar consisted of improvement modules on 10 practical clinical themes18:
prevention of postoperative wound infections
early detection and treatment of critically ill patients
early detection and treatment of pain
verification of medicines upon admission and discharge
prevention of renal failure from the use of iodinated contrast agents19
high-risk medication: parenteral preparation and administration20
prevention of line sepsis and the treatment of severe sepsis
safe patient transfer
At the same time, Dutch hospitals implemented surgical checklists on a large scale, stimulated by external pressure from the Health Care Inspectorate. In 2007, the Dutch Health Care Inspectorate published a report on the operative process, showing that there was considerable room for improving patient safety.25 Since 2007 the Dutch Health Care Inspectorate has given greater attention and supervision to the operative process and many perioperative guidelines including time-out procedures have been developed. Studies supported the use of surgical checklists in the Netherlands. In particular, de Vries et al26 showed the positive effects of the use of surgical checklists on postsurgery complications, reoperations and hospital mortality.
While many countries have performed one AE measurement to assess the status of patient safety, using more than one national AE measurement is not widespread. Previously Landrigan and colleagues have used the global trigger tool to assess temporal trends in patient harm,11 Benning and colleagues have performed repeated AE measurements in a smaller patient group as part of their evaluation of the SPI10 ,12 and our research group has previously reported on the results of the first two measurements in the Netherlands.13 None of these studies have shown that, as a result of sustained attention to patient safety, there have been significant falls in preventable AEs and widespread reductions in patient harm associated with this.
There are several other methods to measure errors and, possibly, preventable, harm. Yet each has its own strengths and weaknesses.14 Retrospective patient record review is a thorough assessment of entire patient records and is used especially to obtain information on the incidence, nature, preventability and consequences of AEs for the whole population of hospitalised patients. Therefore, it currently seems to be the most suitable method to count the number and preventability of AEs, and as such useful in assessing the possible effects of the safety programme.
In this paper, we will discuss the results of the 2011/2012 AE measurement in relation to the previous two measurements and in light of the large-scale efforts to enhance patient safety in the intervening years. This paper asks:
Has hospital care become safer in 2011/2012 in comparison with earlier years, manifesting itself in a reduction of preventable AE rates, alongside a national patient safety programme?
Are there shifts in the types of preventable AEs over time indicating areas in which patient safety has increased or where it is in need of further attention?
Methods
Study design and population
We performed retrospective patient record review studies using patient admissions from 2004, 2008 and 1 April 2011 until 31 March 2012, in respectively 21, 20 and 20 hospitals, out of the total of 93 Dutch hospitals. In 2008 and 2011/2012, the same 20 hospitals were included in the sample. Eight of these were studied in all three measurements. The samples were stratified for university, tertiary teaching and general hospitals. Between 2008 and 2011/2012, three general hospitals received their accreditation as a tertiary teaching hospital. Within the strata the hospitals were selected randomly and a proper representation of both urban and rural settings in the samples were verified. Hospitals had to have at least 200 beds, an intensive care unit and an emergency room to be eligible. Therefore, 4 hospitals were excluded, leaving 89 hospitals from which the sample was drawn. In each hospital, 400 patient admissions were selected in 2004, 200 in 2008 and 200 in 2011/2012. In total, up to 16 000 patient admissions were included. Patients admitted to the psychiatry department, obstetrics and children under 1 year were excluded in order to be comparable with other studies using the same review methods.3 Fifty per cent of the records were of patients who were discharged from the hospital after a stay of at least 24 h. The other 50% were of patients who died in hospital during admission. This made it possible to estimate the number of preventable deaths as this is a relatively small patient group. These patients were sampled from all inpatient deaths, regardless of their length of stay (LOS). We did not exclude patients admitted with an explicitly palliative care plan. This information was noted down and taken into account during the review process.
Patient record review
The nursing, medical and, if available, outpatient records of the sample patient admissions were reviewed by external nurses and external physicians belonging to the specialties surgery, internal medicine and neurology. Consultation with specialties other than their own was available if needed. Most of the reviewers in the 2008 and 2011/2012 studies had also participated in the 2004 study. As we studied the period from 12 months prior to, and 12 months after, the index admission, review of the records took place in 2005/2006, 2009/2010 and 2012/2013, respectively.
The method of determining AEs was comparable to those of other international studies.2 ,3 First, a nurse screened the records by using triggers indicating potential AEs. Admissions that were positive for at least one trigger were reviewed further by a physician. The presence and preventability of an AE was determined based on a standardised procedure and preceded by a number of underlying questions in order to secure a systematic assessment.
An AE was defined by three criteria:
an unintended injury;
the injury resulting in a longer hospital stay, temporary or permanent disability, or death;
the injury was caused by healthcare management rather than the patient's disease.
An AE was found to be preventable when the care given fell below the current level of expected performance for practitioners or systems. The causation by healthcare of an AE as well as its preventability was scored on a six-point Likert scale after consideration through a set of supportive questions to standardise the procedure and counted as caused by healthcare or preventable if the score was 4–6. A score of 4–6 indicated that the reviewer regarded the event as having a >50% chance of being caused by healthcare or being preventable.
AEs that occurred during the patient's index hospital admission, and were detected during either the index admission or subsequent admissions over the following 12-month period, were counted. Also counted were AEs related to patient admissions in the same hospital within the 12 months preceding the index admission but that were not detected until the index admission. Consequently, patient records of the index hospital admission were reviewed, as were the patient records of patient admissions before and after the index admission. The way the AEs were counted was the same for all periods of measurement.
The physicians assessed which clinical process was related to the AE: surgery, drug/fluid, medical procedure, diagnostic, other clinical management, discharge or other. This grouping was based on the grouping of the Canadian AE study and does not have a one-on-one relationship with the themes of the national programme.3
The review process of the 2004 study was slightly adapted for the 2008 and 2011/2012 study. In the 2004 study, pairs of physicians assessed independently all records found positive for the screening criteria in the first-stage review. Disagreement about the presence and/or preventability of an AE prompted a consensus procedure. Analysis of the data from 2004 showed that physicians within pairs tended to show substantial agreement; however, between pairs agreement was much lower. The involvement of a second reviewer and consensus procedure in 2004 did not in itself appear to improve the overall reliability.27 For this reason, and due to limited resources, we chose, in the 2008 and 2011/2012 studies, to review all records positive for screening criteria by one physician.
This has also been the case for other recent and earlier patient record review studies.28 ,29 In our two latter studies, we compensated for the loss of discussion between physicians during the consensus procedure by organising more frequent reflection meetings based on discrepancies in records reviewed twice for all reviewers. This aimed to uphold the high quality of the review process.
Reliability
A random sample, spread equally over all hospitals and time, was taken in 2004, 2008 and 2011/2012 in order to test the reliability of the review process. To ascertain the reliability of screening by nurses, 10% of the records were reviewed twice: 415 in 2004, 238 in 2008 and 215 in 2011/2012. To ascertain the reliability of considerations of the presence and preventability of an AE, 120 records were reviewed twice by physicians in 2004, 228 in 2008 and 241 in 2011/2012. This was also around 10% of the reviewed records by physicians in 2008 and 2011/2012. In 2004, this was different due to a change in the consensus procedure as described above.27 The second reviewer was blinded for the outcome of the first review. Positive and negative agreements were assessed for all years pooled together. We showed positive and negative agreements, as these are absolute measures that are more informative, specific and transparent compared with a relative measure like a kappa statistic.30 Positive agreement for the nurses’ assessment of the presence of triggers was 86.3% (2004: 84.8%; 2008: 89.0%; 2011/2012: 85.8%), negative agreement 74.0% (2004: 77.0%; 2008:76.0%; 2011/2012: 63.3%). For the physicians’ assessment of an AE, the positive agreement was 58.5% (2004: 54.9%; 2008: 63.3%; 2011/2012: 56.9%), the negative agreement 81.8% (2004: 66.2%; 2008: 86.9%; 2011/2012: 82.9%). For the physicians’ assessment of a preventable AE, the positive agreement was 72.9% (2004:75.0%; 2008: 70.6%; 2011/2012: 73.3%), the negative agreement 76.8% (2004: 63.4%; 2008: 76.2%; 2011/2012: 83.3%).
Statistical analysis
Descriptive characteristics for the patient characteristics of the 2004, 2008 and 2011/2012 sample were calculated (SPSS V.20). These characteristics were weighted for the sampling frame to make the total study sample representative of the total Dutch population of hospitalised patients. During these calculations, the analysis outcomes were corrected for the oversampling of deceased patients because, in our sample, 50% of the patients were inpatient deaths, whereas the real figure is 3%. In the results, we weight our 50% back to the actual 3%, so the results presented are a representation of the total hospital population of discharged and deceased patients. We followed the same procedure for the distribution of types of hospitals.31 The sample weight was the inverse of the probability of being included in the sample owing to the sample design. Descriptive characteristics for the total Dutch hospital population are given in online supplementary appendix 1.
First, we calculated crude AE and preventable AE rates weighted for the sampling frame, but without corrections for the clustering of the data or corrections for differences in patient mix between the years. Following this, we calculated standardised AE and preventable AE rates with corrections through multilevel analysis. All rates will be presented as a rate of patients with at least one AE or preventable AE per 100 hospital admissions.
To analyse whether hospital care has become safer in 2011/2012, in comparison with earlier years, AE and preventable AE rates were assessed using multilevel logistic regression analysis with a three-level structure: patient, hospital department and hospital (MLwiN 2.28) including hospital and department as random effects. These included separate year parameters for the mean and higher-level variances (covariances). We were able, therefore, to correct for clustering at the hospital and hospital department levels per year.32 The outcome measures were the number of patients experiencing at least one AE, and at least one preventable AE. The second-order penalised quasi-likelihood estimation method was used, except for the models regarding preventable AEs, where we used first-order marginal quasi-likelihood estimation methods. To account for the possibility that changes over time were influenced by changes in the patient mix, terms were added to the models for age, sex, urgency of admission (urgent/elective) and admission to a surgical unit (yes/no). All variables included in the model were standardised to reference values for all Dutch hospital admissions in 2008, and effects of the variables were estimated for each year (see online supplementary appendix 2). We performed Wald tests to assess whether differences existed after patient mix corrections in AE rates and preventable AE rates between the years. We extrapolated total preventable AE rates to absolute numbers of preventable AEs in the Netherlands by multiplying the corrected preventable AE rates with the total number of patient admissions in the Netherlands. We chose to use the total number of patient admissions of 2011/2012 for calculations in all years. In this way differences in absolute numbers of patients experiencing preventable AEs would not be the result of differences in total patient admissions between the years. The intraclass correlation coefficients (ICCs) were calculated for the hospitals and departments per year. The ICC indicates the relative influence of that level on the total variance of the outcome in a year. A higher ICC at the hospital level means a smaller variance for all rates within the hospitals and a larger variance between hospitals. Unfortunately, our sample was not sufficient to show the results on hospital level. Besides, showing the results on hospital level could result in problems with anonymity and confidentiality.
The occurrence of preventable AEs within specific age groups and the main clinical process related to preventable AEs (surgery, drug/fluid, medical procedure, diagnostic, other clinical management, discharge or other) were analysed in SPSS for each year, weighting the results for the sampling frame.
To illustrate the types of AEs and preventable AEs we found, we also grouped the AEs into more specific types of AEs, based on the categories that Landrigan and colleagues used in their study.11 We calculated, for each year, the numbers per 10 000 patients in order to make it possible to show the numbers of the years side by side. The results are shown in online supplementary appendix 3.
Results
In total, 15 997 patient admissions were included in the study, 7926 patient admission from 2004, 4023 from 2008 and 4048 from 2011/2012 (table 1). The largest shift in patient characteristics in our samples was between 2004 and 2008. Here the mean age increased and the LOS decreased (p<0.001). Between 2008 and 2011/2012, patient characteristics stayed relatively stable (table 1). The increase in percentage of tertiary teaching hospitals was due to some hospitals receiving accreditation between 2008 and 2011/2012 and therefore changed from the general to the tertiary teaching hospital category. The data in our sample roughly correspond with national trends in the hospital population but the trend of a shorter LOS over the years in our sample is stronger than the national trend (source: DHD/KIWA Carity/online supplementary appendix 1).
The hospital and patient characteristics of the study samples 2004, 2008 and 2011/2012
Adverse events
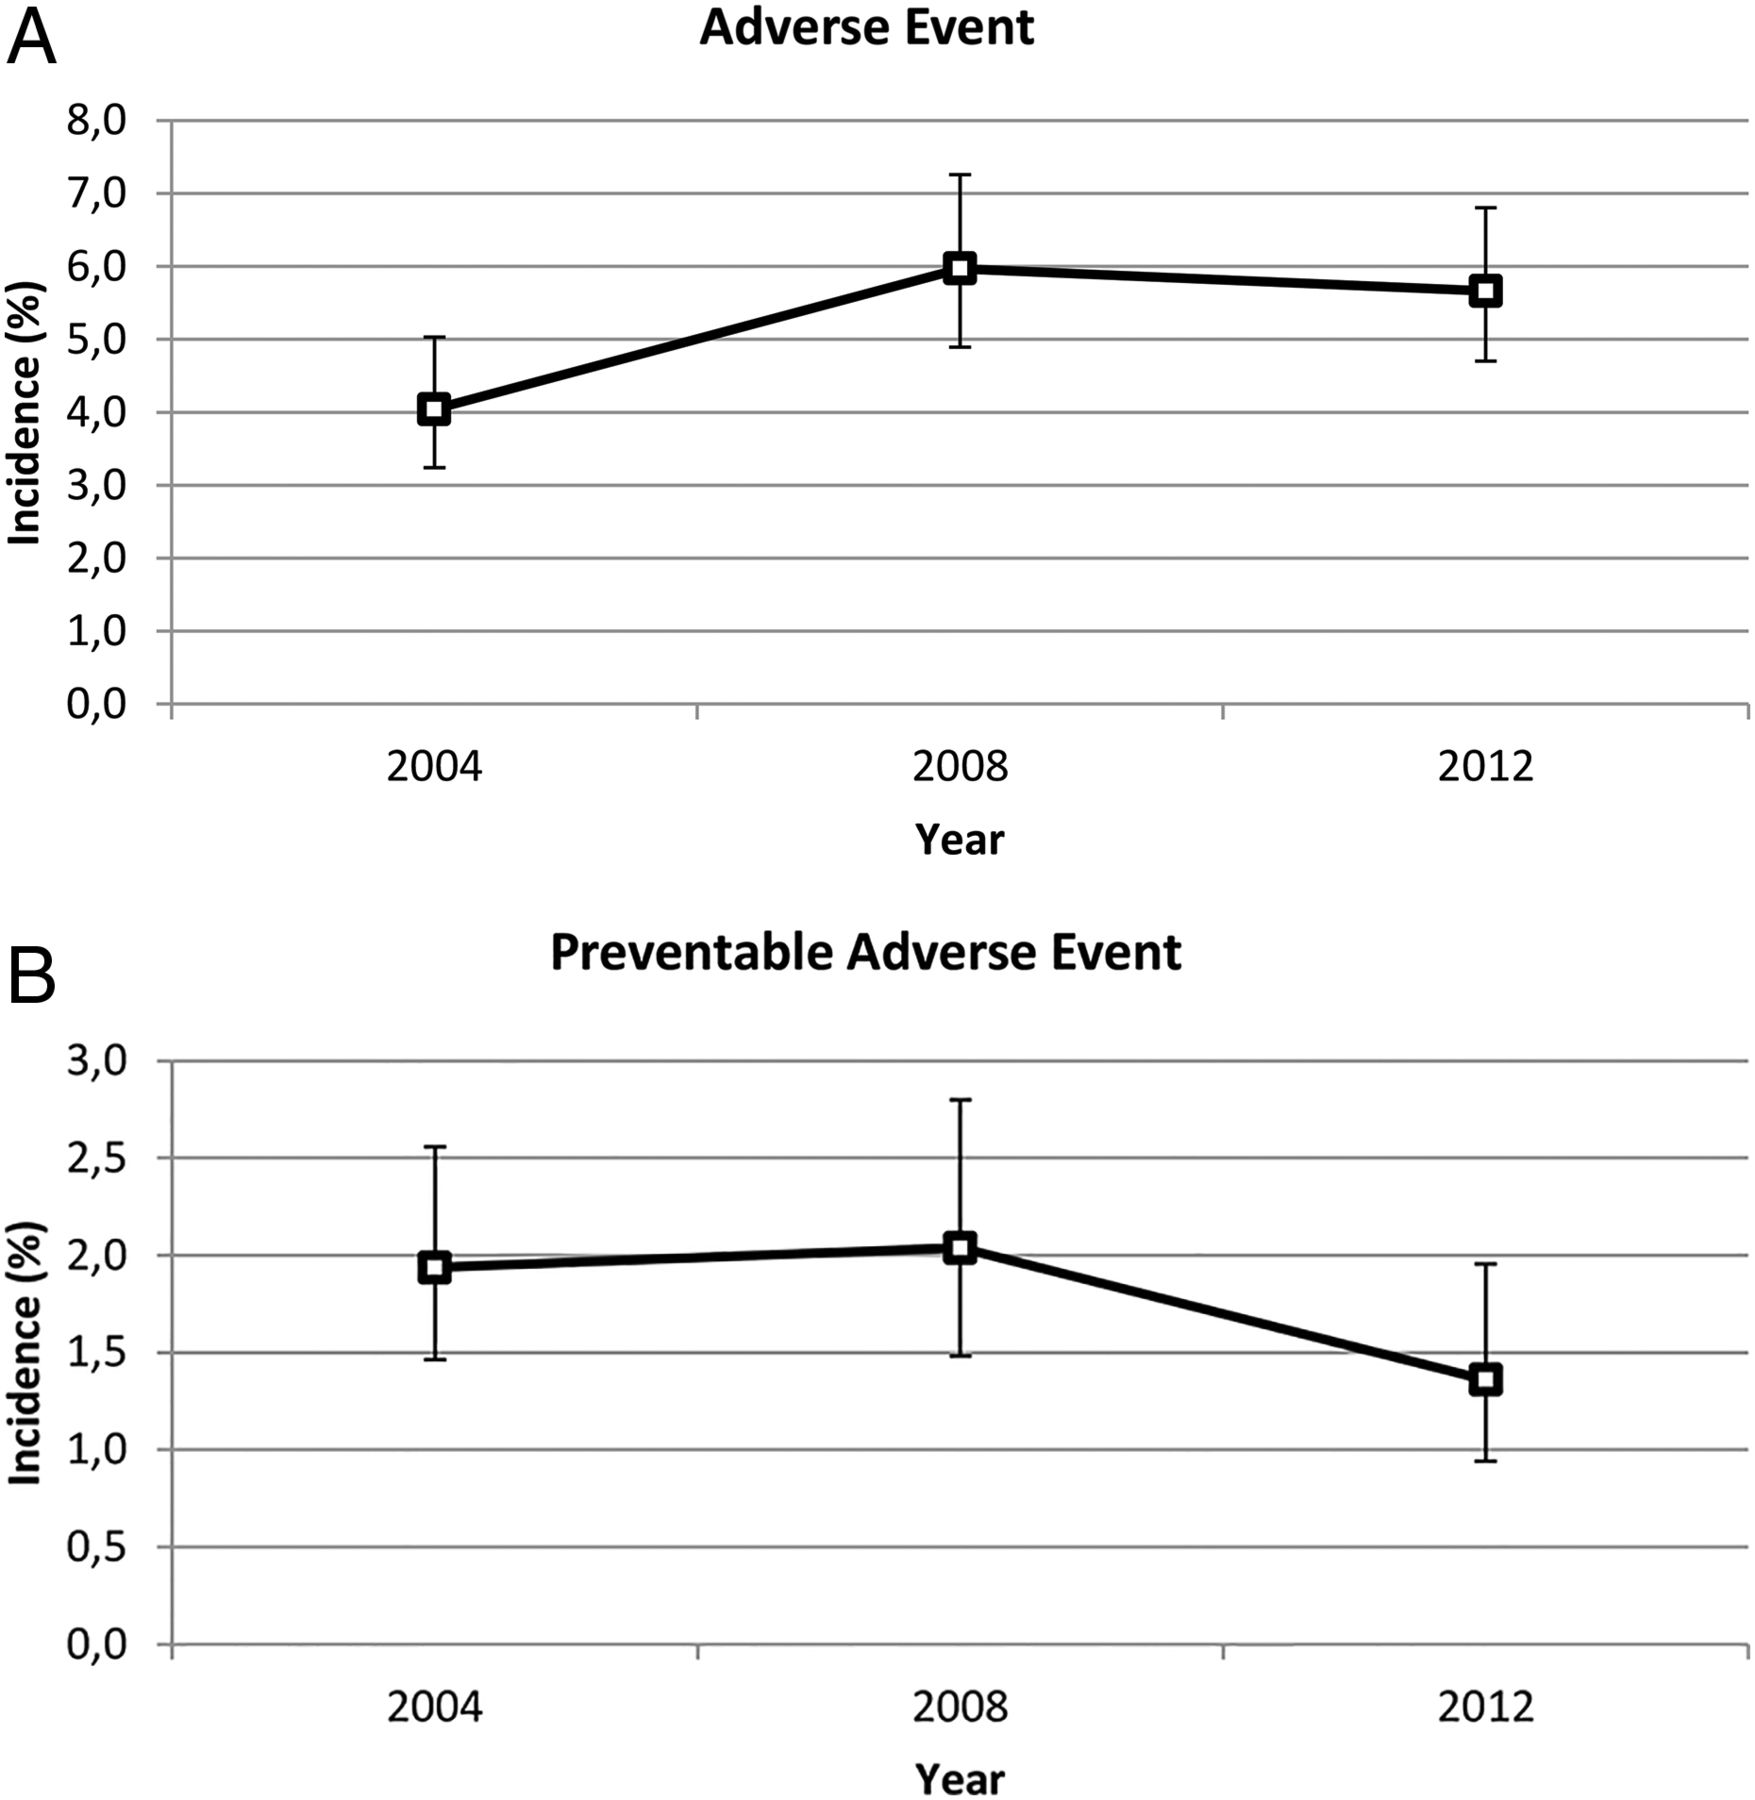
Crude AE rates of patients with at least one AE increased between 2004 and 2008 (p<0.001) and stayed relatively stable between 2008 and 2011/2012 (table 1). Overall, the corrected and standardised AE rate in 2004 was 4.0% (95% CI 3.2 to 5.0), which increased to 6.0% in 2008 (95% CI 4.9 to 7.3) (p<0.01) and finally stayed relatively stable with 5.7% in 2011/2012 (95% CI 4.7 to 6.8) (p=0.68) (figure 1A).

(A) Multilevel corrected adverse event rates in 2004, 2008 and 2011/2012. (B) Multilevel corrected preventable adverse event rates in 2004, 2008 and 2011/2012.
ICC estimates for overall AE variance at the hospital and department levels showed a slight, statistically non-significant, decrease. At the hospital level, these were 6.5% in 2004, 5.1% in 2008 and 2.6% in 2011/2012. The decrease indicates that the differences between hospitals became smaller. ICCs at the department level were higher, but stayed relatively stable through the years at 10.6% in 2004, 8.4% in 2008 and 9.7% in 2011/2012. The differences within hospitals, thus between departments, remain relatively stable.
Preventable AEs
Uncorrected rude preventable AE rates showed a 45% decrease of admissions with at least one preventable AE in 2011/2012 in comparison with 2008 from 2.9%, 198 out of 4023 patients, to 1.6%, 108 out of 4048 patients (p<0.001). In comparison with 2004, this was a 30% reduction from 2.3% to 1.6% (p<0.001) (table 1). To analyse whether hospital care had become safer in 2011/2012, in comparison with earlier years, multilevel corrections were made for clustered data and possible differences in patient mix between the years. These analyses showed that the decrease in preventable AEs was no longer statistically significant (p=0.10). The corrected and standardised percentage for preventable AEs was 1.9% in 2004 (95% CI 1.5 to 2.6), staying relatively stable in 2008 with 2.0% (1.5 to 2.8) (p=0.80) and decreased by 30% to 1.4% in 2011/2012 (95% CI 0.9 to 2.0) (p=0.10) (figure 1B). Extrapolating these rates to total absolute patient numbers in the Netherlands in 2011/2012, 10.070 fewer patients experienced a preventable AE than in 2008.
Because preventable AEs were such rare events, especially in 2011/2012, the sample was not big enough to capture, reliably, the small variance between hospitals and hence is estimated as zero. Therefore, ICCs at the hospital level could not be calculated for preventable AEs. At the department level, ICCs for preventable AEs showed more variation in later years: 8.2% in 2004, and a statistically non-significant increase to 14.4% in 2008 and 13.9% in 2011/2012. The differences between the departments thus became larger.
We analysed further possible shifts in crude preventable AEs in the surgical process, medication, diagnostics and the risk of experiencing a preventable AE in different age groups in order to assess whether specific patient safety efforts in the hospitals in the intervening years could be seen in our data. For the large part, the preventable AEs were related to the surgical process in all years, with respectively 1.0% of all hospitalised patients in 2004, increasing to 1.6% in 2008 and decreasing to 0.7% in 2011/2012 (p<0.001 for 2008–2011/2012 and 0.08 for 2004–2011/2012) (figure 2). Preventable AEs related to drug/fluids were also common and stayed relatively stable through the years, with respectively 0.3%, 0.3% and 0.4% (figure 2). Similarly, preventable AEs related to the diagnostic process increased from 0.3% in 2004 to 0.5% in 2008 (p=0.03) and then decreased to 0.2% in 2011/1202 (p=0.02), even though there was not a specific theme targeting the diagnostic process (figure 2).

Preventable adverse event (AE) rates per clinical process weighted for over-representation of deceased patients and hospital type.
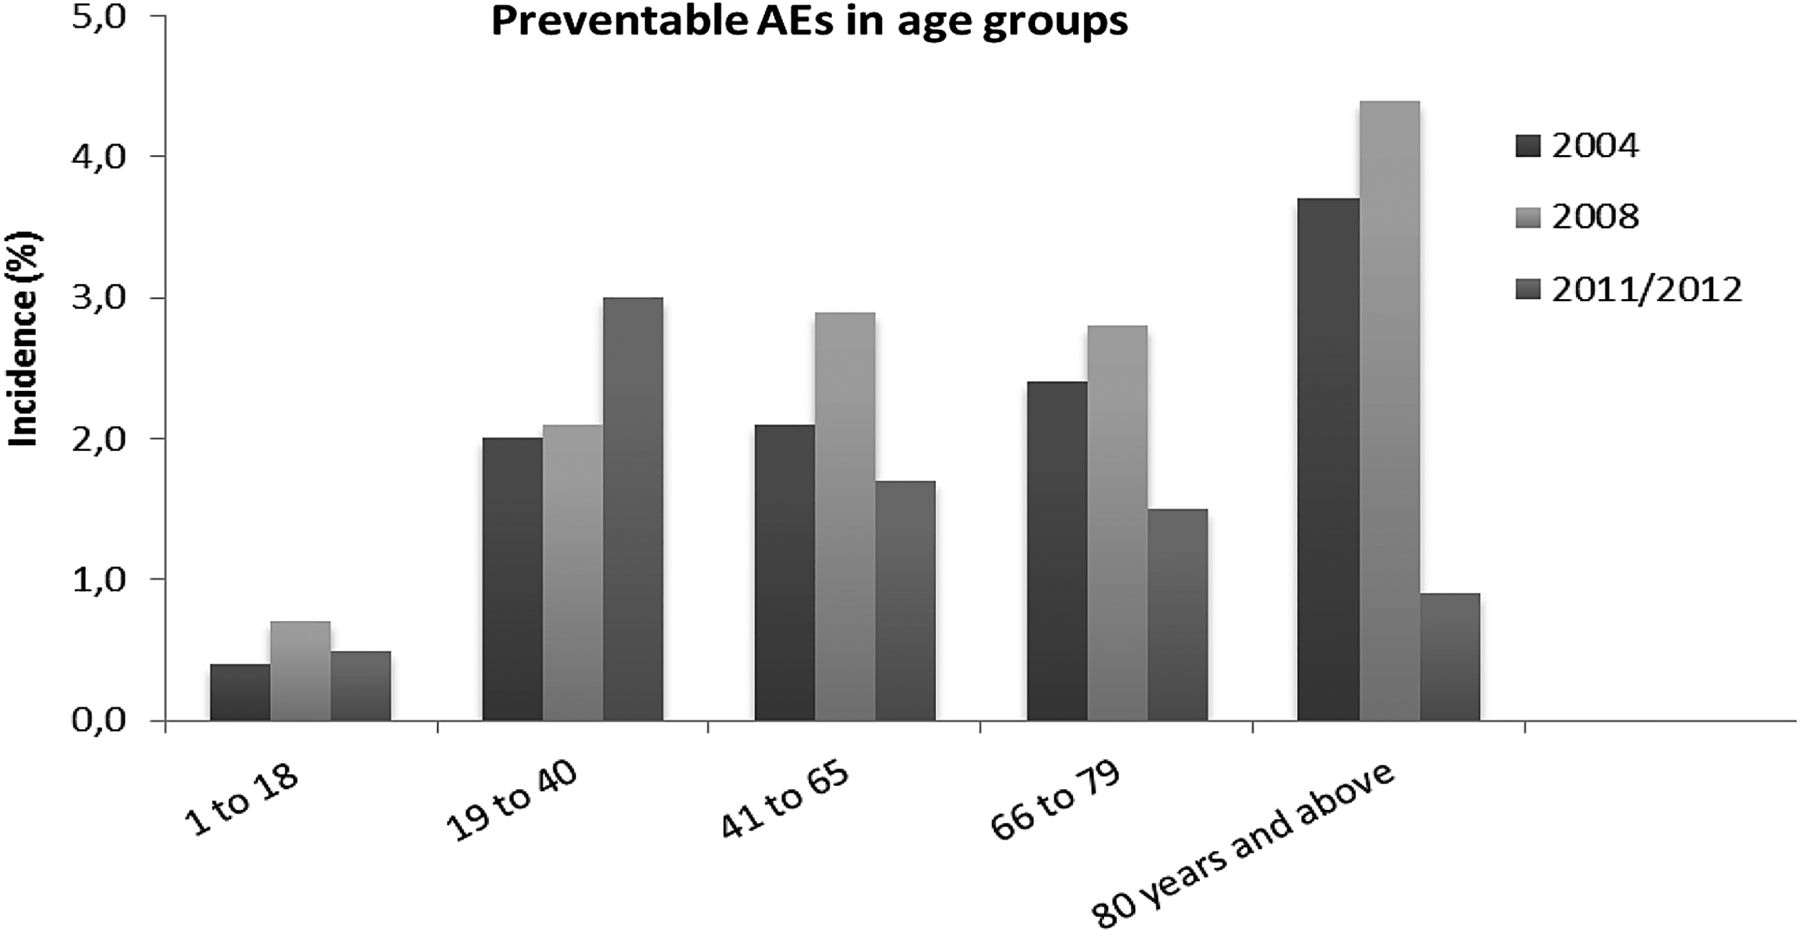
The visible decrease in preventable AEs in 2011/2012 could be attributed primarily to older patient groups (figure 3), starting in the age group 41–65 and most visible in patients aged ≥80. In 2004, 3.7% of all patients of ≥80 years experienced a preventable AE; in 2008, 4.4% and in 2011/2012 this decreased to 0.9%. This trend was also visible in the age group 41–65 and 66–79, although less pronounced. In contrast, in the age group 19–40, the incidence of preventable AEs slightly increased, from 2.1% in 2008 to 3.0% in 2011/2012 (figure 3). The LOS decreased about equally in each age category over the years (data not shown), and thus cannot explain this decrease in preventable AEs being detected during hospital stay. The results in elderly patients will be described in more detail in a separate manuscript.
Preventable adverse event (AE) rates per age group.
Discussion
Principal findings
We reviewed nearly 16 000 patient records during three national AE studies with a thorough assessment of patient admissions in order to estimate overall and preventable AE rates. Uncorrected crude overall AE rates showed no change in 2011/2012 in comparison with earlier years, and preventable AE rates showed a reduction of 45%. After multilevel corrections for clustered data and possible differences in patient mix between the years, the decrease in preventable AE rate in 2011/2012 was still clearly visible with a ‘decrease’ of 30% in comparison to 2008. But this decrease was not statistically significant (p=0.10). This 30% reduction amounts to 10.070 fewer patients experiencing preventable AEs in the Dutch hospital population. In 2011/2012, fewer preventable AEs were found in older age groups or related to the surgical process in comparison with 2008. Because the LOS and thereby the chance of an AE being detected during hospital admission decreased about equally in all age categories, we believe that the reduction in LOS does not explain the change in AEs in elderly patients.
As Brown and colleagues have discussed, a common problem for evaluators is that patient outcomes that are affected by an intervention are also influenced by many other factors and many forms of bias may exist.33 ,34 Variations in our data are likely to be a summation of variations in the quality of care, variations due to patient case mix, variations in the used definitions/data quality and chance.35 First of all, the true source of change we would like to capture is the quality of care. A number of factors make it plausible that at least in part the improvement in preventable AE rates could be the result of the national patient safety programme and other safety improvement initiatives that have been implemented. The safety programme between 2008 and 2013 was much more elaborate and directed towards all Dutch hospitals in comparison to the programme between 2004 and 2008. This could explain the improvement between 2008 and 2011/2012. Also, the pronounced decrease in preventable AEs related to the surgical process coincides with the attention given to the surgical process over the last years. This attention has included pre-surgical, peri-surgical and post-surgical guidelines, surgical checklists and increased attention and supervision by the Dutch Health Care Inspectorate. The decrease in preventable AEs, furthermore, is mainly visible in older age groups. This coincides with several of the 10 improvement trajectories such as early recognition and treatment of deteriorating patients and the trajectory for the vulnerable elderly. A national report evaluating the improvement modules of the safety programme showed that the process indicators of these two trajectories showed improvements.36 For the topic ‘Early recognition and treatment of deteriorating patients’, the goal was to implement a rapid response system. The evaluation study showed that 17 of the 18 hospitals evaluated had their rapid response team operational by the end of 2012. For the module, screening of vulnerable elderly patients for falls, poor nutrition, physical limitations and delirium, the goals were not completely met, but did show a significant increase over the years.36 Our results did not show any visible improvements in preventable AEs related to medication. Two of the ten improvement modules were related to medication: 'medication reconciliation at hospital admission and discharge' and 'high-risk medication'. With respect to the use of the medication reconciliation module, the aforementioned evaluation study showed that compliance in the hospitals remained low over the course of the evaluation study but did show a slightly positive trend.36 Although all hospitals took part in the national safety programme, the hospitals that participated in the study described in the evaluation report were not the same hospitals as in our record review study. About 19 hospitals participated in the data collection on each module. The overlap in hospitals was very small, and the participating hospitals did not collect data for each module. Therefore, a complete data set is not available for use in the current retrospective study.
As figure 2 shows, the rate of preventable AEs associated with the diagnostic process decreased between 2008 and 2011/2012, even though there was no specific theme targeting the diagnostic process. It is likely that other processes apart from the national safety programme were of influence on the preventable AE rates. Of course in these years other initiatives and processes directed towards patient safety and quality of care also took place, as, for example, new or improved guidelines, local initiatives, training or schooling. The national safety programme, however, did include more than the 10 themes, such as the implementation of a safety management system in all hospitals. This could have resulted in a more general patient safety awareness.
Second, changes in patient mix could have had an influence on the results. Our data show that the largest shift in patient mix is between 2004 and 2008. Then patients were getting increasingly older and had a shorter LOS. But this was less the case between 2008 and 2011/2012. We have corrected in our model as much as possible for changes in patient mix. We doubt though whether we were able to capture patient complexity completely. Despite the indications that the efforts of the national safety programmes may have resulted in a decrease of preventable AEs, it is still unclear to what extent the programmes exactly contributed to this improvement.
Third, variations in definitions and in the method of measurement used could influence the results. The research method was not exactly the same for all years, as more extensively described in earlier work.13 This mainly concerned the 2004 measurement, in which a two-stage review process was used instead of a one-stage review process in 2008 and 2011/2012. Also, it is important to realise that changing patient records, such as more and more patient records becoming electronic, could have an influence on the information that is written down. Information in electronic medical records availability, accessibility and readability of information may be better. However, it also may be that information written down in the electronic records is less comprehensive, as our reviewers made comments on this aspect during our study. This is particularly important as our study is reliant on patient records and the information in these records. Finally, a recent national report shows that patient safety culture in the Netherlands has shown improvements over the years.37 It is unknown to what extent a changing culture has an effect on what reviewers would find preventable. We, however, hypothesise that, if any effect, more AEs would be found preventable instead of less.
Strengths and weaknesses
The strength of our study is that we reviewed nearly 16 000 patient records over three periods in time with a thorough, standardised, assessment of patient admissions. Retrospective patient record review is currently still seen by many as the gold standard for obtaining information on the incidence of AEs and preventable AEs for the whole population of hospitalised patients.38 This study has made it possible to keep an eye on patient safety in hospitals and keep patient safety high on the agenda. Despite the considerable number of patient records reviewed over the years, the sample was not large enough to detect a statistically significant decrease in corrected and standardised preventable AE rates (p=0.10). This was partly due to the thorough statistical analyses. Because our data were clustered within departments and hospitals, a multilevel analysis was necessary. Although the uncorrected crude overall AE rates showed statistically significant improvement, using these rates to draw the final conclusions would overestimate the effect.
Neither was our study set up to describe a causal relationship between the safety programmes and other initiatives over the years and our study outcome, AEs and preventable AEs. The method also has a few limitations linked to retrospective patient record review such as hindsight bias, a moderate inter-rater reliability and information bias.27 ,39–41 Hindsight bias is not expected to have had a different effect over the years and thus also not specifically on the results of changes in AE rates. On the other hand, if our reviewers changed their opinions over a period of years on either the causation by healthcare of specific AEs or the preventability, this could also have had an influence on the hindsight bias. Our results might be biased by the adaptation of the review process between 2004 and 2008. The effect of using one physician instead of two and a consensus procedure is not clear. There is an indication that physicians are more reluctant in their judgement without prone to discover and judge presence of an AE with support of thorough collegial review. A record review process with two physicians and a consensus procedure could lead to more reported AEs than a review process with only one reviewer per record.
Practical implications
This study shows that when monitoring national AE rates there are challenges in reaching enough power to make sufficiently reliable conclusions. We do, however, believe that the benefits of our national AE studies are not merely scientific. They are also an important tool for highlighting the need to maintain high levels of patient safety. As such they also have an impact on society at large. Making AE and preventable AE rates public at three points in time over the last 10 years has helped to prioritise achieving further improvements to the already high levels of patient safety. This is true for hospitals, patients and Dutch professional societies such as for physicians or nurses. On the other hand, the low rates and the lack of potential for improvement may also come with the loss of sense of urgency for patient safety. However, in our experience, with a thorough explanation of the results and their implications for daily practice people can still be motivated. All aspects should be taken into consideration when considering whether to repeat this type of research. Advances in electronic patient records could help make the process of case note review more efficient and thus easier to reach larger samples. Future research could also direct itself towards more specific patient groups or diseases with a high risk of experiencing preventable AEs, such as patients undergoing surgery. This could overcome some of the methodological problems related to a structured but implicit review and could offer insight into directions for further opportunities for improvement.
Conclusion
We found a 45% decrease in crude preventable AE rates (p<0.01) alongside a national patient safety programme and other patient safety and quality of care initiatives. In addition, we found a 30% decrease in corrected and standardised preventable AE rates (p=0.10) in the last four years after a 5% increase in the five preceding years (p=0.80). A decrease of preventable AEs was seen in the areas that were addressed during the safety programme. Although these results make it plausible to attribute the positive results to the national programme, they may also in part be the result of other initiatives or based on chance.
References
Supplementary materials
Supplementary Data
This web only file has been produced by the BMJ Publishing Group from an electronic file supplied by the author(s) and has not been edited for content.
- Data supplement 1 - Online appendices
Footnotes
Contributors RB: design, acquisition, analysis and interpretation of the data and drafting of the manuscript. ML: design, acquisition of data, reviewed analysis and interpretation of the data and critical revision of drafted manuscript. PS: analysis and interpretation of data and critical revision of drafted manuscript. MdB and CW: design, interpretation of data and critical revision of drafted manuscript. All authors approved the final version of the article.
Funding The Dutch Ministry of Health, Welfare and Sport.
Competing interests None declared.
Ethics approval The study protocol was reviewed and approved by the scientific committee of the EMGO+ Institute and by the ethical review board of the VU University Medical Center.
Provenance and peer review Not commissioned; externally peer reviewed.