Article Text

Abstract
Background 30% of children with short bowel syndrome (SBS) presenting to an emergency department (ED) with fever have a central line associated bloodstream infection (CLABSI). Earlier provision of antibiotics may reduce the high morbidity and mortality associated with this condition.
Objectives To decrease time to antibiotics for patients presenting to the ED with SBS, central venous access, and fever from 95 minutes to 60 minutes by August 31, 2016.
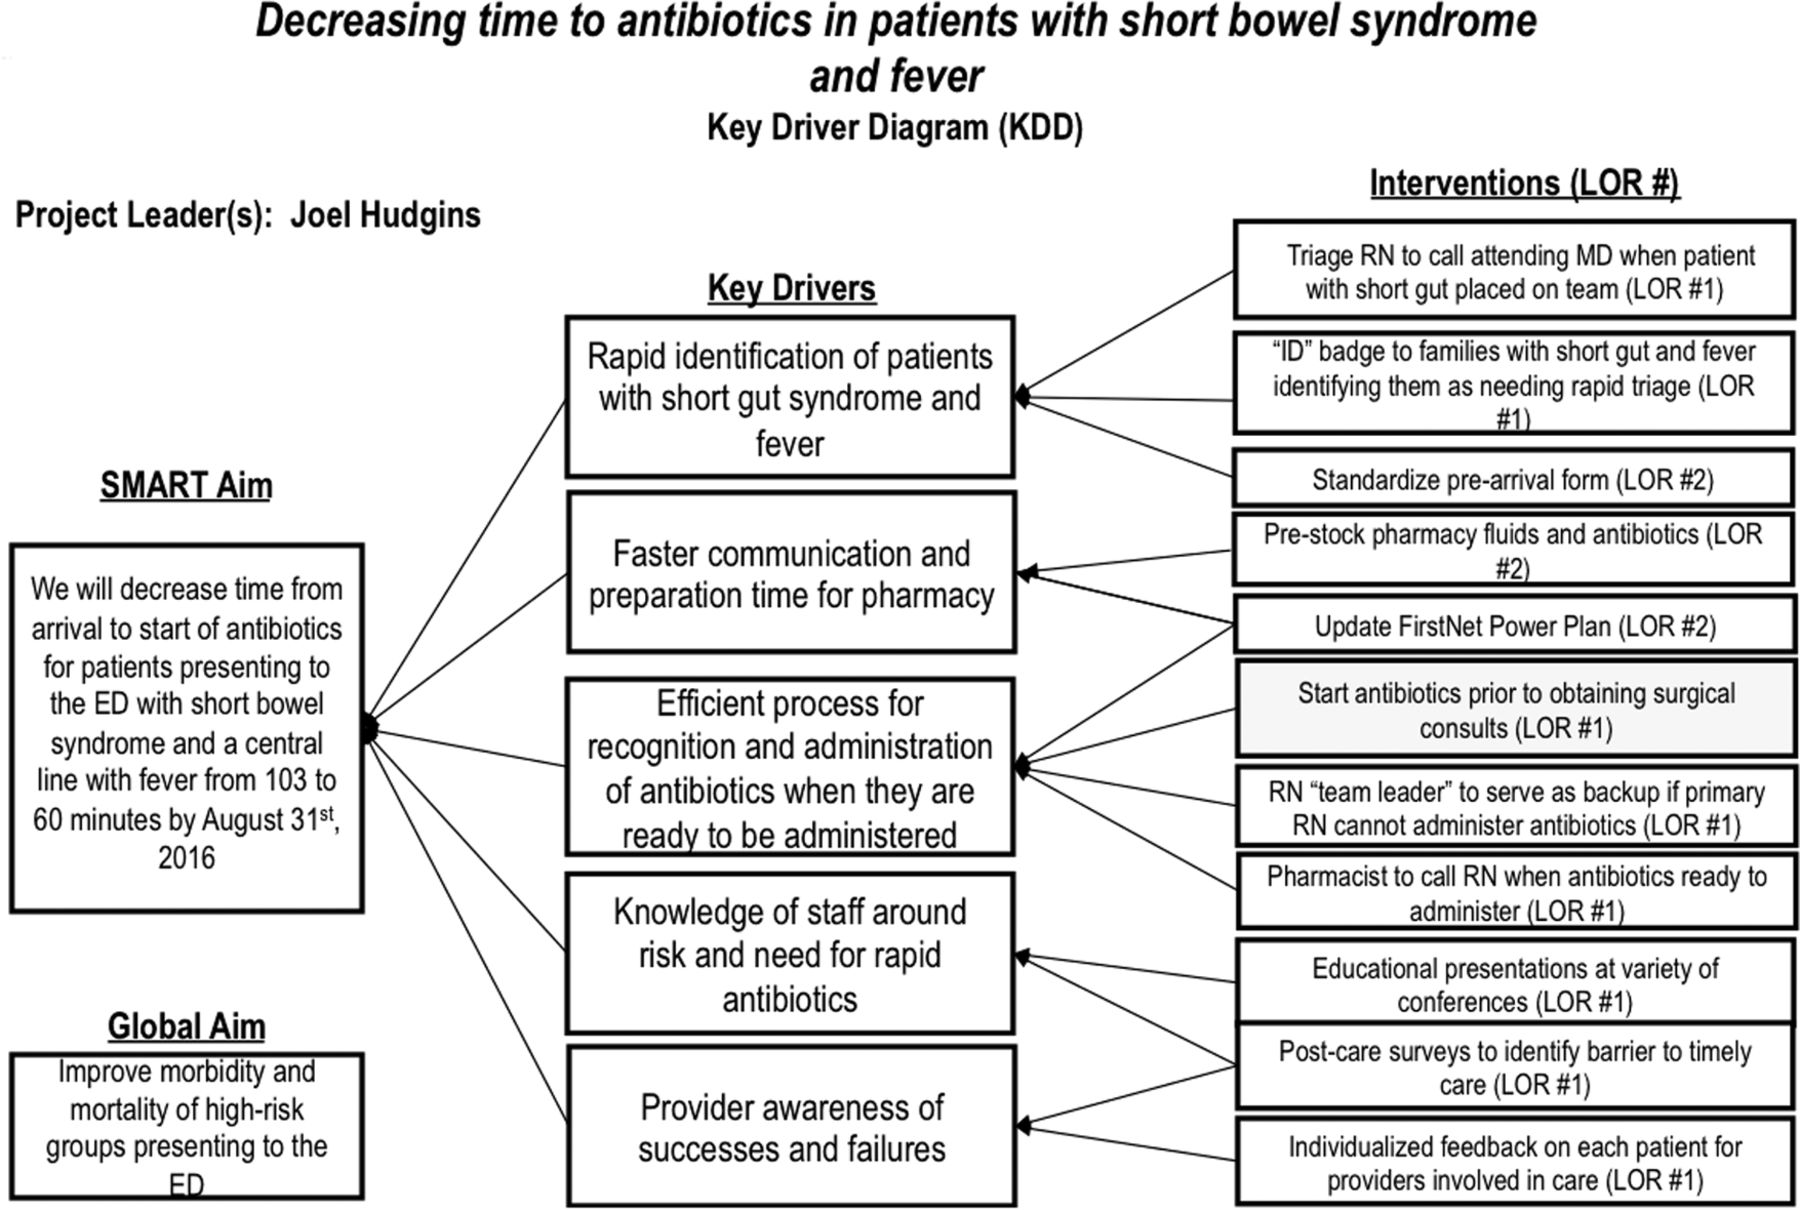
Methods We used the Model for Improvement and assembled a multidisciplinary team to identify key drivers. Failure mode effects analysis (FMEA) and Pareto charts identified and quantified process improvement opportunities. Providers were informed of the initiative through education at conferences, posters in the ED, and emails from the intervention team. Interventions included streamlining of the electronic order entry, pre-arrival, and subspecialty consult processes.
Our process measure was time to antibiotics and our outcome measure was ED length of stay (LOS), both of which were extracted from an electronic data warehouse and verified by manual chart review. Rates of hypoglycemia were the balancing measure. Analysis was performed using statistical process control.
Results Mean time to antibiotics was reduced from 95 to 53 minutes in the post-intervention period, and ED LOS was reduced from 302 minutes to 170 minutes. Both measures showed narrowing of control limits. There was no change in rates of hypoglycemia.
Conclusions In patients presenting to the ED with SBS, central access, and fever, time to antibiotics, process variability as reflected in narrower control limits, and LOS were reduced significantly through a formal improvement process.⇓⇓⇓⇓
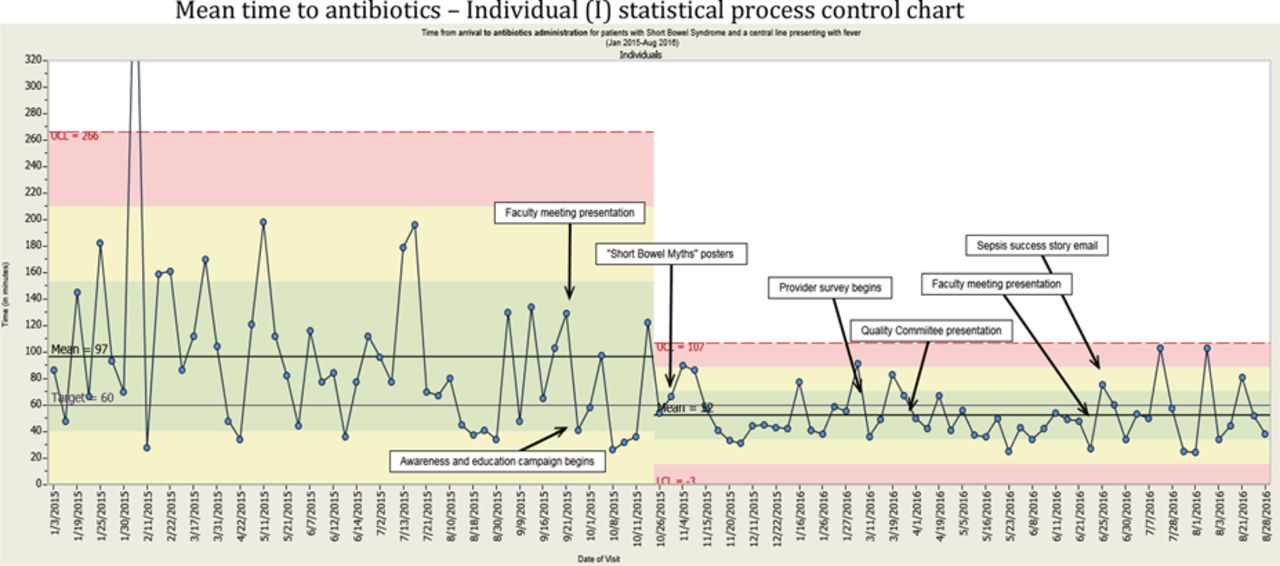
Mean time to antibiotics – Individual (I) statistical process control chart.
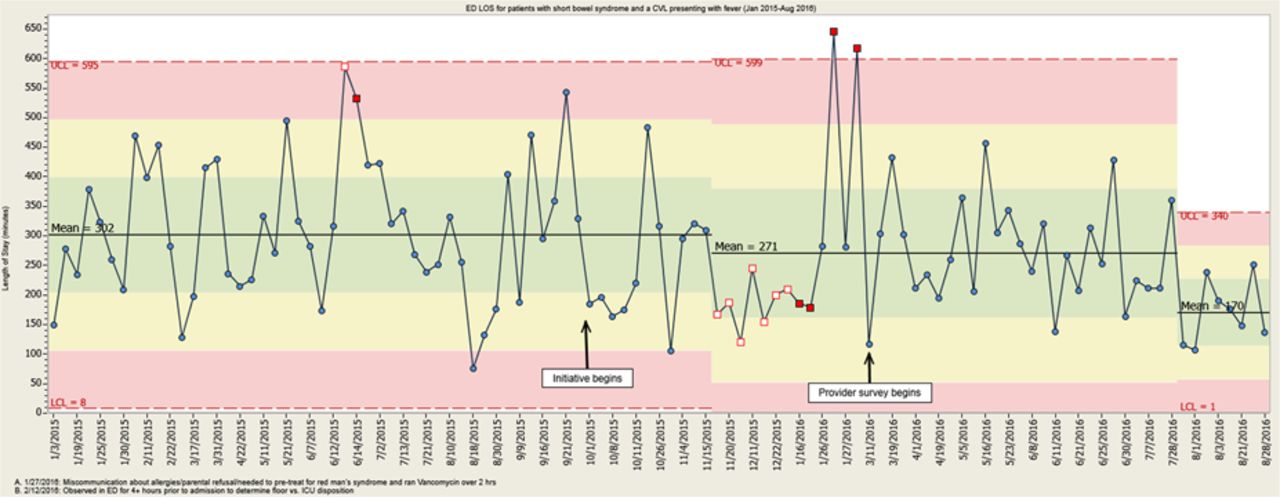
ED LOS – Individual (I) statistical process control chart.

Key Driver diagram.

Pareto chart.
- Accreditation
- Anaesthesia
- Attitudes