Article Text

Abstract
Objective This paper describes a scoping of adverse event categories and definitions in use across NHS Scotland and makes recommendations about the categories used.
Methods The design involved a network analysis making use of categories and subcategories supplied by 17 different Health Boards via their risk management/clinical governance functions. A total of 128 discrete categories and 1348 subcategories are used across 17 Health Boards (mean number of subcategories used: 164; SD 61; range 56–288).
Results There is some redundancy with around half of all categories (65; 51%) used by one single board and a further 10 (8%) by just two boards. Many health boards use similar subcategories within different categories. This shows conceptual overlap between confounded categories. This overlap has implications for reliability and has been quantified via the network analysis.
Conclusion The eight most frequently used categories across the Health Boards have an average of 14.9 overlaps with other categories, suggesting some degree of variability in how adverse events are captured. This has implications for nationally collated data; however the formal links between categories identified in this work offer the opportunity of reliable data extraction at national level without substantial recoding by individual Health Boards.
- Adverse event
- reliability
- risk management
Statistics from Altmetric.com
Introduction
NHS Quality Improvement Scotland (QIS) became responsible for patient safety in Scotland when established in 2003. As part of this responsibility, NHS QIS commissioned a review of incident and near-miss reporting in Scotland, termed ‘Safe Today Safer Tomorrow.’1 Key findings included a lack of contextual factors in datasets and no formal mechanism for sharing information from national systems. In England, the Department of Health documents a lack of systematic learning from errors in the NHS and difficulty in aggregating incident data,2 and across the UK the National Audit Office has stressed that there are still opportunities to improve learning at a regional and national level.3
International initiatives
The WHO introduced a programme to develop an International Patient Safety Event Taxonomy in 2005. A goal is to develop a ‘logically oriented hierarchical framework of concepts and definitions designed to translate patient safety incident data collected from a range of sources into a standardised common terminology.’4 The WHO International Classification for Patient Safety (ICPS) draws on a range of international work and systems including those of the National Patient Safety Agency (NPSA) and the Australian Advanced Information Management System (AIMS) as well as WHO classifications in the area of disease and health-related problems.5 ,6
Reporting systems and taxonomies
Taxonomies of adverse event codes should allow for reliable data retrieval via a set of mutually exclusive categories.7 Confounds between categories mean that patterns and trends are obscured by a lack of intercoder reliability.8 Studying reliability traditionally involves comparisons between classificatory choices and is a prerequisite for the validity and usefulness of any event classification system (see Analysis).9–12
Adverse event collation in NHS Scotland
There are 14 Health Boards in Scotland with a geographical remit and seven Special health Boards with national coverage (eg, NHS 24, Scottish Ambulance Service). Most Health Boards in Scotland have or are moving towards a single reporting system for adverse events. Most managers have recently reviewed or altered the specific set of codes that can be assigned. Adverse events are coded via a two-level database organised with main categories (eg, Medication Errors) each containing nested subcategories (eg, Prescription Error, Dispensing Error).
AIMS
This paper describes a scoping study which was commissioned to clarify how data on adverse events are captured across NHS Scotland. Specific aims were to compare Health Board frameworks to identify commonalities and differences, and to comment on core data which might be useful at national level, in light of a current lack of national collation and learning.13
Methodology
Initial contacts and interviews
Twenty NHS QIS Liaison Coordinators were contacted with a view to gaining access to adverse event reporting categories and definitions. A total of 21 interviews across 19 Scottish health boards were conducted from November 2007 to February 2008, to explain the project and gather adverse-event coding data. Interviews were conducted either on the phone at a time convenient to the individual or face-to-face on site. Interviewees included risk managers, software system administrators, clinical governance managers, team leaders and adverse-event managers.
Scope
There were 15 geographical boards at the time of the study (before the merger of Highland with Argyll and Bute). After interview, coding frameworks were received from 14 of 15 geographical health boards (one board was in the middle of a change of system). Three special health boards had systems suitable for comparison—Scottish Ambulance Service, State Hospital Board for Scotland and the National Waiting Times centre Board—giving 17 coding frameworks in total for analysis. Special Boards who did not have a comparable adverse event coding framework were NHS 24, NHS Education for Scotland, NHS Health Scotland and NHS QIS.
Software
While this paper is concerned with coding logic, it can be noted that most boards (14/17) used Datix commercial risk management software to facilitate such coding,14 with two boards using a bespoke system and one using Safeguard software.15 Datix contains a Common Classification System for adverse events, which leads to some standardisation; however, all boards have imported historical frameworks or altered codes to suit their own purposes. Where coding choices are flexible, use of the same software cannot in itself determine the reliability or otherwise of coding frameworks.
Eight boards have fully electronic systems, with a further four moving towards this. All staff can report events through the available adverse-event system. For web-based systems, reports are fed directly into the software, and actions are often automatically flagged or the report automatically sent to a line manager and/or the risk management/clinical governance team. With paper systems, reports are usually transferred to electronic format and coded by a member of a risk-management team. Reports and codes are verified by a supervisor or line manager.
Analysis
Seventeen coding frameworks were received after interview and arranged in Predictive and Analytic Software v17.0 (PASW, formerly SPSS, Woking, Surrey, UK). This software is widely used for epidemiological work and its use allowed for ease of comparison between categories and subcategories used across health boards.16 Each set of categories and subcategories was entered and compared with previous sets until all data from the 17 boards were cross-tabulated to build a network model of the entire ‘NHS Scotland’ dataset. Categories and subcategories were examined and compared via semantic meaning, and definitions employed rather than simply by their ‘label,’ so that conceptually similar examples were counted as a ‘match’ (eg, Inappropriate Behaviour and Aggression).
A network-based methodology was then implemented to test the hypothesis that the categories used to classify adverse events were mutually exclusive (ie, the frameworks would facilitate reliable coding at category level). The method was based on cross-referencing all available subcategories, to quantify the extent to which each category was exclusive or otherwise of all others. MS Node XL statistical software17 was employed to graphically illustrate how categories are interlinked and to calculate the degree of interconnectedness of categories via their common subcategories (Microsoft, Seattle, Washington). The software allows for quick visual scanning of a set of categories to ascertain which are discrete and which are overlapping.
Results
The methodology allowed for the identification of 128 discrete categories across the 17 health boards. Frequencies of category use by health boards are shown in figure 1.

Frequencies of categories used across NHS Scotland (17 health boards; 128 discrete categories).
It can be seen from figure 1 that around half of all categories (65; 51%) are used by one single health board, and a further 10 (8%) by just two health boards. Categories for events used by one single health board (n=65) include Child Protection, GP-Related, Smoking and Diet. The reference line shown is set after the 33 most-used categories (those used by at least six health boards). Together, these make up exactly two-thirds of this dataset (331 out of 495 data points; 67%). These include the common categories Security (16 health boards), Medication (16), Slip, Trip or Fall (15) and Equipment (13). Eleven of the 17 Health Boards used more than half of this ‘core dataset,’ with 10 boards using 19 or more categories from this set.
Nested within these 128 categories were a total of 1348 discrete subcategories, which show a similar pattern. Around two-thirds of all subcategories (866; 64%) are used by one single health board and a further 204 (15%) by just two health boards. The 17 boards use an average of 164 subcategories (range 56–288; SD=61).
ICPS data categories
There are 15 top-level incident type categories in the ICPS. Nine of these are in the core NHS Scotland dataset, and four of the five most common adverse event categories across boards are listed in the ICPS as incident types (Violence/Inappropriate Behaviour, Medication, Slip Trip or Fall, Equipment). It should be noted that the Scottish categories are not arranged in a conceptual framework as in the ICPS. Thus, adverse event categories and subcategories in the Scottish dataset do not necessarily relate to incident types in the ICPS but may map onto other major classes such as contributing factors (eg, communication factors) or incident characteristics (eg, disciplines or people involved).
Network analysis
It is important to stress that the NHS Scotland categories overlap conceptually in terms of the subcategories they contain. Figure 2 shows a network model of the 128 categories. The model contains points (vertices) and lines between points. Categories appear as vertices, and the connecting lines represent links between categories. For example, a link between Security (16 Health Boards) and Vehicles (six Health Boards) is established because both contain subcategories for Vehicular Security.

Network model showing links between 128 category vertices based on an analysis of their 1348 subcategories.
It can be seen from figure 2 that there are many (n=247) confounds between categories (eg, the labelled categories Exposure and Contact are linked). If categories were discrete, there would be no lines in the model, that is all categories would appear as single point vertices (there are 31 such categories (eg, the labelled Buildings category), which contain no subcategories that can be found elsewhere in the network). Put simply, each line in the graph represents a problem for categorical reliability.
Betweenness Centrality (CB) is a measure of how often a category appears on the shortest path between other categories in the network. For a graph G:=(V, E) with n vertices, the CB (v) for vertex v is: where σst is the number of shortest geodesic paths from s to t, and σst (v) is the number of shortest geodesic paths from s to t that pass through a vertex v. Table 1 shows the 10 categories scoring highest for CB.
Top 10 categories for betweenness centrality with number of links to other categories (degree)
It can be seen from table 1 that most of the categories scoring highest for CB are used by the majority of Health Boards. It is not surprising that the Other category scores highest, as it by definition gathers subcategories which might reasonably appear elsewhere. The overall correlation between number of health boards using a category and its CB is 0.472** p<0.001 (n=128). Exceptions are the categories Clinical and Resources, which are not widely used but are key nodes for connecting between areas in the coding network. The number of connections each category has (Degree) is also predicted by its use by more health boards (n=128, 0.571**; p<0.001).
This shows that categories which are conceptually ‘fuzzy’ (in that they have subcategories which may appear elsewhere) are the most attractive to Health Boards looking for subcategory groupings (see Discussion).
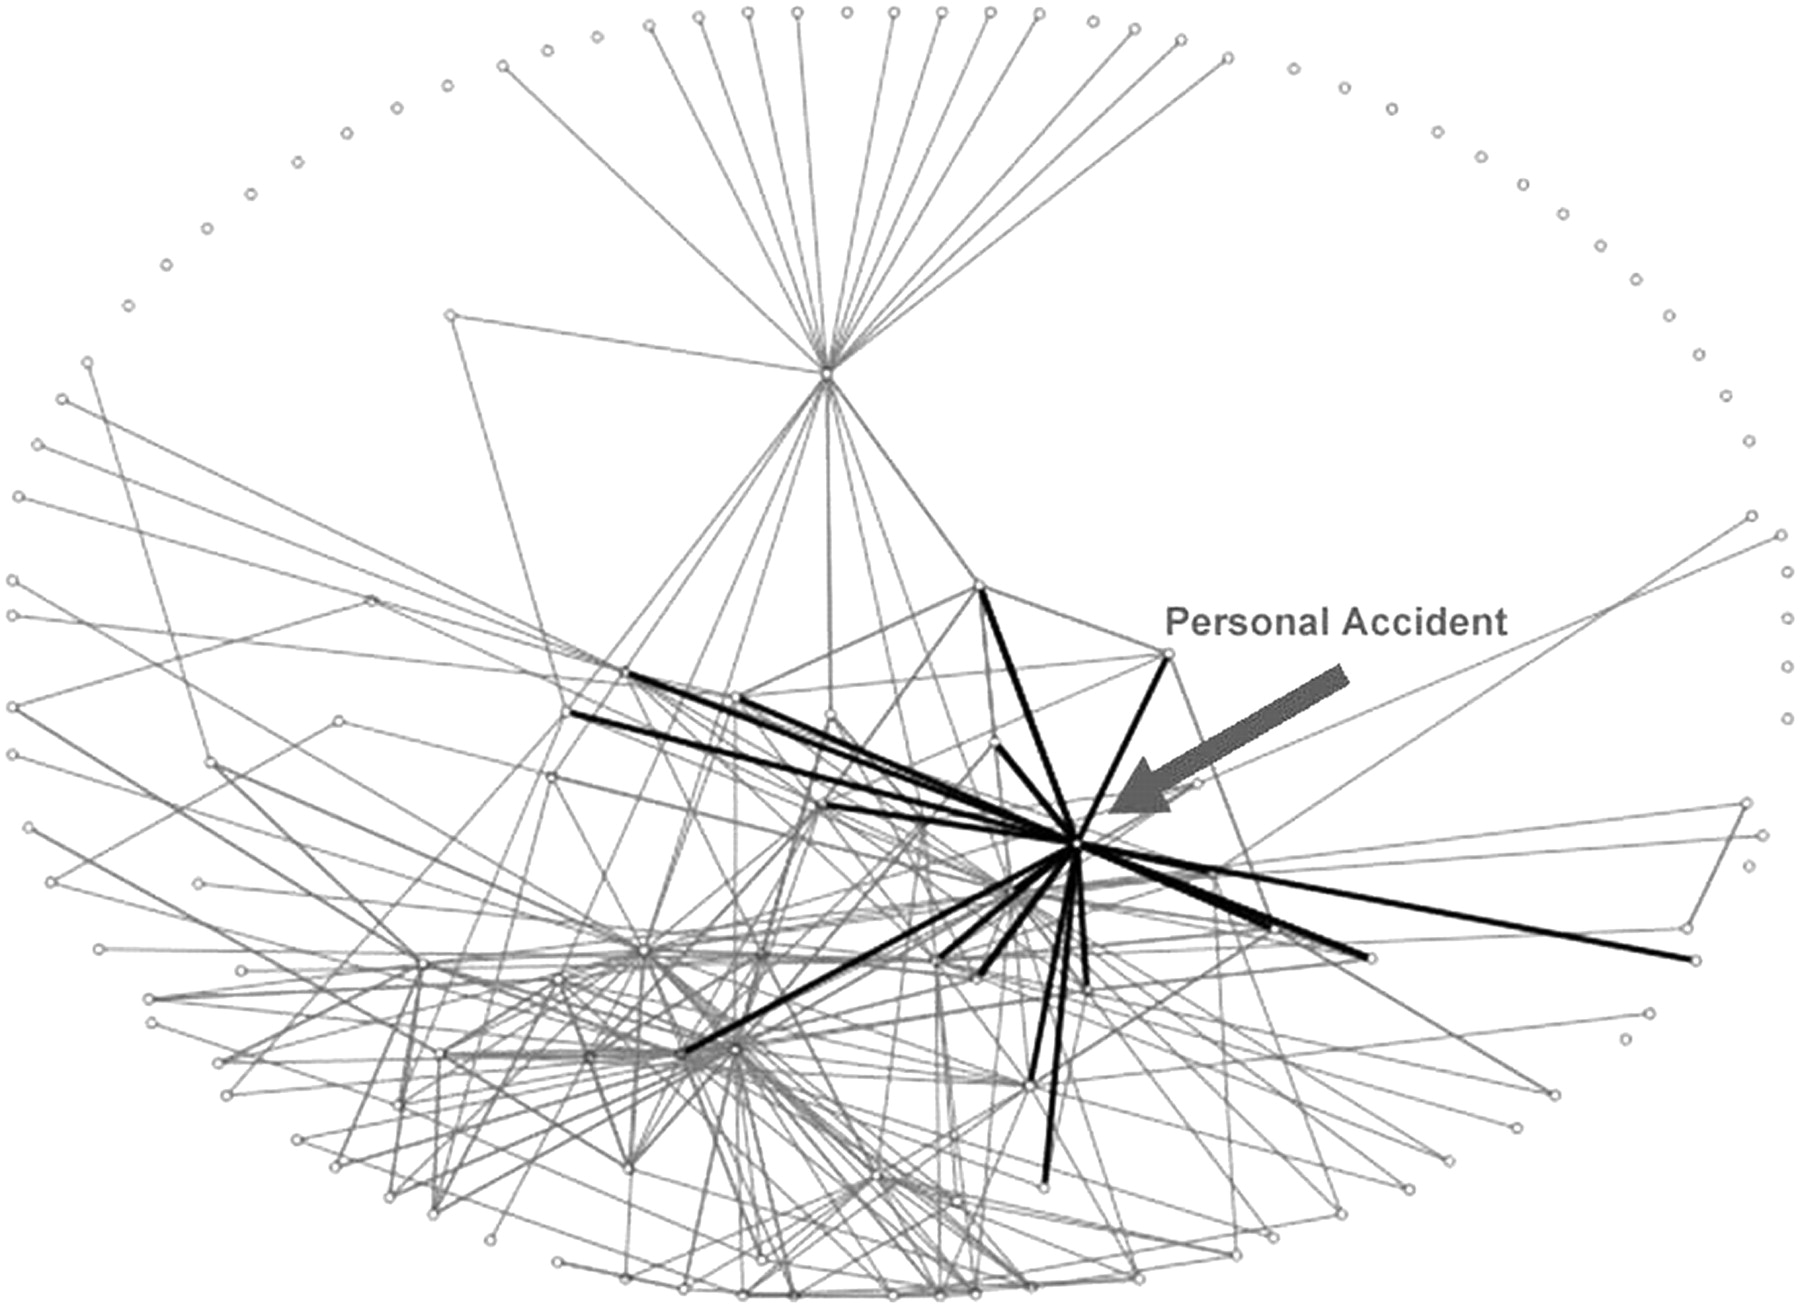
The correlation between the Degree (number of connecting lines) and CB is 0.791** (p<0.01). Thus, those categories with many links form a central part of the network (as might be expected). However, centrality is also in part a function of subtle differences between categories in respect of the interconnectedness of the network as a whole. Note, for example, how Infection Control scores much higher on CB (it appears on the shortest path linking many categories) than Personal Accident, despite these categories having the same degree score (number of overlapping codes in other categories). Figures 3, 4 show these two particular categories highlighted.
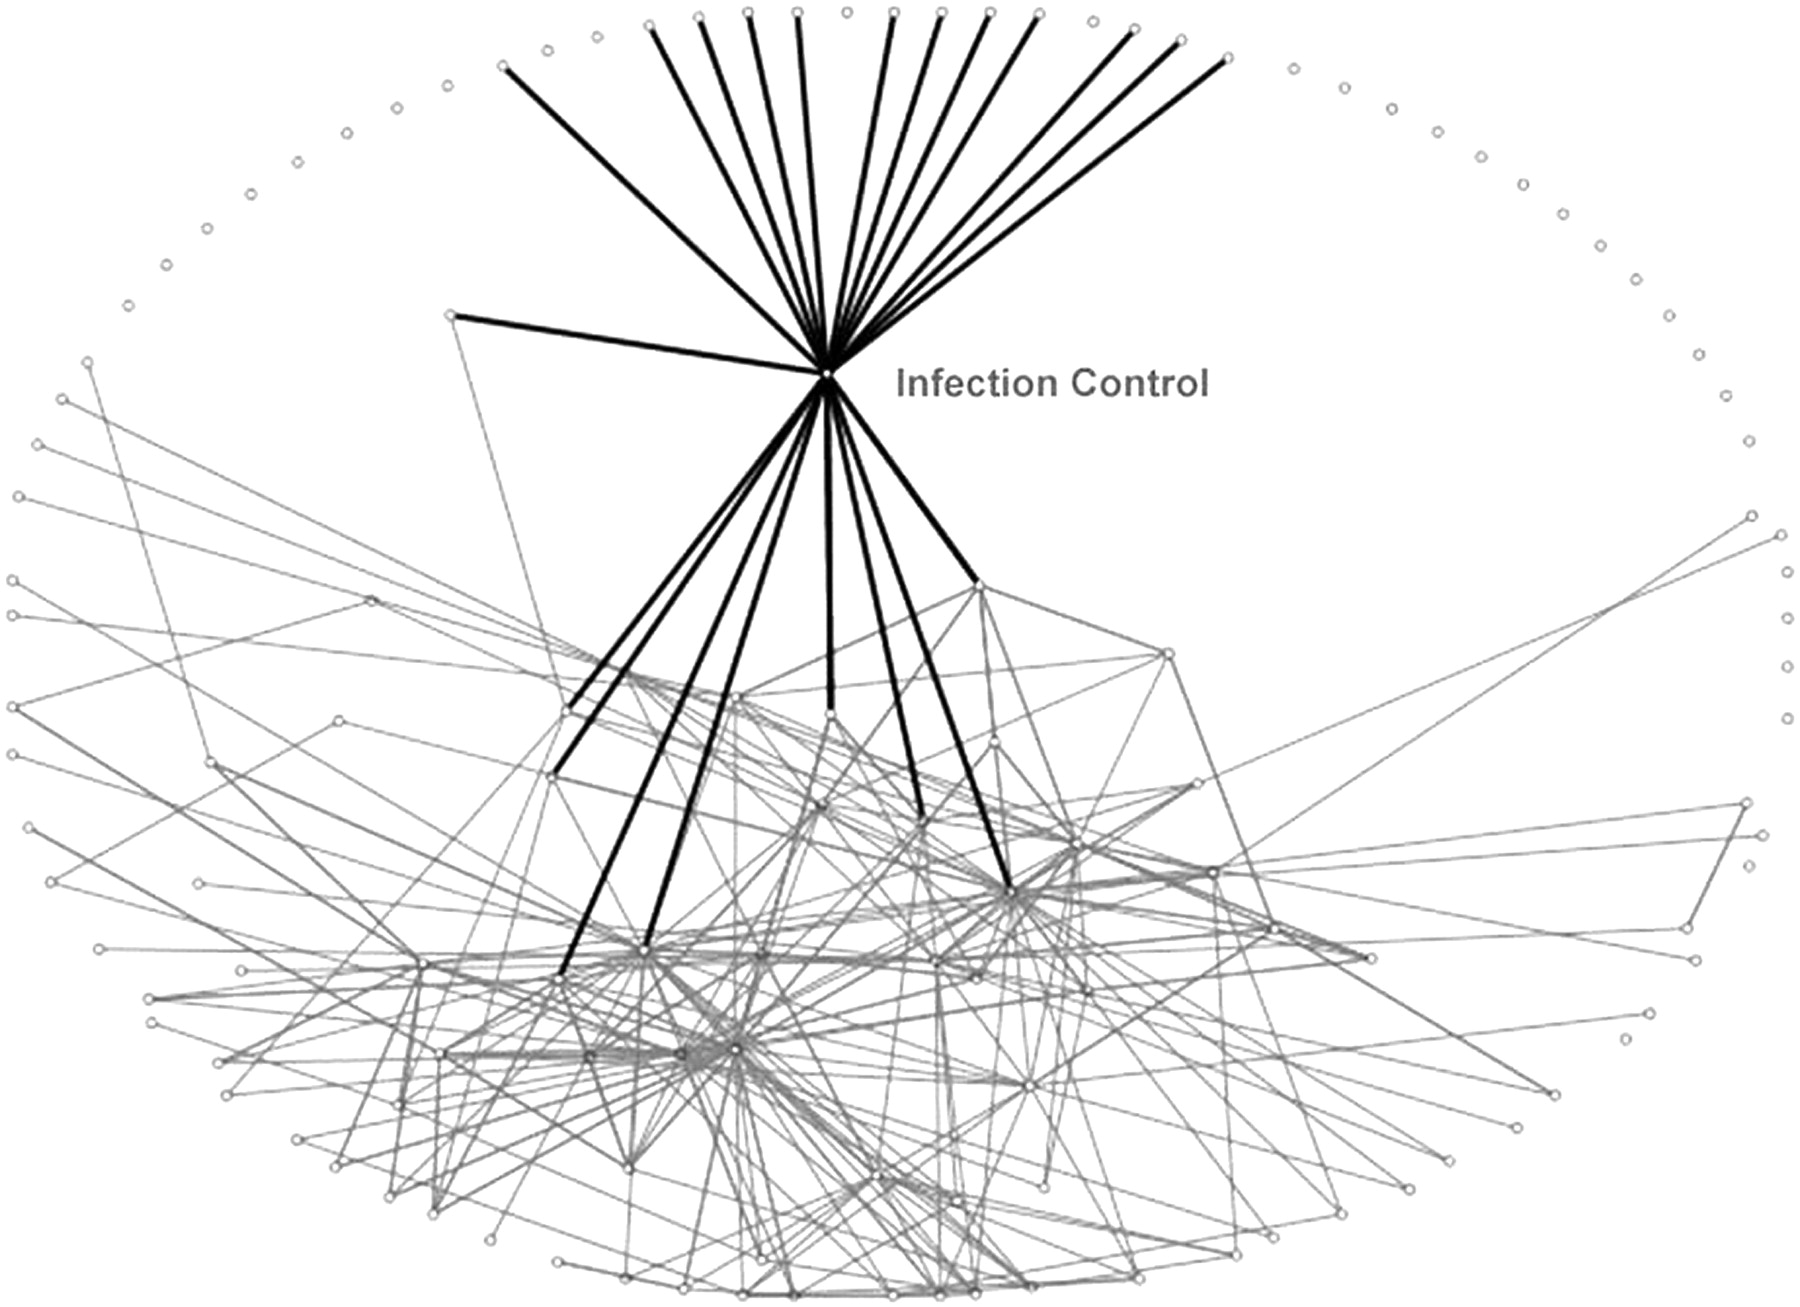
Infection Control category and its links to other categories.

Personal Accident category and its links to other categories.
It is possible to contrast these categories visually. Infection Control links to a greater proportion of categories that would otherwise be discrete (these are mainly types of infection, eg, Respiratory Conditions, Food Borne Infection, Blood Borne Virus). It thus shortens the distance between these and other categories. Personal Accident, while having as many overlaps, links often to categories which themselves have links (ie, they can be linked directly without ‘going through’ the Personal Accident category).
Discussion
Categories and subcategories across NHS Scotland
Examination of NHS Scotland adverse event categories shows a core dataset of categories used by most health boards together with a long list used by just one or two (figure 1). A network analysis of formal, quantifiable relationships between categories shows that the more a category is used across the health boards, the more it is likely to overlap with other categories (ie, the more conceptually ill-defined or ‘fuzzy’ it is).18 This is of interest, as one might otherwise assume that any move towards a national core data set would be best served by simply picking the categories that most people use. It is also not as counterintuitive as it may first seem. It has been argued, for example, that the ubiquity of ‘human error’ as an assigned code for adverse events might arise precisely because the term defies definition.19
Figure 3 shows that there are logical confounds across NHS Scotland in the way subcategories are organised into general categories. Each line represents a case where there is disagreement on what general category (class of adverse event) a given subcategory should fall under. For example, Patient ID problem appears under at least the following categories: Communication; Clinical assessment; Patient information; Work environment; Documentation; Medical records; Infection control; Test results; Implementation of Care. In most health board systems, this code must be chosen where it appears, that is, it can contribute to only one category of adverse events. This complicates any collation of data at a national level because frequencies of adverse events in different categories might involve precisely the same phenomena. Inter-rater reliability of adverse event classification20 is by definition problematic if coding choices are not agreed upon to begin with.
Reliability in other areas
It is worth noting that taxonomic problems with adverse event coding have been reported across many industries, for example with police accident databases, rail accident frameworks and nuclear incident codes.21 The ongoing importance of reliable coding is also recognised in many areas where clinical judgement is required22–24 and with specific clinical nomenclatures,25 Stausberg et al used Kappa coefficients to evaluate diagnosis via ICD-10 and reported ‘significant uncertainties even for experts.’26
External compatibility
In general, classes outlined in the WHO ICPS are covered across the NHS Scotland dataset, though not all classes are covered by all boards. There is generally high compatibility with WHO ICPS for incident types, and less for contributory factors (specifically cognitive and performance factors).
The WHO ICPS introduces a long list of preferred terms. Many are drawn from the wider human factors and organisational literature including: Hazard; Risk; Near Miss; Contributing Factor; Mitigating Factor; Degree of Harm; Organisational Outcome. One foreseeable barrier to compatibility with the ICPS is the degree of input required to learn to negotiate these more abstract ideas. The NHS Scotland datasets tend to have codes designed to log things which are observed to go wrong in the NHS Scotland context within given specialities, such as uterine inversions, people falling from chairs, outbreaks of infection, clinical effects of hypoxia, etc.
National learning is possible without the sacrificing of clinical specificity or conceptual clarity, but this will rely on agreement as to what can constitute an adverse event/contributing factor and a reliable structure for logging incident characteristics and/or outcomes.27
Extracting subcategory data found under different categories
It is often assumed that data extraction can only be standardised (made reliable) across different subsystems if people are required to use the same (or similar) top-level categories. Individual subcategory variability can then be surmounted by extracting at the category (ie, more general) level (though this raises the problem of specificity/generality of findings which may not be useful where detail is required). In fact, it is possible to extract data across systems where categories (frameworks) are different, but individual subcategories (phenomena being observed) are matched (figure 2). Now that the scoping exercise has been undertaken, data for matched subcategories can be extracted across boards, no matter which category they are found in. This offers the possibility of national data collation without the requirement for substantial changes to local coding.
References
Footnotes
Funding This work was funded by NHS Quality Improvement Scotland.
Competing interests None.
Provenance and peer review Not commissioned; externally peer reviewed.