Article Text

Abstract
Objectives To study the extent and execution of redundant processes during inpatient transfers to Radiology, and their impact on errors during the transfer process; to explore the use of causal and reliability analyses for modelling error detection and redundancy in the transfer process; and to provide guidance on potential system improvements.
Methods A prospective observational study at a metropolitan teaching hospital. 101 patient transfers to Radiology were observed over a 6-month period, and errors in patient transfer process were recorded. Fault Tree Analysis was used to model error paths and identify redundant steps. Reliability Analysis was used to quantify system reliability.
Results 420 errors were noted, an average of four errors per transfer. No incidents of patient harm were recorded. Inadequate handover was the most common error (43.1%), followed by failure to perform patient identification checks (41.9%), patient inadequately prepared for transfer (7.4%), inadequate infection control precautions (2.9%), inadequate clinical escort (2.1%), inadequate transport vehicle (2.1%) and equipment failure (0.2%). Four redundant steps for communicating patients' infectious status were identified (reliability=0.07, 0.37, 0.26, 0.31). Collectively, these yielded a system reliability of 0.7. The low reliability of each individual step was due to its low rate of execution.
Conclusions Analysis of the transfer process revealed a number of redundancies that safeguard against transfer errors. However, they were relatively ineffective in preventing errors, due to the poor compliance rate. Thus, the authors advocate increasing compliance to existing redundant processes as an improvement strategy, before investing resources on new processes.
- Safety
- patient transfer
- reliability engineering
- redundancy
- risk analysis
- reliability
- risk management
Statistics from Altmetric.com
Introduction
Redundancy is a system design principle that introduces duplicate components to provide fault tolerance. When a component fails, a backup takes over to ensure the system still performs as designed. Introducing redundancy enables a system's overall reliability to be enhanced without needing to increase the reliability of individual components. Adding redundancy is analogous to adding an extra layer of defence in Reason's Swiss Cheese Model.1 The more defences there are, the more likely errors will be caught.
This principle of defence-in-depth is widely used in many high-risk industries2 and some clinical processes. Unfortunately, in healthcare, redundancy is often introduced without the rigorous analysis that is performed in other industries, making it difficult to understand how well it contributes to overall system performance, or how it might be optimised.
Pretransfusion bedside checks are a common example of designed redundancy in a clinical process.3 The check commonly involves multiple redundant steps, each providing an opportunity to catch patient identification errors. Yet, weaknesses in the performance of bedside check are the most common cause of transfusion error.4–7
The objective of this study is twofold. First, as redundancy is poorly explored in clinical processes, we study the extent and apparent effectiveness of system redundancy in a common and high-volume clinical process—inpatient transfers to Radiology. Second, to theoretically underpin our observations, we used fault tree and reliability analyses methods from safety engineering, to model error detection and redundancy in this clinical process. We hypothesise that applying such techniques can provide us with a systematic understanding of the safety of transfer process, and can guide process redesign.
Methods
Data collection
A prospective observational study was undertaken at a 440-bed metropolitan teaching hospital, with an average occupancy rate of over 90%, and over 3000 staff members. Patient transfers to Radiology were observed over a 6-month period (February to July 2009). The total number of transfers to Radiology from the wards over this period was about 9600, a daily average of about 80. Approval to undertake the study was granted by the hospital's ethics committee.
The study was conducted in two phases. In an initial pilot, 20 transfers were observed in order to understand the information and process flow of the transfers. All porters working for Radiology (n=8) were shadowed unobtrusively through the transfer journey by a researcher (MO). Transfer errors, defined as action or inaction that deviates from safe practices in patient management, were identified. These errors could potentially result in patient harm. Subevents leading to these errors were also identified. Data from this phase guided design of a structured observational instrument and were not used in further analysis.
In the second phase, the same porters were observed over a convenience sample of 101 transfers, covering transfers from morning to evening Monday to Friday, using the structured observational tool. Transfer errors and events leading to them were recorded. Inter-rater reliability analysis was performed by a second observer shadowing alongside the first for 12 transfers. Descriptive statistics were calculated from the observed data.
Analyses
A model of the patient transfer process was developed, based upon Phase 1 observations. Data collected were then analysed using Fault Tree Analysis (FTA) and Reliability Analysis. The purpose of FTA was to model the causes of transfer errors, and to identify existing redundant safeguards against these errors. Reliability Analysis was used to model the relationship between the redundant components, and their impact on overall system reliability.
Patient transfer process
Patient transfers are scheduled by a coordinator at Radiology (figure 1). Transfer begins when the coordinator instructs a porter to transfer a patient. A transfer form is given to the porter, containing information about the patient, including patient name, date of birth, medical record number, ward name, intended procedure, appropriate mode of transport, escort and oxygen requirements during transport, and any infection control precautions. Patient needs may additionally be communicated to the porter verbally.
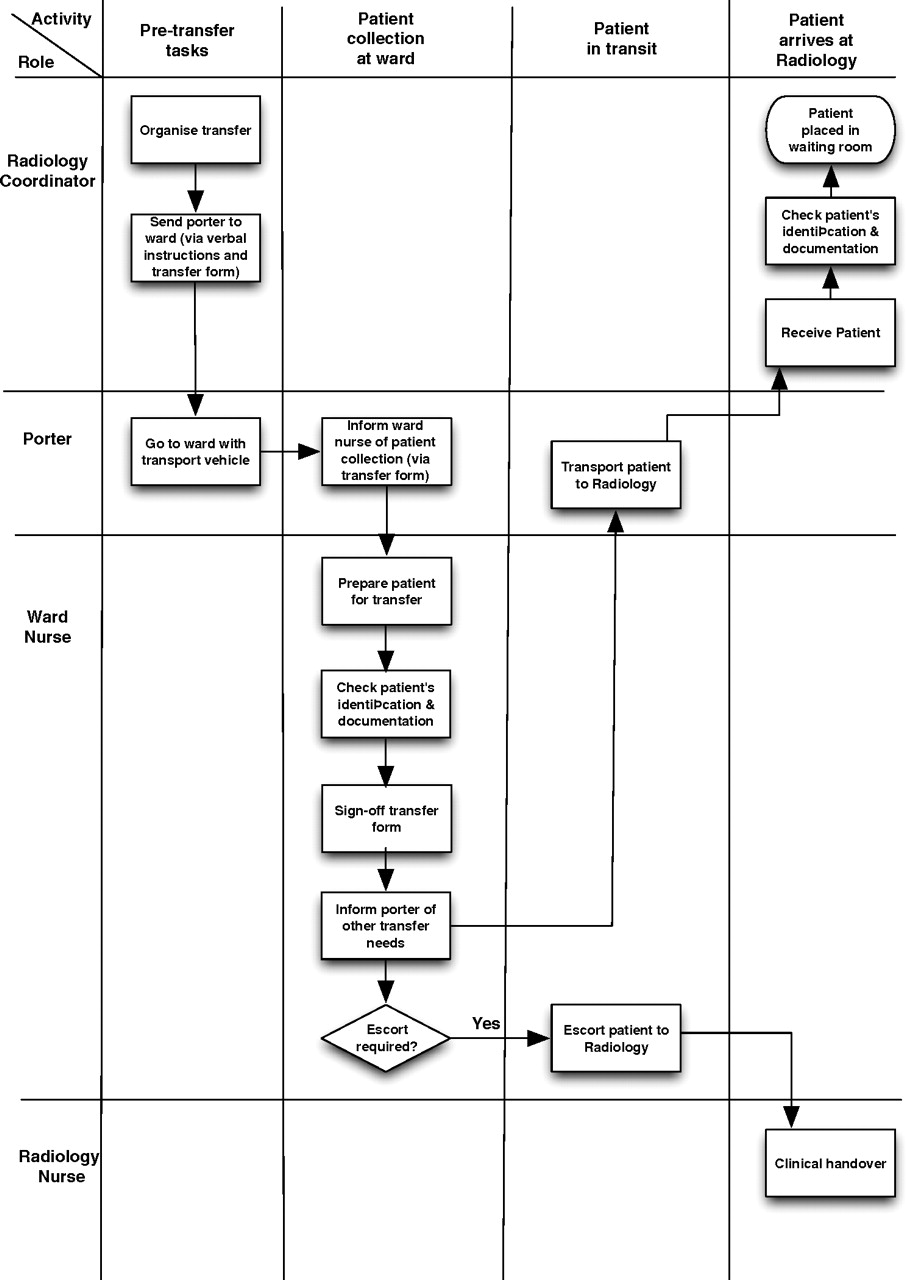
Process map of the patient transfer process.
On arrival at the ward, the form is handed over for sign-off by a nurse. The sign-off procedure requires verification of the patient's identification, documentation and the correctness of the information in the transfer form. The ward nurse may additionally communicate the patient's transfer needs to the porter verbally. When the patient arrives at Radiology, the transfer form is handed back to the coordinator, who again verifies the patient's identification. If the patient is escorted by a ward nurse, a clinical handover will take place between the ward and Radiology nurses.
Fault tree analysis
FTA is a top-down approach, where errors are first identified and then connected together in causal chains to prior events that contribute to the error.9 Individual events are connected by simple logic gates. There are two basic gates—the AND gate and the OR gate. The AND gate requires all input events to occur before the output event can occur. The OR gate only requires that any one of the input events occurs for the output event to be triggered. When all logic gates are assembled together, the result is a hierarchical fault tree, with the error at the top of the tree, and the root causes of the error forming the leaves (figure 2). Each path in the fault tree thus represents a possible error path. When the likelihood of occurrence of all subevents is known, the likelihood of occurrence of the top event can also be computed.
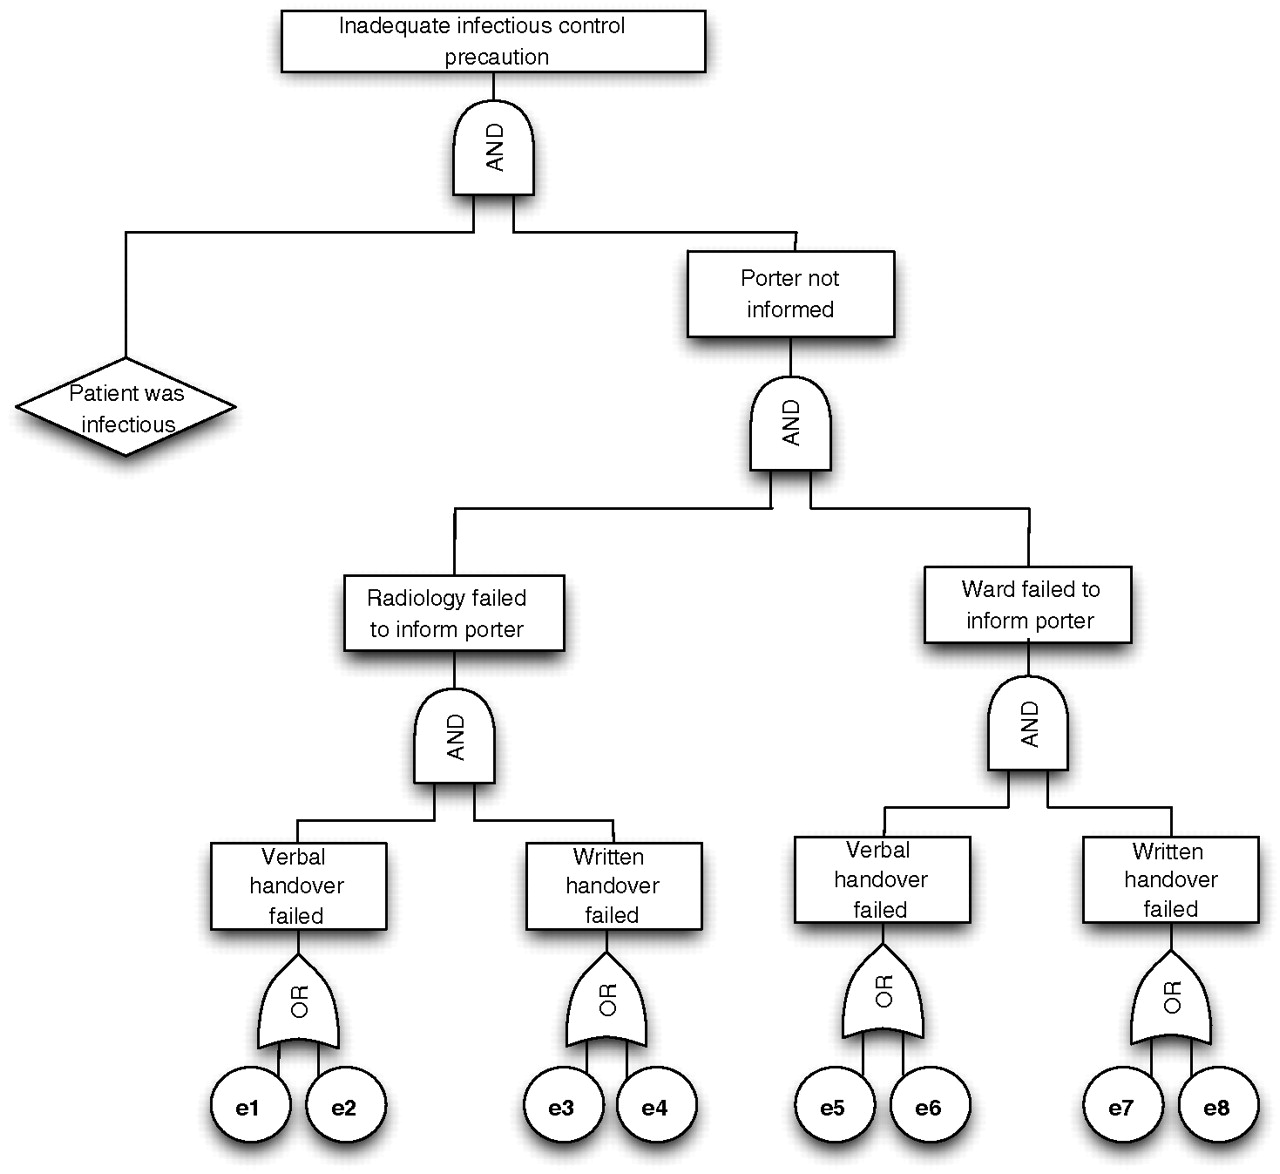
Fault Tree Analysis of patient transfers without infection control precautions, where e1=patient's infectious status was not communicated during verbal handover at Radiology; e2=patient's infectious status was communicated during verbal handover at Radiology, but failed to prevent error; e3=patient's infectious status was not communicated through written handover at Radiology; e4=patient's infectious status was communicated through written handover at Radiology, but failed to prevent error; e5=patient's infectious status was not communicated during verbal handover at the ward; e6=patient's infectious status was communicated during verbal handover at the ward, but failed to prevent error; e7=patient's infectious status was not communicated through written handover at the ward; e8=patient's infectious status was communicated through written handover at the ward, but failed to prevent error.
Reliability analysis
Reliability is defined as the probability that a task will be accomplished successfully within a specified minimum time.9 Reliability Block Diagrams (RBD) are frequently used to model the effect of component failures on system performance.10 Figure 3 depicts the RBD of a system with four redundant components connected in parallel. In such a configuration, the failure of all components results in a system failure, while success of one component would be sufficient to guarantee success of the system. Mathematically, the reliability of this system can be represented as follows:

Redundancy for ensuring patient's infectious status was communicated during patient transfer. Top: reliability block diagram illustrating the redundant steps in the transfer process. Bottom: graph illustrating the relationship between system reliability and unit reliability in the patient transfer process (varying one redundant unit at a time). en refers to error class in figure 2, and Di refers to redundant step in table 3.
The impact of individual component failures on the whole system can be quantified using reliability importance measures. These measures provide a numerical rank to determine which components make the most important contribution to overall system reliability or are more critical to system failure.11 A widely used measure is Birnbaum's component importance, which measures the rate of increase in system reliability with respect to an individual component's reliability, calculated as12:
Comparing the importance measures of different components helps determine which component, if improved, would yield the greatest overall system reliability improvement.
Results
Data
One hundred and one patient transfers to Radiology were observed. No incidents of patient harm were recorded. However, 420 errors were noted, an average of four errors per transfer. One hundred and eighty-one errors were related to inadequate handover of patient information (missing transfer form, omitted or incorrect information in transfer form), 176 were failures to verify that the correct patient was transported, 34 were errors caused by poor organisation (including patient inadequately prepared and failure to organise equipment for transfer), and 31 were errors that occurred during transport (including inadequate infection control precautions, inadequate escort, inadequate mode of transport and equipment failure). Appendix A details definitions for these errors. Twenty-seven of the 101 patients were identified to be infectious, and in 12 of these cases, infection control precautions were not taken. Of the 101 transfers, seven were cancelled, three due to inadequate transport mode, one due to unavailable equipment and three due to inadequate preparation of patient. The inter-rater reliability was strong and calculated as 98% (κ=0.88).
Redundancy analysis
When FTA was used to analyse the causes of transfer errors, it demonstrated significant redundancy in the transfer process. There were two main types of redundancy: informational redundancy and procedural redundancy.
Informational redundancy was used to ensure that porters were informed of the transport requirements, including the mode of transport, appropriate infection control precautions, and any equipment required during transport. This was achieved through verbal and written handovers (via a transfer form), both at Radiology and in the ward, thus providing multiple opportunities for communicating critical information to a porter prior to patient transfer.
Procedural redundancy was used to prevent an incorrect patient being transported. On patient collection, a nurse responsible for the care of the patient was required to verify the patient's identification. On arrival at Radiology, the same identification check was repeated by the Radiology nurse.
However, these redundancies were not enforced, and variably performed (table 1). Of the 420 transfers, only 12 had all fields in the transfer form completed. Identification check prior to patient leaving the ward was not completed in any of the transfers, and on arrival at Radiology, the verification process was completed in only 19 cases.
Errors observed during transport from ward to radiology
Example analysis: inadequate infection precautions during transfers
Figure 2 depicts a fault tree for the events leading to inadequate infection control precautions during transfers. There were four ways to communicate the required infection control precautions to a porter: (1) verbal handover at Radiology; (2) written handover at Radiology using a transfer form; (3) verbal handover at the ward during patient collection; and (4) verification of the transfer form by the ward nurse. If the information was not communicated through any of these means, adequate infection precautions could not be taken (e1, e3, e5, e7 in figure 2). There were also cases where information was adequately communicated, but errors still occurred (e2, e4, e6, e8 in figure 2). Figure 3 shows the corresponding RBD, with each communication process shown as an individual redundant component table 1.
Table 2 shows the observed probability of the base events leading to this error. Based on these data, the model predicts that inadequate infection control precautions occurred in 8% of the transfers (refer to appendix B for detailed calculations). The observed occurrence was 11.9% (95% CI 5.6 to 18.2), indicating that the model provides a fair estimation of the actual likelihood of the error.
Probability of base events (en refers to error class in figure 2)
Table 3 summarises the reliability of each redundant process. Verbal handover at Radiology was the least reliable step in the process (reliability=0.07), while written handover at Radiology was the most reliable (reliability=0.37). Collectively, the four redundant steps yielded a system reliability of 0.7 (refer to appendix C for calculation details). In other words, for every transfer involving an infectious patient, the system had a 70% chance of preventing inadequate infection control errors. Written handover at Radiology had the highest Birnbaum importance index (0.48), and verbal handover at Radiology the least (0.32).
Reliability of the redundant units
Discussion
How effective is redundancy in the transfer process?
Analysis of transfer cases without adequate infection control precautions showed that there were four redundant defences against this error. The reliability of these defences was, however, low. Nevertheless, collectively, they provided a much more reliable process. For instance, if verbal handover at Radiology was the only form of communication, 93% of infectious patients would have been transported without appropriate infection control precautions. Using a transfer form in addition to verbal handover at Radiology reduced the likelihood of error to 59%. Adding verbal handover and written handover at ward further decreased the error rate to 43% and 30% respectively (see appendix C for detailed calculations).
Thus, redundancy in the transfer process did prevent many transfer errors. Some redundant steps were found to be more reliable than others. Verbal handover performed poorly, compared with written handover. Detailed analysis showed that this was not because verbal handover was incapable of catching the errors. Rather, verbal handover rarely took place. When information was communicated using the transfer form, it was often not acted upon. Thus, for both verbal and written handovers, the effectiveness of the redundancy was hampered by poor compliance with the process. Other likely causes of failures included deliberate violations, slips and mistakes by the porters.
Improving unit reliability
There are two factors to consider when deciding on which component to optimise: the effects of improving unit reliability on the overall system reliability and the cost of improving the unit. The former can be estimated using Birnbaum importance measures. Assuming that the cost of improving all units was equal, and there were no side effects, the ranking provided by the Birnbaum index indicates that improvement in written handover at Radiology would yield the greatest reduction in errors, and improvement in verbal handover at Radiology would yield the least. For instance, increasing reliability of written handover at Radiology by 20% would result in an overall system reliability of 0.8. A similar improvement in verbal handover reliability at Radiology would yield an overall system reliability of 0.77 (refer to appendix C for detailed calculations).
Using the values in table 3, we can plot the relationship between unit reliability and system reliability as shown in figure 3. Each curve depicts the effect of varying unit reliability on system reliability, and the slope of the curve represents the Birnbaum index for the component.
Figure 3 also shows how we can improve system reliability using existing redundancy. To attain a system reliability goal of 0.9, we can choose to improve (1) D1 to 0.69; (2) D2 to 0.79; (3) D3 to 0.76; or (4) D4 to 0.77. The decision on which unit to improve will depend on the cost and feasibility of implementing the required changes.
Adding more redundancy
Another system improvement strategy is to add more redundancy into the system. For instance, if another redundant step with reliability value of 0.5 was introduced, system reliability would increase to 0.85 (refer to appendix C for calculation details). Adding another similar unit would further improve system reliability to 0.93. It is, therefore, easy to understand the temptation of introducing more redundancy. However, reliability gains as a result of redundancy are often offset by the resulting increased complexity of system design.
Optimisation strategy for the transfer process
Ultimately, the best optimisation strategy not only depends on the impact of component improvement on the overall system reliability, but also is constrained by the cost and feasibility of the change. In the case of patient transfers, it is our view that improving the reliability of existing redundancy would be the optimal strategy. The reliability of existing redundant components is low, and there is much room for component improvement. Introducing additional steps in the process may increase the workload of the personnel involved, and paradoxically introduce new inefficiencies in the system.
Limitations
There are several limitations to this study. First, we have reported observations of a single process at one hospital. The patterns of errors observed in this systematic convenience sample may be different for different processes, and at other organisations. Next, our assumptions about mutual redundancy of the transfer steps may be unrealistic. There might be complex interactions between the redundant steps. For instance, verbal handover at Radiology may not occur because of an assumption that all required information is provided in the transfer form. Also, nurses at Radiology might not fill all details of the transfer form, knowing that the form would be cross-checked by the ward nurse. This diffusion of responsibility is a common observation in a system that adopts redundancy.12–14
The probabilistic assessment used in this study also has its limitations. The sample size of observations is modest, and the likelihood of some less frequent errors being observed is consequently low. The non-obtrusiveness nature of the observational study also introduced uncertainties in the data. While we were able to observe the existence of infection control measures in the ward such as isolation, and verbal communications of the need for infection precautions, we did not carry out a record review, and so may have systematically underestimated the rate at which infectious state was captured on the transfer form. However, as we were able to determine compliance with known infectious status requirements, this underestimation does not affect observations at later stages in the transfer process.
Conclusion
Causal and reliability analyses of the patient transfer process have shed much light on the effectiveness of the patient transfer process, and areas where improvement is likely to be most beneficial. Many redundant steps were built into the observed process to prevent transfer errors. However, they were relatively ineffective, due to the poor compliance rate. Verbal handovers often did not take place, while information communicated through written handovers was often overlooked. Therefore, we would advocate first increasing compliance with current processes as a quality and safety improvement strategy, before investing resources on new processes.
Acknowledgments
The authors would like to thank the following individuals for their research assistance and support: F Magrabi, J Westbrook, W Wobcke, J Post, S Morris, N Sheerin, S Sheehan, and all the clinicians and allied health workers involved in the study.
Appendix A
Definition of errors during transfers
Appendix B
Calculation of the probability of an infectious patient being transferred without adequate infection precautions
Redundant steps:
D1: verbal handover at Radiology;
D2: written handover (transfer form) at Radiology;
D3: verbal handover at ward;
D4: written handover (transfer form) at ward.
Base events:
e0: patient was infectious.
e1: patient's infectious status was not communicated through verbal handover at Radiology;
e2: patient's infectious status was communicated through verbal handover at Radiology, but error still occurred;
e3: patient's infectious status was not communicated through written handover at Radiology;
e4: patient's infectious status was communicated through written handover at Radiology, but error still occurred;
e5: patient's infectious status was not communicated through verbal handover at ward;
e6: patient's infectious status was communicated through verbal handover at ward, but error still occurred;
e7: patient's infectious status was not communicated through written handover at ward;
e8: patient's infectious status was communicated through written handover at ward, but error still occurred.
P(Ei)=probability that redundant step Di failed
Probability of a transfer without adequate infection control precautions:
Appendix C
Calculation of reliability
Ri=reliability of redundant step Di
System reliability with four redundant steps:
System reliability with D1 only:
System reliability with D1 and D2:
System reliability with D1, D2, D3:
System reliability with all four redundant steps, and an additional redundant step of reliability 0.5:
System Reliability with all four redundant steps, and two additional redundant steps of reliability 0.5:
Improving reliability of verbal handover at Radiology by 20%, system reliability becomes:
Improving reliability of written handover at Radiology by 20%, system reliability becomes:
Footnotes
Funding This research is supported by grants from the Australian Research Council (LP0775532), and NHMRC Programme Grant 568612.
Competing interests None.
Ethics approval Ethics approval was provided by the Prince of Wales Hospital, University of New South Wales.
Provenance and peer review Not commissioned; externally peer reviewed.