Article Text

Abstract
Objectives To perform a systematic review of the frequency of (preventable) adverse events (AE/PAE) and to analyse contributing factors, such as sample size, settings, type of events, terminology, methods of collecting data and characteristics of study populations.
Review methods Search of Medline and Embase from 1995 to 2007. Included were original papers with data on the frequency of AE or PAE, explicit definition of study population and information about methods of assessment. Results were included with percentages of patients having one or more AE/PAE. Extracted data enclosed contributing factors. Data were abstracted and analysed by two researchers independently.
Results 156 studies in 152 publications met our inclusion criteria. 144/156 studies reported AE, 55 PAE (43 both). Sample sizes ranged from 60 to 8 493 876 patients (median: 1361 patients). The reported results for AE varied from 0.1% to 65.4%, and for PAE from 0.1% to 33.9%. Variation clearly decreased with increasing sample size. Estimates did not differ according to setting, type of event or terminology. In studies with fewer than 1000 patients, chart review prevailed, whereas surveys with more than 100 000 patients were based mainly on administrative data. No effect of patient characteristics was found.
Conclusions The funnel-shaped distribution of AE and PAE rates with sample size is a probable consequence of variation and can be taken as an indirect indicator of study validity. A contributing factor may be the method of data assessment. Further research is needed to explain the results when analysing data by types of event or terminology.
- Patient safety
- adverse event
This is an open-access article distributed under the terms of the Creative Commons Attribution Non-commercial License, which permits use, distribution, and reproduction in any medium, provided the original work is properly cited, the use is non commercial and is otherwise in compliance with the license. See: http://creativecommons.org/licenses/by-nc/2.0/ and http://creativecommons.org/licenses/by-nc/2.0/legalcode.
Statistics from Altmetric.com
Introduction
Following the Institute of Medicine (IOM) report ‘To Err is Human’ in 1999, there has been much debate on the true incidence of adverse events (AE), and preventable adverse events (PAE).1 Several studies at national level and with the Harvard Medical Practice Design (see below) have found results for AE up to 16.6%, and for PAE up to 8.4%2–12 of inpatients. Variations in the figures were soon considered, and several systematic reviews have covered this issue.13
Systematic reviews are restricted by the diversity of studies. One strategy to deal with it is to refine research so as to focus on particular healthcare settings or subgroups of endpoints such as medication-related events14–18 or events leading to hospital admission.19–24 Only loose attempts have been made in mapping AE across the total healthcare system comprehensively, however.25–27
The present systematic review aims to specify the overall incidence of AE and PAE across all settings and procedures, so as to describe the influence of heterogeneity factors such as sample size, settings, type of events, terminology, methods of collecting data or characteristics of the study population. We hypothesise that variation of incidence is explained primarily by sample size.
Methods
Search strategy
The present article is part of a broader literature research on the epidemiology of patient safety,28 and looks at papers giving frequencies of AE and PAE as percentages of patients affected. We began with a search in Medline and Embase for studies published between January 1995 and October 2007. Key words (truncated) were: ‘AE*,’ ‘PAE*,’ ‘negligent AE*,’ ‘adverse medical device event*,’ ‘medication error*,’ ‘medical error*,’ ‘near miss*,’ ‘adverse drug event*’ and ‘iatrogenic illness*.’ This search was limited to titles and abstracts. References cited in the studies retrieved were examined in order to identify additional publications.
Articles in English, German, Spanish, French, Portuguese, Danish and Norwegian were considered. Other languages were approved when there was an English abstract containing data essential for extraction. Articles identified were reviewed at full-text level.
Selection
To be included, studies had to meet the following five criteria: (1) original paper; (2) a specified study population; (3) data collected on AE or PAE or both; (4) explicit information given about the study method; and (5) results reported as percentages of patients affected. AE was defined as any patient-related injury caused by clinical management rather than by the underlying disease, and PAE was defined as an AE resulting from error, and therefore avoidable.1 ,2 ,29 Patient populations might represent all patients in an institution, patients related to a defined medical specialty, or patients in an entire sector of care such as drug therapy or nosocomial infections.
A study was considered as an article on a single study population. Papers reporting results from different study populations were regarded as two or more studies. In the case of duplicate publications, only the primary or the one reporting overall results was included. Intervention studies were included with baseline data before the implementation of risk prevention. When several assessment methods were used, we extracted combined results as far as possible. Studies limited to single diseases or isolated procedures were excluded.
Data abstraction
Retrieved studies were assessed independently by two reviewers and controlled twice. Discrepancies were resolved by discussion. Data on the frequency of AE and PAE were extracted. Additional variables were the number of patients included, information on healthcare settings, classification according to types of event and terminology, method of collecting data and patient characteristics. We distinguished between medication-related, procedure-related and all types of events. We also distinguished between AE terminologies used by different authors. Two main groups were discerned. The first group refers to the definition of the IOM, ‘an AE is an injury resulting from a medical intervention, or in other words, it is not due to the underlying disease’.1 The second group apply to the definition due to the WHO of adverse drug events/adverse drug reactions as ‘any response to a drug which is noxious, unintended and which occurs at doses normally used in man for the prophylaxis, diagnosis or therapy of disease’.30 All other definitions were summarised in a third definition group. Among methods of collecting data, we distinguished between chart review, computer-based alerts, direct observation, voluntary reporting, critical incident reporting systems, interviews, clinical surveillance and the analysis of administrative data, usually in the form of codes from the International Statistical Classification of Diseases and Related Health Problems (ICD).31 We chose to distinguish between three types of chart review: prospective, retrospective and the Harvard Medical Design. The latter was developed especially to detect AE and PAE, and consists of a retrospective structured two-staged review process.32 ,33
Quantitative data synthesis
Abstracted data were entered into a Microsoft Access database for further analysis (Microsoft, Seattle, Washington). Frequencies of outcome measures were recorded or calculated as numbers and percentages of patients. Data were rounded to one decimal place. Patient subgroups were totalled, if we were sure that every patient was included only once.
Results
Trial flow
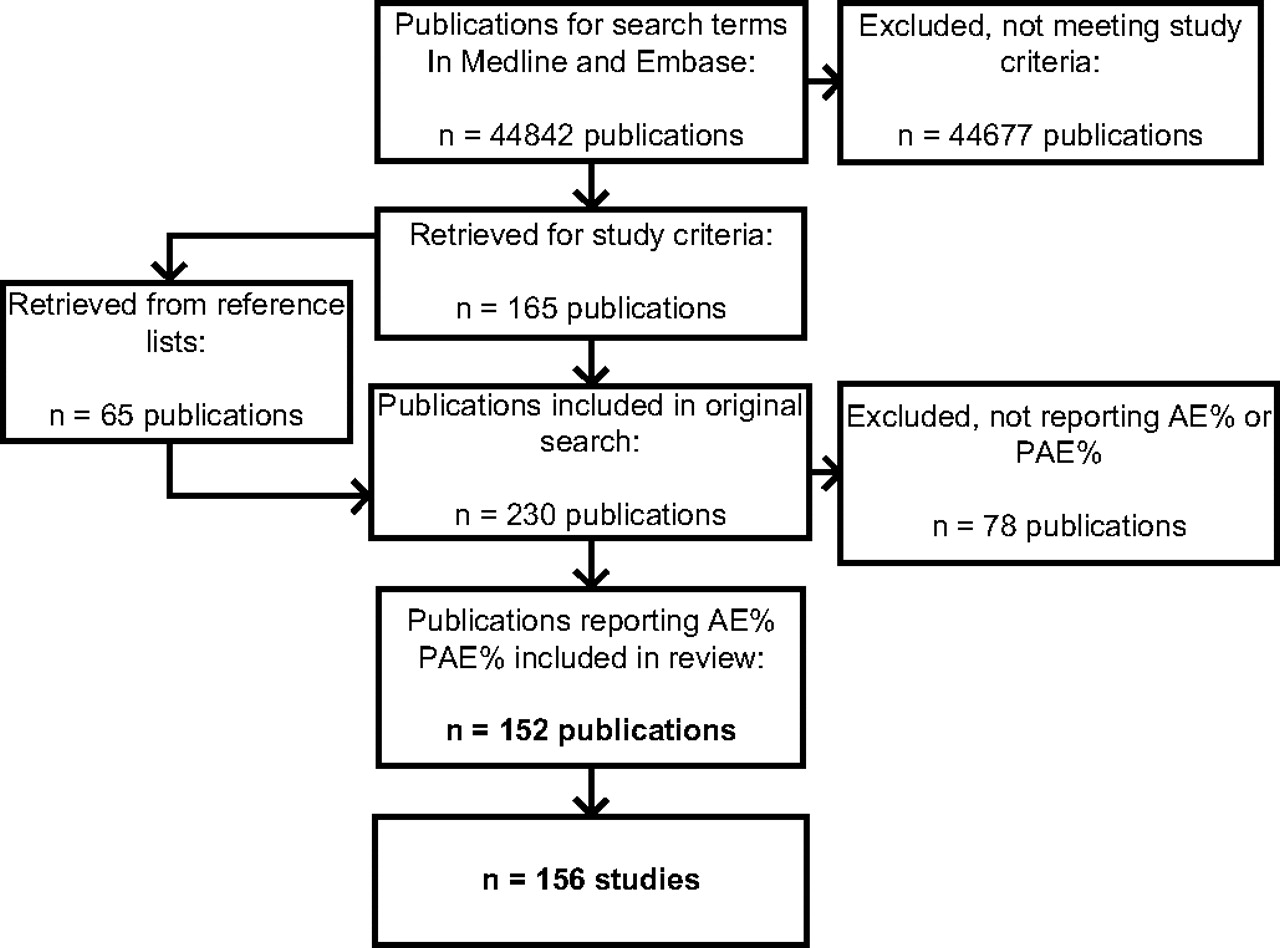
Our primary research found a total of 241 studies in 230 publications that matched our inclusion criteria. A total of 156 studies gave results as percentages of patients affected by AE or PAE, see figure 1 (full list of references in Appendix 1, available online only).

Flow chart of studies retrieved and included in the systematic review. AE, adverse event; PAE, preventable adverse event.
Study characteristics
In total, the 156 studies in our review reported results on 23 696 252 patients. Sample size varied from 60 patients34 to 8 493 876 patients.35 The median sample size was 1361 patients, the 25th percentile was 379 patients, and the 75th percentile was 14 766 patients.
AE as a single outcome measure was observed in 101/156 (64.7%) of studies, 12 (7.8%) observed PAE, and 43 (27.6%) observed both. Studies were performed in 27 countries, primarily in highly developed industrial countries, headed by the USA (51 surveys). Most studies were short-term; 55.1% lasted more than 6 months, but only 25.6% lasted more than 1 year. Patients were treated in distinct healthcare settings. One hundred and one studies examined inhospital patients, nine surveys looked at ambulatory care, 39 looked at ambulant patients leading to hospital admission, three studies took place in long-term care, and four studies were conducted in other settings. When samples consisted of hospital patients, tertiary hospitals and academic centres prevailed. Most studies were limited to single institutions (101/156 cases). In general, all medical disciplines were concerned (17 medical specialties were distinguished), but when a specific choice was made, this depended principally on the organisational structure of the wards and hospital. Ninety-seven of 156 surveys concentrated on a single discipline. Thirty-nine of these were concerned with internal medicine, 16 with paediatrics and nine with surgery. We also found that 50/156 studies reported on all types of events, 99/156 were medication-related, and 7/156 were procedure-related.
Studies used different methods for collecting data. Ninety-seven surveys were restricted to a single collection method, and 59 papers used a combination of two or more methods. As a single measuring instrument, a chart review prevailed in 43/97 studies, followed by clinical surveillance (13/97) and ICD codes (11/97). Among combinations, the use of chart review with interviews was most common (19/59). A summary of all studies included is given in Appendix 2, available online only.
Incidence of AE and PAE by sample size
Frequencies of AE ranged from 0.1% to 65.4%. Most studies (129/156) reported results between 0.1% and 30% (median 8.9%, IQR 12.9). Incidences of PAE ranged from 0.1% to 33.9%. Almost all studies (53/55) reported results between 0.1% and 20% (median 4.8%, IQR 5.4).
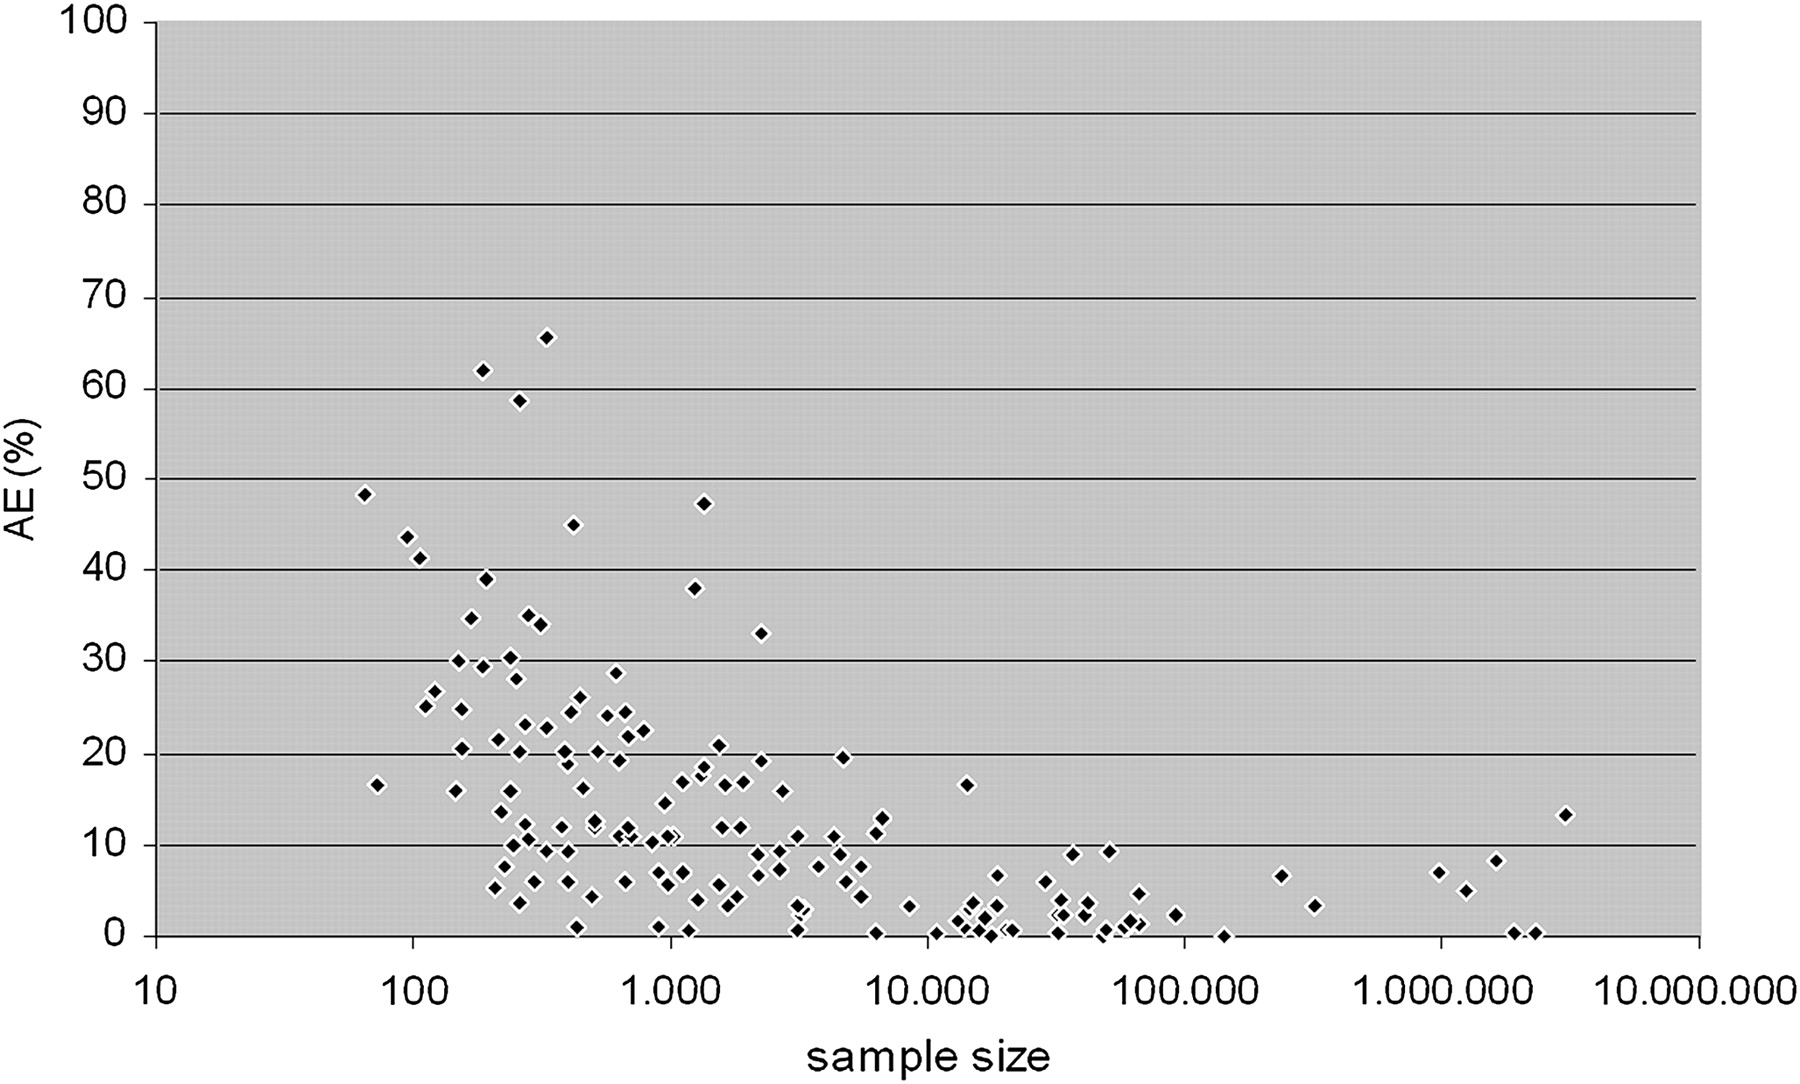
To provide a more detailed picture of the distribution of results, we plotted the results against study size. Figure 2 shows the distribution of AE estimates in correlation to the size of the study population.

Adverse event estimates in correlation to sample size (n=144 studies), sample size displayed with half logarithmic-scale.
We observe a broad variation in smaller studies having fewer than 1000 patients. In studies with more than 1000 patients, the spread decreases rapidly, and even falls below 20% in studies with more than about 2000 patients. With only one exception, the results of surveys with approximately 15 000 patients or more do not exceed 10%.36
For PAE, the plot looks similar, although extreme outliers are missing within small studies (figure 3); however, the fraction of small studies is smaller for PAE than for AE, and the same is true for very large studies.

Preventable adverse event estimates in correlation to sample size (n=55 studies), sample size displayed with half logarithmic-scale.
Nonetheless, percentages clearly decrease with sample size. In studies with approximately 2000 patients, the results fall below 10%, and below the 1% mark in studies with more than 20 000 patients. All scatter plots exhibit a visible correlation between the frequency of AE and PAE and sample size.
Effect of setting, types of events, terminology and methods of collecting data
We next analysed whether variation is due to further factors. We found that results do not differ between healthcare settings, countries or medical specialties. More surprisingly, we did not even find any clear disparities between different types of events, although the frequency of AE related to medications or procedures is expected to be lower than the overall results. Figure 4 shows the distribution for adverse drug events, procedure-related events and all types of AE (figure 4).

Adverse event estimates by event type (n=144 studies).
The data for terminology show a similar distribution. There is no difference in variation between studies using the terminology of the IOM, the WHO or others (figure 5, a list of all definitions of AE used is given in Appendix 3, available online only).
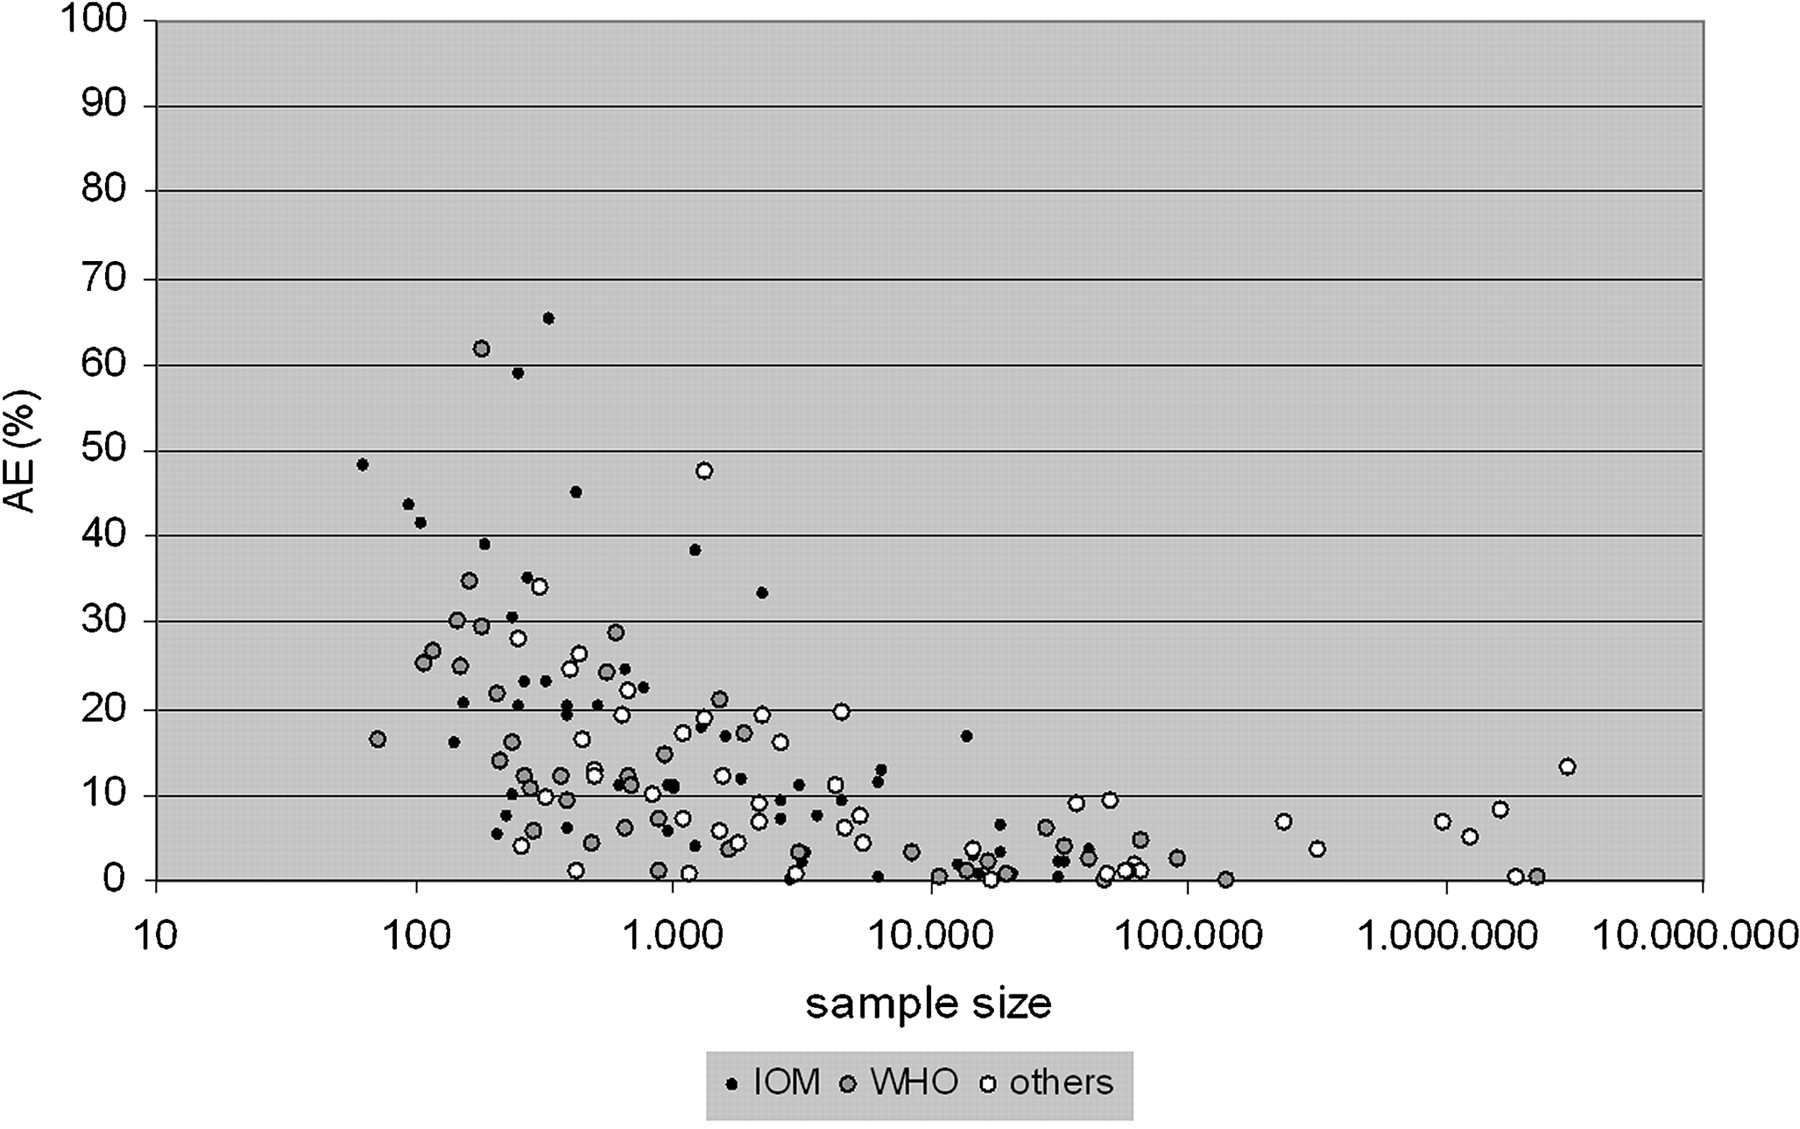
Adverse event estimates by AE terminology (n=144 studies).
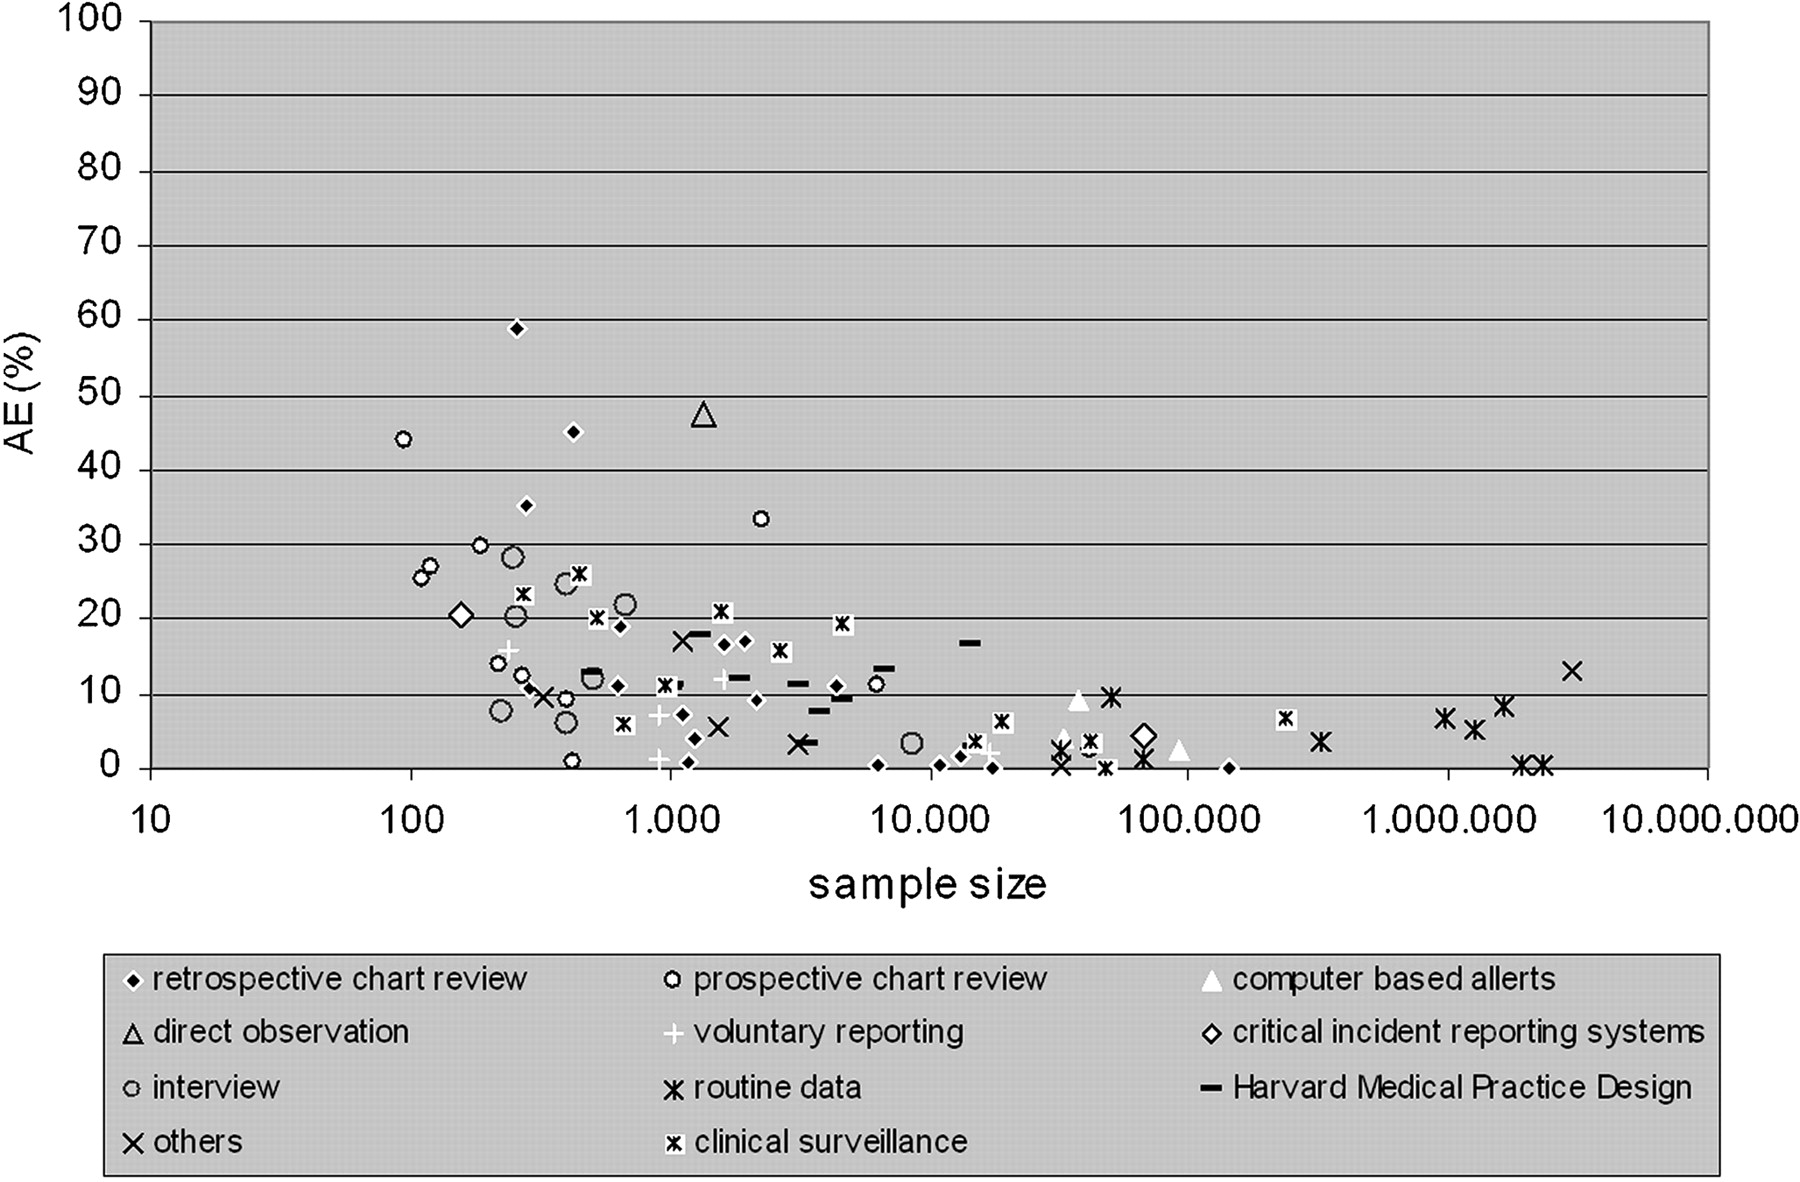
In relation to data-collecting methods, there is no difference in estimates between studies that use a single method to detect events, and surveys that operate with two or more methods. In contrast assessment techniques differ according to sample size, especially for AE (figure 6).

Adverse event estimates by types of data collection methods, only single methods are displayed (n=88 studies).
Interviews as a single method are restricted to small studies with some hundred patients included,37–42 whereas compilations of ICD codes are used in large trials involving up to millions of patients.43–51 Six of nine surveys with more than 100 000 patients are based on ICD codes, and the frequencies of AE in these studies range from 0.1% to 8.3%. All studies with results exceeding 30% and one single method to detect AE rely on prospective or retrospective chart review. Also, 8/9 surveys with combined methods use prospective chart review, mainly in combination with interviews (3/8). The distribution is less clear for PAE.
Characteristics of study populations
Information on the effect of patient characteristics was inconsistent. The distribution of gender is displayed in 46/156 surveys; 58/156 studies give the mean ages. Only 54/156 studies report health status, referring mainly to the Charlson Index (11/54).52 Eighty-one of 156 surveys report on patient deaths. None of these data suffice to give information about possible dependence of variation on study population characteristics.
Discussion
In our systematic review, we included 156 studies on the frequency of AE and PAE. Studies were of great heterogeneity, and estimates varied widely from 0.1% to 65.4% for AE, and from 0.1% to 33.9% for PAE. Previous reviews found less variation. Von Laue et al compiled estimates for AE ranging between 2.9% and 16.6%, Aranaz et al from 3.7% to 16.6%, and de Vries et al from 4.6% to 12.4%. Discrepancies are largely because search strategies were more contracted, and the number of studies included was smaller.
Our aim was to display the overall body of published evidence in order to shed light on the diversity of studies and results. To consider study size as an approximation for strength of evidence, we plotted outcomes against the size of the study population and observed that variation decreased with the number of patients included. As one would expect results to spread in small studies as a simple rule of statistics, we interpret the distribution of results as an indirect indicator for validity. This pattern was much clearer for AE than for PAE, due primarily we believe to the smaller number of studies on PAE. This consequence of missing data has been described in the context of meta-analyses.53
We found no other factors to explain this pattern of variation. Neither different settings nor event types had any effect, that is, we found no differences between frequencies reported by surveys on the total of events and surveys examining medication-related or procedure-related AE only. The same is true for terminology; diverse definitions of AE make no difference to frequencies. One reason might be indifference to precise definition of terms. For example, few papers using the WHO terminology differentiate between adverse drug reactions and adverse drug events, terms sometimes used to distinguish between preventable and non-preventable patient injuries. These findings suggest that research methods should be refined, and results may not always display the true dimension of AE and PAE.
Very large surveys show a clear tendency for results to be less than 1%. This could be due to the relation between sample size and assessment methods. Whereas large surveys with more than 100 000 patients are almost exclusively restricted to ICD-coded events, many small trials prefer chart review, or combinations with chart review. ICD coding is able to display only a fraction of events, which might explain the comparatively low estimates.54–56 Conversely, this does not follow for small studies with chart review. The assumption that high frequencies may correlate with small studies because they look at cases more carefully is opposed by the observation that results are not restricted to remarkably high results but show a distribution which is primarily due to statistical dispersion, and only additionally fortified by the choice of methods to collect data.
Another observation is that papers with above-average results indicate that the majority involved high-risk patients and very old or very young patients. Eight of 16 publications with results on AE above 30% dealt with elderly patients,57–64 and two observed children.65 ,66 Unfortunately, data were not sufficient for further analysis.
We conclude that the precision of AE and PAE estimates depends primarily on sample size and to some degree on methods to collect data. This second observation remains difficult for interpretation. In our judgement as a consequence the informative value of very small surveys should be considered with scepticism, as well as that of very large ones. Since 54.9% of studies on AE (84/153) and 60.3% of studies on PAE (35/58) deal with study populations either smaller than 1000 patients or larger than 50 000 patients the generalisibility of these papers must be reassessed.
We believe the present review to be the largest systematic review of the incidence of AE and PAE.18 ,24 Only one previous review detected a correlation between incidence and sample size but did not give any explanation.24 Others suggested explanations but did not verify these.20 ,22 ,24
The present review has limitations. It is part of a wider research effort and is limited to surveys of the percentages of AE/PAE. Consequently, estimates of errors or near misses were not considered. Another limiting factor is that PAE has not yet been investigated to the same extent as AE. Also, we searched only the Medline and Embase databases. Due to our broad research strategy, results exhibit a high heterogeneity, so there was no indication to summarise results in a meta-analysis.
Our findings affirm that AE and PAE are serious problems across all healthcare settings and medical procedures, but some questions remain about the consistency of methods of collecting and reporting data. Further research should concentrate on advancing methods especially for small settings and specific types of event.
Acknowledgments
The authors thank all student assistants for the time and care they spent in assisting data management: H Doll, F Schwartz, J Streck, P Ottlitz, H Cramer, H Brehmer, D Meyer, J Bellach, M Schmedemann, A Bailey, C Kloss and J Schott.
References
Supplementary materials
Web Only Data
Files in this Data Supplement:
Footnotes
Funding The project ‘patient safety: investigation of the international status quo, assignment on the German healthcare system, and need for action’ was funded by the German ministry of health.
Competing interests None.
Provenance and peer review Not commissioned; externally peer reviewed.