Article Text

Abstract
Objectives To explore the feasibility of using statistical text classification techniques to automatically categorise clinical incident reports.
Methods Statistical text classifiers based on Naïve Bayes and Support Vector Machine algorithms were trained and tested on incident reports submitted by public hospitals to identify two classes of clinical incidents: inadequate clinical handover and incorrect patient identification. Each classifier was trained on 600 reports (300 positives, 300 negatives), and tested on 372 reports (248 positives, 124 negatives). The results were evaluated using standard measures of accuracy, precision, recall, F-measure and area under curve (AUC) of receiver operating characteristics (ROC). Classifier learning rates were also evaluated, using classifier accuracy against training set size.
Results All classifiers performed well in categorising clinical handover and patient identification incidents. Naïve Bayes attained the best performance on handover incidents, correctly identifying 86.29% of reporter-classified incidents (precision=0.84, recall=0.90, F-measure=0.87, AUC=0.93) and 91.53% of expert-classified incidents (precision=0.87, recall=0.98, F-measure=0.92, AUC=0.97). For patient identification incidents, the best results were obtained when Support Vector Machine with radial-basis function kernel was used to classify reporter-classified reports (accuracy=97.98%, precision=0.98, recall=0.98, F-measure=0.98, AUC=1.00); and when Naïve Bayes was used on expert-classified reports (accuracy=95.97%, precision=0.95, recall=0.98, F-measure=0.96, AUC=0.99). A relatively small training set was found to be adequate, with most classifiers achieving an accuracy above 80% when the training set size was as small as 100 samples.
Conclusions This study demonstrates the feasibility of using text classification techniques to automatically categorise clinical incident reports.
- Incident reporting
- adverse event
- patient safety
- machine learning
- text classification
Statistics from Altmetric.com
Introduction
Adverse event reporting has been highlighted as a foundation for patient safety improvement.1 However, since a manual review of incidents is highly resource-intensive, the lack of resources often limits timely analysis and responsive action. In an Australian state alone, clinical incident notifications totalled 61 217 between July and December in 2008. This is equivalent to 19 incidents per 1000 bed days, or 7.7% of admissions. The sheer number of reports makes a manual review an arduous task. Many reported incidents remain unanalysed, sometimes as a result of their initial classification, and so the opportunity to learn from such incidents is missed. Indeed, inadequate feedback is the most frequently reported barrier to reporting.2 ,3 Although most reporting systems provide a coding system for classifying major patient safety events, vital information often remains hidden in the incident narratives. Further, reporting systems are also likely to evolve over time, potentially resulting in inconsistency in how reports are classified.
The aim of our study was to investigate the feasibility of applying statistical text classification to automatically categorise clinical incidents. Text classification has been successfully applied in aviation to identify safety issues from the text of incident reports,4–6 and in several domains of medicine, including the detection of adverse events from patient documents.7–12 However, its use in classifying clinical incident reports remains relatively unexplored. We hypothesised that text classification could potentially provide an efficient and scalable method for automatically classifying clinical incidents, diminishing the need for manual review.
Methods
Three statistical text classifiers were developed for identifying two classes of clinical incidents: inadequate clinical handover and incorrect patient identification. The classifiers were based on the following machine learning algorithms: Naïve Bayes, Support Vector Machine (SVM) with a linear kernel, and SVM with a radial-basis function (RBF) kernel.
Data source
Our datasets consisted of incident reports submitted to the Advanced Incident Management System (AIMS) by public hospitals from one Australian state between March 2004 and July 2008. AIMS is a reporting system designed by the Australian Patient Safety Foundation (APSF).13 The system provides an in-built classification system consisting of 21 Healthcare Incident Types (HIT). Each HIT contains further subcategories (appendix A). On submission, a reporter assigns an incident to one or more HITs and their subcategories. Clinical handover and patient identification incidents are categorised under the ‘Clinical Management’ HIT, using subcategories ‘inadequate handover’ and ‘incorrect patient’ respectively. An AIMS report also contains a number of unstructured free-text fields, including incident description, outcome for the subject, initial action taken, prevention steps and results of the incident (table 1). As part of the AIMS process, the incident types assigned are reviewed and verified by an expert, and actions are taken accordingly. The AIMS system has evolved progressively in response to feedback from users, and is undergoing progression evaluation with respect to validity and reliability.13
Example of an incident reported to the Advanced Incident Management System database
Dataset
We extracted a non-exhaustive set of incidents from AIMS to develop and test our text classifiers. For the extraction, clinical handover was defined as the ‘transfer of professional responsibility and accountability for some or all aspects of care for a patient, or group of patients, to another person or professional group on a temporary or permanent basis.’14 Patient identification incidents were defined as ‘problems resulting from incorrect identification of a patient or their documents.’
Reporter-classified incidents
Querying the AIMS database for incidents classified as ‘Clinical Management/inadequate handover’ yielded 424 reports and ‘Clinical Management/incorrect patient’ yielded over 1000 reports. To allow for direct comparison, only 424 reports were extracted from the latter. For each incident class, 300 reports were used as a training set, and 124 were set aside for testing. Ordering and assignment of data to training and test sets were randomised.
Expert-classified incidents
Keyword searches were performed to retrieve incidents missed by AIMS codes. Keywords used were ‘handover’ and ‘wrong patient.’ Incidents were then reviewed by an APSF classification expert (NH). Inclusion criteria were incidents that satisfied the definitions of clinical handover and patient identification incidents. One hundered and twenty-four reports were extracted for both incident types, to allow for direct comparison with the reporter-classified set.
Negative test set
A further 424 incidents that had not been preclassified as clinical handover or patient identification incidents were randomly selected from the database as a negative set. These incidents were reviewed by MO to ensure that they were not related to clinical handover or patient identification. Of the 424 incidents extracted, none was excluded for that reason. To attain balanced datasets, 300 of these incidents were used as a negative training set, and the remaining 124 were included in the test set.
Training methodology
Preprocessing incident reports
Incident reports were preprocessed into a format interpretable by the classifier. All AIMS-specific codes were removed. Only descriptive narratives in the following fields were retained: incident description, outcome for the subject, initial action taken, prevention steps and results of incident (table 1). For each incident, punctuation was removed and text was converted to lower case and finally reduced to an unordered collection of words, known as a ‘bag of words.’
A number of methods were tested to see if they enhance the quality of processed reports: (1) removal of numeric text; (2) removal of words containing fewer than two letters; and (3) addition of bigrams (word pairs that co-occur in text) originally present in the unprocessed reports (appendix C). A list of commonly occurring bigrams were selected through manual inspection of incident reports by MO (appendix C).
Training the classifiers
Classifiers were trained using Naïve Bayes, SVM with linear kernel and SVM with RBF kernel. To study the impact of size of the incident training set on classification performance, the training set was initially set to 100 samples (50 positives, 50 negatives), and incrementally increased by 100 until all 600 (300 positives, 300 negatives) samples were used. Feature selection methods were sequentially applied to evaluate the effects of each method. Weka, an open-source machine learning software, was used for training and testing the classifiers.15
Testing the classifiers
The trained classifiers were evaluated on the reporter-classified (n=124), and expert-classified (n=124) test sets. The same negative set (n=124) was used for both. The results were evaluated using the standard measures of accuracy, precision, recall, F-measure and area under curve (AUC) of the receiver operating characteristic curve (ROC; appendix B). Classifier learning rates were measured using classifier accuracy against training set size.
Results
Performance
All classifiers performed well in categorising both handover and patient identification incidents. Naïve Bayes attained the best performance on handover incidents, correctly identifying 86.29% of reporter-classified incidents (precision=0.84, recall=0.90, F-measure=0.87, AUC=0.93), and 91.53% of expert-classified incidents (precision=0.87, recall=0.98, F-measure=0.92, AUC=0.97). Classifiers trained on SVM with linear and RBF kernels produced comparable results, with an accuracy of 84.27% and 83.87%, respectively, on reporter-classified incidents, and 89.11% and 88.71%, respectively, on the expert-classified test set.
For patient identification incidents, all classifiers achieved near-perfect results when tested on reporter-classified incidents (tables 2, 3). Classifiers trained on SVM with RBF kernel performed best, achieving an accuracy of 97.98% (precision=0.98, recall=0.98, F-measure=0.98, AUC=1.00). SVM with linear kernel and Naïve Bayes attained an accuracy of 97.58% and 96.77% respectively. Against expert-classified incidents, the classifiers also performed well, led by Naïve Bayes (accuracy=95.97%, precision=0.95, recall=0.98, F-measure=0.96, AUC=0.99), followed by SVM with RBF (accuracy=94.35%) and SVM with linear kernel (accuracy=91.53%). In all cases, best performance was achieved with removal of numeric text and removal of words containing fewer than two letters from the bag of words (appendix D).
Best performance achieved by each algorithm for classifying clinical handover incidents
Best performance achieved by each algorithm for classifying patient identification incidents
Learning rate
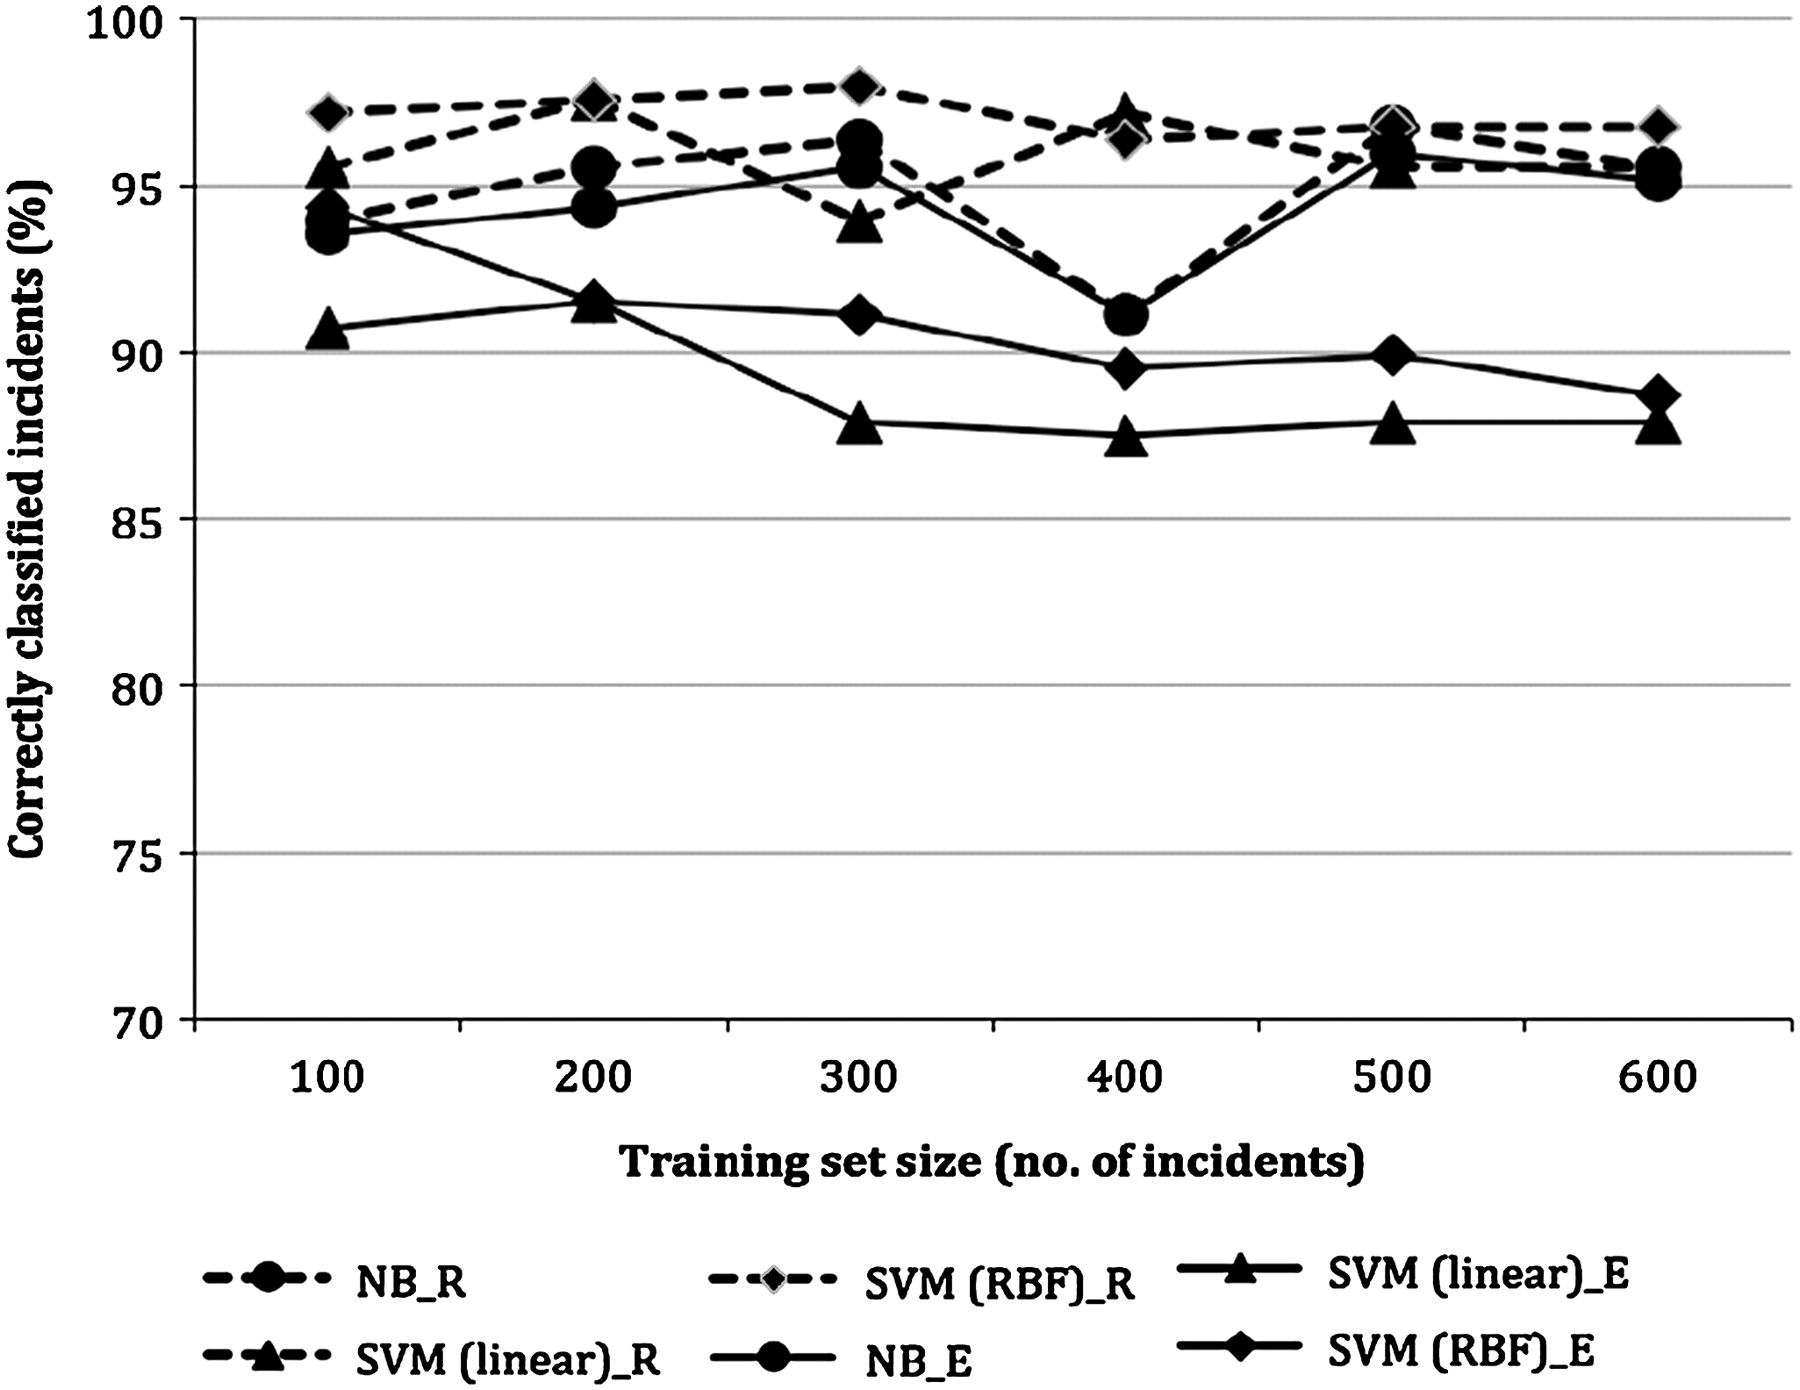
Most classifiers achieved an accuracy of above 80% when 100 samples were used (figures 1, 2). Classifiers for identifying handover incidents showed continuing improvement when training set was increased above 100 samples, in particular when SVM with RBF kernel was used. However, further additions to the training set beyond 300 samples did not have any substantial effects on the performance. In contrast, classifiers for identifying patient identification incidents attained an accuracy above 90%, even when the training set was as small as 100 samples. There was little improvement in performance when the size of the training set was increased. The accuracy of the classifier trained on Naïve Bayes dropped by 5% when the training set was increased to 400 samples, and recovered at 500.
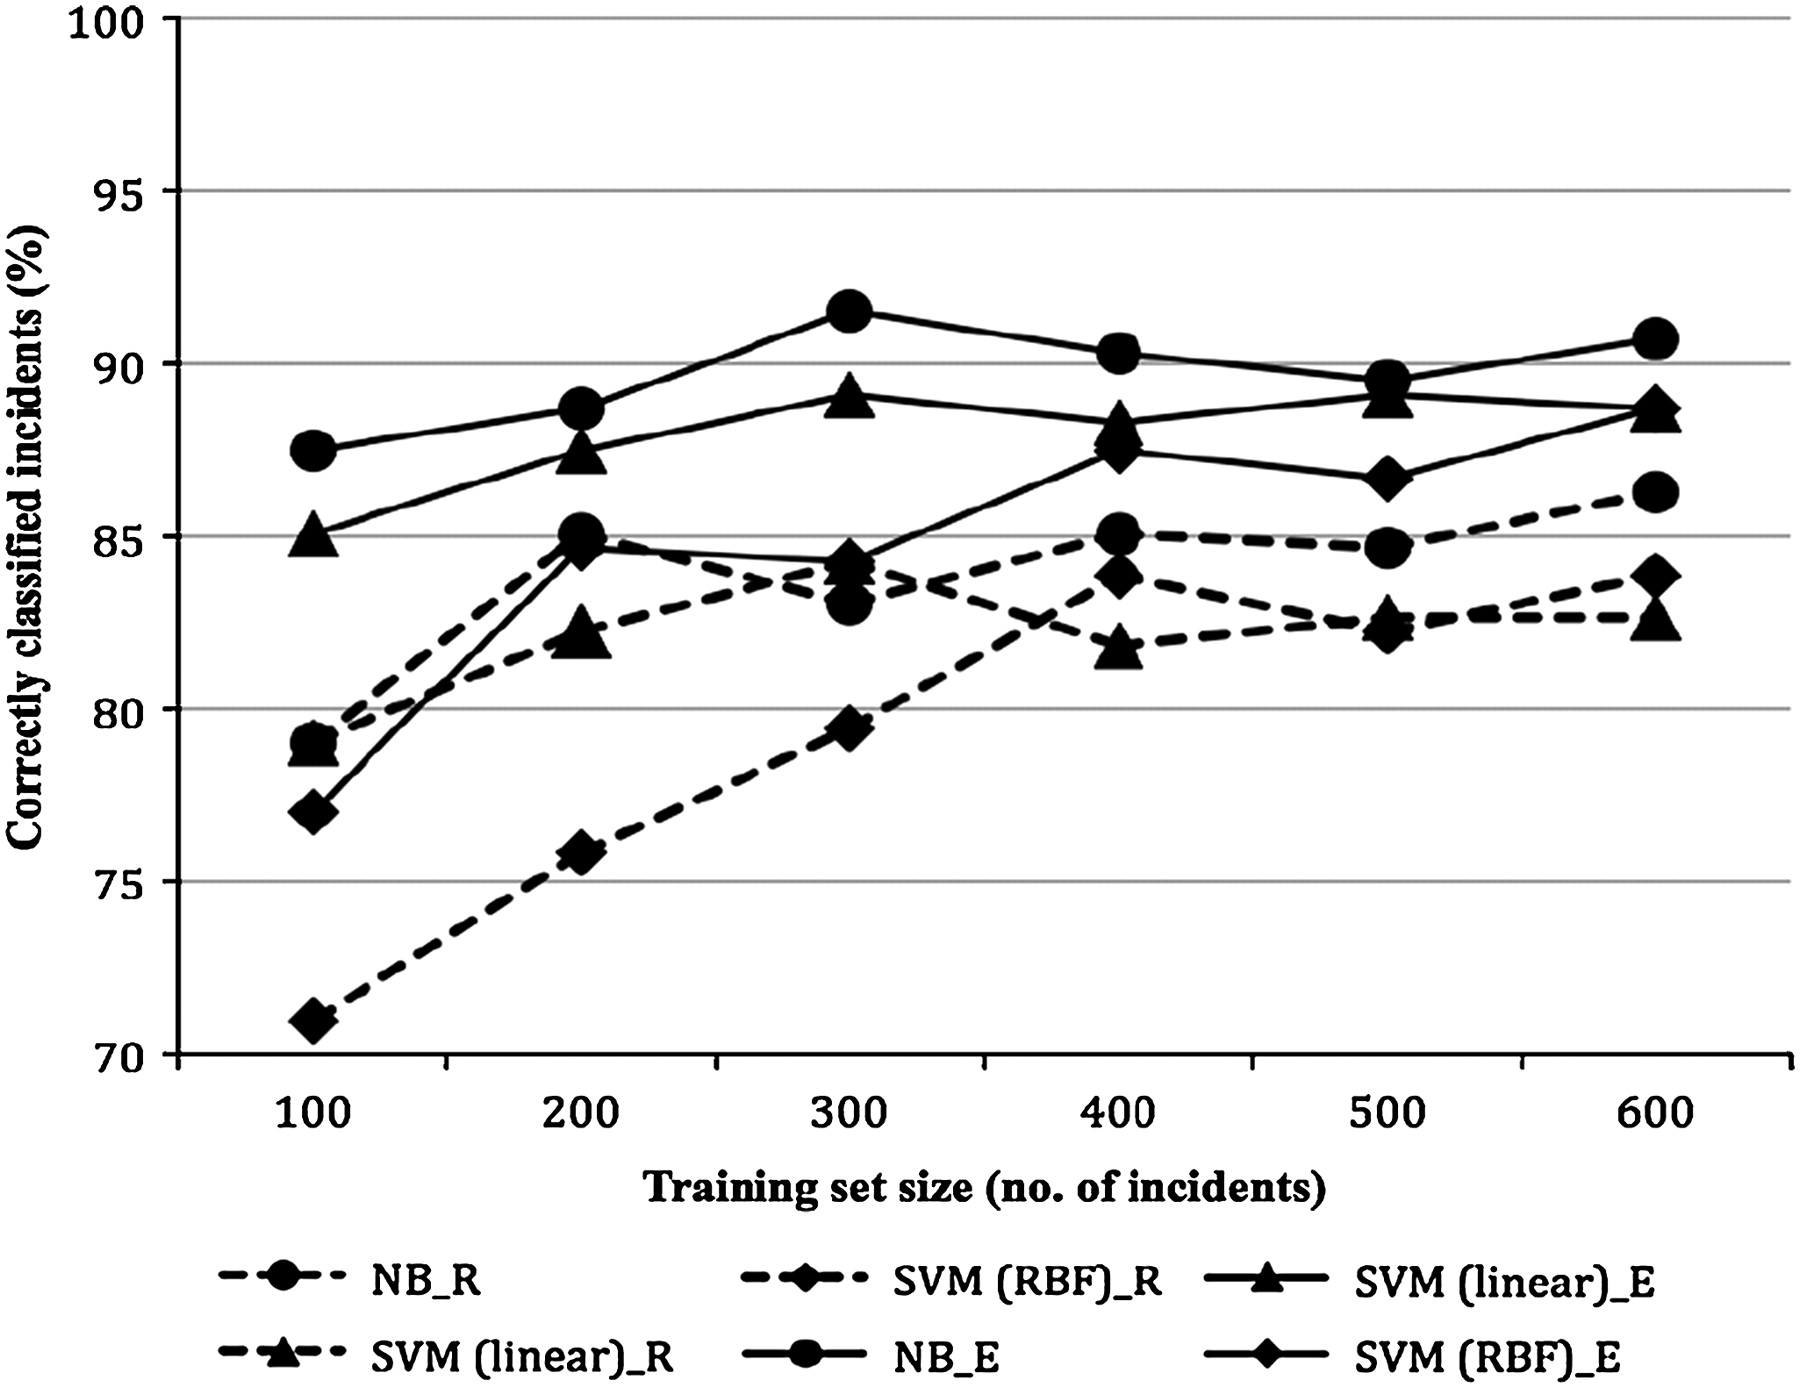
Learning rate of each classifier for clinical handover incidents. NB, Naive Bayes; SVM (linear), support vector machine with linear kernel; SVM (RBF), support vector machine with radial basis function kernel; _E, when tested against expert-classified incidents; _R, when tested against reporter-classified incidents.
Learning rate of each classifier for patient identification incidents. NB, Naive Bayes; SVM (linear), support vector machine with linear kernel; SVM (RBF), support vector machine with radial basis function kernel; _E, when tested against expert-classified incidents; _R, when tested against reporter-classified incidents.
Keyword bias
As keyword searches were used to retrieve the expert-classified incidents, our results might be skewed towards reports that contain the keywords. To determine the extent of this bias, we trained and tested the classifiers with the keywords removed from the bag of words. The results were encouraging. When the keyword ‘handover’ was excluded from the handover incidents (n=600), an accuracy of 78.17% and 98.41% was achieved by the classifiers trained on Naïve Bayes and SVM (linear kernel) respectively. In comparison, using the same datasets with the keyword achieved an accuracy of 90.73% when trained on Naïve Bayes, and 88.71% on SVM. Thus, the performance of the Naïve Bayes classifier was degraded in the absence of the keyword, while an improvement was observed in the SVM classifier. When the keyword ‘wrong’ was excluded from the patient identification incidents (n=600), improvement was observed in both classifiers. An accuracy of 100% and 92.86% was achieved by the Naïve Bayes and SVM classifiers respectively, compared with 96.37% and 95.56% when the keyword was included.
Discussion
Overall, the results obtained demonstrated the potential of using text classification techniques to perform automated classification of clinical incident reports. The classifiers, trained on the free-text narratives of reporter-classified incidents, were validated on both reporter-classified and expert-classified incidents, with high accuracies achieved in both cases.
A significant result was the relatively small training set required. All classifiers performed well, even when the training set was as small as 100 samples. Changes in performance were insignificant as the size of the training set was increased beyond 300 samples. One plausible explanation is the relative homogeneity of the data, due to the universal vocabulary used by clinical workers to describe the two classes of incidents examined. For instance, the word ‘handover’ is used for describing handover incidents across all medical specialities. Thus, adding more data to the training set would be unlikely to result in any more distinguishing attributes being learnt by the classifiers. The size of the feature set was effectively halved when numeric texts and words of fewer than two letters were filtered out of the bag of words and classifier performance improved. This was probably due to a reduction of noise in the data, as words unlikely to be relevant were excluded from the feature set.
A weakness of using a bag of words representation is the loss of information contained in the original incident word order, and bigrams are a common method to reintroduce some of this information. However, contrary to intuition, introducing bigrams did not produce any noticeable improvements in classifier performance. This finding is in agreement with a study on aviation reports, where bigrams did not lead to a classification improvement.6 However, our list of bigrams was selected manually, and a more deterministic automated approach to selection might produce better results.
The best performance was achieved with the clinical handover incidents manually identified by subject matter experts. A classifier trained on Naïve Bayes identified 92% of expert-classified incidents compared with 86% of reporter-classified incidents. A plausible explanation is the difference in reporting style between the two datasets. When the AIMS classification system was used, explicit mention of the incident cause tended to be left out from the descriptive narrative (box 1). A classifier trained and tested on such narratives alone might fail to identify the report as a clinical handover incident. Reports not classified prospectively for the incident class in question appear more likely to contain richer narrative descriptions of the unclassified elements, which are of more value in training classifiers.
Differences in reporting style when the incident class is identified at the time of classification
Reports prospectively classified using the Advanced Incident Management System Healthcare Incident Type
Narrative 1
Patient required minimum 3 weeks between receiving Gemcitabine chemotherapy and then having Radiotherapy. Patient started Radiotherapy 11/08/2008, but should have started 14/08/2008 as per above requirement.
Narrative 2
Surgical registrar wishing to perform maxillary block on a child in the ED for repair of extensive facial injury.
Reports not prospectively classified by reporters
Narrative 3
Inadequate handover of patient. Handover nurse did not know legal status of patient reason for patient admission did not handover pt had threatened harm to family and had access to weapons did not have patients old notes.
Narrative 4
Pt came from Centre dialysis with inadequate handover resulting in heparin given throughout the dialysis run when in fact the pt had been warfranised.
Notes: causes of incidents were not stated in Narratives 1 and 2; while in Narratives 3 and 4, ‘inadequate handover’ was explicitly stated as the cause of incidents.
Limitations
As with any statistical machine learning technique, the results produced by our classifiers are only as good as the training data. Both the quality of the reports and the accuracy of classification directly impact performance. The poor quality of some reports may have hampered their classification. Descriptions of causes are often inadequate and ambiguous, and spelling mistakes abound. We made no attempt to correct such mistakes. Thus, a possible future enhancement is to correct spelling mistakes as a part of incident report preprocessing.
Another potential limitation is the small set of keywords used to extract expert-classified incidents. Other keywords might have identified additional incidents. For our results to be generalisable, it is important that our set of incidents be representative of their class, but they need not be exhaustive. There is thus a possibility that our search strategy missed incidents, and that our dataset was in some way not representative of the whole set of incidents, resulting in misleading machine learning results. However, our evaluation of the classifiers with the keywords excluded from the dataset indicates that the algorithms did not rely on these keywords alone. Performance of the classifiers remained solid, thus suggesting that they are also likely to perform well when applied to incidents retrieved with other keywords.
Further, the incident classes tested here may not be representative of all incident types. They appear to be well-understood classes with reasonably clear descriptive terms, and so the methods used here may need to be enhanced when incident classes are identified by a less homogenous set of textual features.
Application
To apply the technique, classifiers must be trained on datasets specific to a particular setting. This is because terminology, reporting and linguistic styles may differ between reporting systems, hospitals and countries. The basic steps taken remain unchanged: (1) preprocess incident reports into textual features; (2) train the classifiers using the selected machine learning algorithm; and finally (3) test the classifiers.
It should be emphasised that automated classification of clinical incidents is not intended as a replacement for manual review. Manual analysis provides insights that cannot be captured by any automated methods. However, when human resources are lacking, automated classifiers can reduce the effort spent in identifying incidents, or provide aggregate data on volumes of reports for incident classes.
Conclusions
Automated classification of clinical incidents appears to be a viable enhancement to manual review. In this study, classifiers were trained successfully in identifying handover and patient identification incidents. The same techniques could be extended to other incident types and incident reporting systems. This study is a proof of concept, and only simple methods were used. Further enhancements to the classification algorithms may improve classification performance and efficiency, and may be needed for less clearly defined incident classes. Text classification techniques thus appear to provide a scalable and efficient method for identifying groups of related incidents from reporting systems, and clearly warrant further investigation.
Acknowledgments
The authors wish to thank S Anthony and F Lin, for sharing their expertise; N Hannaford, from APSF, for her involvement in incident review; and S Michael, for her assistance in searching the AIMS database.
Appendix A
Advanced Incident Management System healthcare incident types (HITs)
| Generic HITs |
| Clinical |
| Aggression—aggressor |
| Aggression victim |
| Behaviour/human performance |
| Clinical management |
| Documentation |
| Falls |
| Hospital- acquired infection/infestation |
| Medical |
| Devices/equipment/property |
| Medications/intravenous fluids |
| Nutrition |
| Pathology/laboratory |
| Oxygens/gases/vapours |
| Pressure ulcer |
| Non-clinical |
| Accidents/occupational health and safety |
| Buildings/fittings/fixtures/surrounds |
| Organisational management/services |
| Security |
| Specialty HITs |
| Anaesthesia |
| Complaints |
| Hyperbaric |
| Intensive care unit |
| Obstetric fetal |
| Obstetric maternal |
Appendix B
Measures used to evaluate performance of text classifiers
Performance measure definitions
Accuracy (A)=the percentage of incidents classified correctly (both true positives and true negatives) in relation to the total number of incidents tested.
Precision (P)=the percentage of true positives detected in relation to the total number of incidents classified for a category (both true and false positives).
Recall (R)=the percentage of true positives detected in relation to the actual number of incidents in a category (both true positives and false negatives).
F-measure (F)=the harmonic mean of precision and recall.
AUC=a graphical plot of the sensivitity versus (1–specificity) for a classifier.
Learning rate=accuracy as the training set is incrementally increased. The classifier's learning rate reflects the size of the dataset required to train the classifier in order to attain a certain level of accuracy, thus providing an indication of the cost of training.
Mathematical Definitions
A=(TP+TN)/n
P=TP/(TP+FP)
R=TP/(TP+FN)
F=(1+β2) P×R/(β2×P+R)
n=test data size
TP=true positive (the number of incidents correctly classified to be in a given category).
TN=true negative (the number of incidents correctly classified not to be in a given category).
FP=false positive (the number incidents falsely classified to be in a given category).
FN=false negative (the number incidents falsely classified as not to be in a given category).
β enables F-measure to favour either precision or recall. We give equal weight to precision and recall by setting it to 1.
Appendix C
List of bigrams
hand over
handed over
follow-up
no documentation
inadequate documentation
poor documentation
not documented
correctly documented
time out
not notified
not told
not aware
not informed
correct information
adequate information
missing information
complete information
correct form
missing form
identification band
arm band
no notes
request form
consent form
correct label
transcription error
poor preop
poor postop
no escort
no consent
poor communication
Appendix D
Tabulation of results
| Tr=100, B=1870 | Tr=200, B=3025 | Tr=300, B=3943 | Tr=400, B=4853 | Tr=500, B=5603 | Tr=600, B=6188 | |
| Naïve Bayes | ||||||
| Correctly classified instances (%) | 77.82 | 77.82 | 82.26 | 84.27 | 84.68 | 85.08 |
| Precision | 0.79 | 0.70 | 0.82 | 0.80 | 0.80 | 0.80 |
| Recall | 0.77 | 0.97 | 0.82 | 0.92 | 0.92 | 0.93 |
| F-measure | 0.78 | 0.81 | 0.82 | 0.85 | 0.86 | 0.86 |
| Area under curve | 0.85 | 0.92 | 0.89 | 0.92 | 0.92 | 0.93 |
| Support Vector Machine (linear) | ||||||
| Correctly classified instances (%) | 78.63 | 83.47 | 83.87 | 80.65 | 81.45 | 81.85 |
| Precision | 0.77 | 0.83 | 0.84 | 0.82 | 0.84 | 0.83 |
| Recall | 0.82 | 0.85 | 0.83 | 0.78 | 0.78 | 0.81 |
| F-measure | 0.80 | 0.84 | 0.84 | 0.80 | 0.81 | 0.82 |
| Area under curve | 0.88 | 0.90 | 0.90 | 0.91 | 0.88 | 0.87 |
| Support Vector Machine (radial-basis function) | ||||||
| Correctly classified instances (%) | 67.34 | 77.82 | 78.63 | 81.45 | 81.85 | 82.26 |
| Precision | 0.61 | 0.71 | 0.73 | 0.76 | 0.77 | 0.78 |
| Recall | 0.94 | 0.93 | 0.90 | 0.91 | 0.92 | 0.90 |
| F-measure | 0.74 | 0.81 | 0.81 | 0.83 | 0.84 | 0.84 |
| Area under curve | 0.77 | 0.89 | 0.90 | 0.91 | 0.92 | 0.92 |
B, number of words in the bag of words; Tr, size of training data.
Performance of classifiers on reporter-classified handover incidents, with numeric texts removed from the bag of words
| Tr=100, B=632 | Tr=200, B=1134 | Tr=300, B=1573 | Tr=400, B=1988 | Tr=500, B=2356 | Tr=600, B=2613 | |
| Naïve Bayes | ||||||
| Correctly classified instances (%) | 79.03 | 85.08 | 83.06 | 85.08 | 84.68 | 86.29 |
| Precision | 0.79 | 0.80 | 0.84 | 0.83 | 0.82 | 0.84 |
| Recall | 0.80 | 0.93 | 0.82 | 0.88 | 0.89 | 0.90 |
| F-measure | 0.79 | 0.86 | 0.83 | 0.86 | 0.85 | 0.87 |
| Area under curve | 0.85 | 0.92 | 0.89 | 0.92 | 0.92 | 0.93 |
| Support Vector Machine (linear) | ||||||
| Correctly classified instances (%) | 79.03 | 82.26 | 84.27 | 81.85 | 82.66 | 82.66 |
| Precision | 0.79 | 0.82 | 0.85 | 0.83 | 0.85 | 0.84 |
| Recall | 0.80 | 0.83 | 0.84 | 0.81 | 0.79 | 0.81 |
| F-measure | 0.79 | 0.82 | 0.84 | 0.82 | 0.82 | 0.82 |
| Area under curve | 0.88 | 0.89 | 0.90 | 0.89 | 0.89 | 0.88 |
| Support Vector Machine (radial-basis function) | ||||||
| Correctly classified instances (%) | 70.97 | 75.84 | 79.44 | 83.87 | 82.26 | 83.87 |
| Precision | 0.66 | 0.75 | 0.75 | 0.80 | 0.78 | 0.80 |
| Recall | 0.87 | 0.89 | 0.89 | 0.90 | 0.90 | 0.90 |
| F-measure | 0.75 | 0.82 | 0.81 | 0.85 | 0.84 | 0.85 |
| Area under curve | 0.84 | 0.90 | 0.90 | 0.91 | 0.92 | 0.92 |
B, number of words in the bag of words; Tr, size of training data.
Performance of classifiers on reporter-classified handover incidents, with numeric texts and words of fewer than two letters removed from the bag of words
| Tr=100, B=660 | Tr=200, B=1162 | Tr=300, B=1601 | Tr=400, B=2016 | Tr=500, B=2384 | Tr=600, B=2641 | |
| Naïve Bayes | ||||||
| Correctly classified instances (%) | 79.03 | 85.08 | 83.06 | 85.08 | 84.68 | 86.29 |
| Precision | 0.79 | 0.80 | 0.84 | 0.83 | 0.82 | 0.84 |
| Recall | 0.80 | 0.93 | 0.82 | 0.88 | 0.89 | 0.90 |
| F-measure | 0.79 | 0.86 | 0.83 | 0.86 | 0.85 | 0.87 |
| Area under curve | 0.86 | 0.92 | 0.89 | 0.92 | 0.92 | 0.93 |
| Support Vector Machine (linear) | ||||||
| Correctly classified instances (%) | 79.03 | 82.26 | 84.27 | 81.85 | 82.66 | 82.66 |
| Precision | 0.79 | 0.82 | 0.85 | 0.83 | 0.85 | 0.84 |
| Recall | 0.80 | 0.83 | 0.84 | 0.81 | 0.79 | 0.81 |
| F-measure | 0.79 | 0.82 | 0.84 | 0.82 | 0.82 | 0.82 |
| Area under curve | 0.88 | 0.89 | 0.90 | 0.89 | 0.89 | 0.88 |
| Support Vector Machine (radial-basis function) | ||||||
| Correctly classified instances (%) | 70.97 | 79.84 | 79.44 | 83.87 | 82.26 | 83.87 |
| Precision | 0.66 | 0.75 | 0.75 | 0.80 | 0.78 | 0.80 |
| Recall | 0.87 | 0.89 | 0.89 | 0.90 | 0.90 | 0.90 |
| F-measure | 0.75 | 0.82 | 0.81 | 0.85 | 0.84 | 0.85 |
| Area under curve | 0.84 | 0.90 | 0.90 | 0.91 | 0.92 | 0.92 |
B, number of words in the bag of words; Tr, size of training data.
Performance of classifiers on reporter-classified handover incidents, with numeric texts and words of fewer than two letters removed from the bag of words (bigrams were added to the feature set)
| Tr=100, B=632 | Tr=200, B=1134 | Tr=300, B=1573 | Tr=400, B=1988 | Tr=500, B=2356 | Tr=600, B=2613 | |
| Naïve Bayes | ||||||
| Correctly classified instances (%) | 87.50 | 88.71 | 91.53 | 90.32 | 89.52 | 90.73 |
| Precision | 0.82 | 0.82 | 0.87 | 0.84 | 0.84 | 0.85 |
| Recall | 0.97 | 1.00 | 0.98 | 0.98 | 0.98 | 0.98 |
| F-measure | 0.89 | 0.90 | 0.92 | 0.91 | 0.90 | 0.91 |
| Area under curve | 0.96 | 0.99 | 0.97 | 0.98 | 0.98 | 0.98 |
| Support Vector Machine (linear) | ||||||
| Correctly classified instances (%) | 85.08 | 87.50 | 89.11 | 88.30 | 89.11 | 88.71 |
| Precision | 0.81 | 0.84 | 0.86 | 0.85 | 0.87 | 0.86 |
| Recall | 0.92 | 0.94 | 0.94 | 0.94 | 0.92 | 0.93 |
| F-measure | 0.86 | 0.88 | 0.90 | 0.89 | 0.89 | 0.89 |
| Area under curve | 0.94 | 0.94 | 0.93 | 0.93 | 0.92 | 0.92 |
| Support Vector Machine (radial-basis function) | ||||||
| Correctly classified instances (%) | 77.02 | 84.68 | 84.27 | 87.50 | 86.69 | 88.71 |
| Precision | 0.69 | 0.77 | 0.77 | 0.81 | 0.80 | 0.82 |
| Recall | 0.99 | 0.98 | 0.98 | 0.98 | 0.98 | 0.99 |
| F-measure | 0.81 | 0.87 | 0.86 | 0.89 | 0.88 | 0.90 |
| AUC | 0.95 | 0.97 | 0.97 | 0.97 | 0.97 | 0.97 |
B, number of words in the bag of words; Tr, size of training data.
Performance of classifiers on expert-classified handover incidents, with numeric texts and words of fewer than two letters removed from the bag of words
| Tr=100, B=593 | Tr=200, B=1085 | Tr=300, B=1423 | Tr=400, B=1853 | Tr=500, B=2110 | Tr=600, B=2373 | |
| Naïve Bayes | ||||||
| Correctly classified instances (%) | 93.95 | 95.56 | 96.37 | 91.13 | 96.77 | 95.56 |
| Precision | 0.92 | 0.93 | 0.95 | 0.85 | 0.95 | 0.94 |
| Recall | 0.96 | 0.98 | 0.98 | 0.99 | 0.98 | 0.98 |
| F-measure | 0.94 | 0.96 | 0.96 | 0.92 | 0.97 | 0.96 |
| Area under curve | 0.98 | 0.99 | 1.00 | 0.99 | 0.99 | 0.99 |
| Support Vector Machine (linear) | ||||||
| Correctly classified instances (%) | 93.95 | 97.18 | 91.53 | 97.58 | 95.16 | 94.76 |
| Precision | 0.97 | 0.97 | 0.99 | 0.98 | 0.99 | 0.99 |
| Recall | 0.91 | 0.98 | 0.84 | 0.98 | 0.91 | 0.90 |
| F-measure | 0.94 | 0.98 | 0.91 | 0.98 | 0.95 | 0.95 |
| Area under curve | 0.99 | 0.99 | 1.00 | 0.99 | 1.00 | 1.00 |
| Support Vector Machine (radial-basis function) | ||||||
| Correctly classified instances (%) | 96.77 | 96.77 | 97.58 | 94.76 | 96.77 | 97.18 |
| Precision | 0.96 | 0.98 | 0.98 | 0.99 | 0.98 | 0.99 |
| Recall | 0.98 | 0.95 | 0.97 | 0.90 | 0.95 | 0.95 |
| F-measure | 0.97 | 0.97 | 0.98 | 0.95 | 0.97 | 0.97 |
| Area under curve | 0.99 | 1.00 | 1.00 | 1.00 | 1.00 | 1.00 |
B, number of words in the bag of words; Tr, size of training data.
Performance of classifiers on reporter-classified patient identification incidents, with numeric texts removed from the bag of words
| Tr=100, B=557 | Tr=200, B=1040 | Tr=300, B=1368 | Tr=400, B=1788 | Tr=500, B=2110 | Tr=600, B=2299 | |
| Naïve Bayes | ||||||
| Correctly classified instances (%) | 93.55 | 95.16 | 96.37 | 91.13 | 96.37 | 96.37 |
| Precision | 0.92 | 0.92 | 0.95 | 0.85 | 0.95 | 0.95 |
| Recall | 0.95 | 0.98 | 0.98 | 0.99 | 0.98 | 0.98 |
| F-measure | 0.94 | 0.95 | 0.96 | 0.92 | 0.96 | 0.96 |
| Area under curve | 0.98 | 0.99 | 1.00 | 0.99 | 0.99 | 0.99 |
| Support Vector Machine (linear) | ||||||
| Correctly classified instances (%) | 95.56 | 97.58 | 93.95 | 97.18 | 95.56 | 95.56 |
| Precision | 0.96 | 0.98 | 0.90 | 0.98 | 0.99 | 0.99 |
| Recall | 0.95 | 0.98 | 0.99 | 0.96 | 0.92 | 0.92 |
| F-measure | 0.96 | 0.98 | 0.94 | 0.97 | 0.95 | 0.95 |
| Area under curve | 0.99 | 1.00 | 1.00 | 0.99 | 1.00 | 1.00 |
| Support Vector Machine (radial-basis function) | ||||||
| Correctly classified instances (%) | 97.18 | 97.58 | 97.98 | 96.37 | 96.77 | 96.77 |
| Precision | 0.97 | 0.98 | 0.98 | 0.98 | 0.98 | 0.98 |
| Recall | 0.98 | 0.97 | 0.98 | 0.94 | 0.95 | 0.95 |
| F-measure | 0.97 | 0.98 | 0.98 | 0.96 | 0.97 | 0.97 |
| Area under curve | 1.00 | 1.00 | 1.00 | 1.00 | 1.00 | 1.00 |
B, number of words in the bag of words; Tr, size of training data.
Performance of classifiers on reporter-classified patient identification incidents, with numeric texts and words of fewer than two letters removed from the bag of words
| Tr=100, B=557 | Tr=200, B=1040 | Tr=300, B=1368 | Tr=400, B=1788 | Tr=500, B=2038 | Tr=600, B=2299 | |
| Naïve Bayes | ||||||
| Correctly classified instances (%) | 93.55 | 94.35 | 95.56 | 91.13 | 95.97 | 95.16 |
| Precision | 0.92 | 0.92 | 0.95 | 0.85 | 0.95 | 0.93 |
| Recall | 0.95 | 0.97 | 0.97 | 0.99 | 0.98 | 0.98 |
| F-measure | 0.94 | 0.95 | 0.96 | 0.92 | 0.96 | 0.95 |
| Area under curve | 0.99 | 0.99 | 0.99 | 0.99 | 0.99 | 0.99 |
| Support Vector Machine (linear) | ||||||
| Correctly classified instances (%) | 90.73 | 91.53 | 87.90 | 87.50 | 87.90 | 87.90 |
| Precision | 0.96 | 0.97 | 0.99 | 0.98 | 0.99 | 0.99 |
| Recall | 0.86 | 0.86 | 0.77 | 0.77 | 0.77 | 0.77 |
| F-measure | 0.90 | 0.91 | 0.86 | 0.86 | 0.86 | 0.86 |
| Area under curve | 0.97 | 0.97 | 0.98 | 0.98 | 0.98 | 0.98 |
| Support Vector Machine (radial-basis function) | ||||||
| Correctly classified instances (%) | 94.35 | 91.53 | 91.13 | 89.52 | 89.92 | 88.71 |
| Precision | 0.97 | 0.98 | 0.98 | 0.98 | 0.98 | 0.99 |
| Recall | 0.92 | 0.85 | 0.84 | 0.81 | 0.82 | 0.78 |
| F-measure | 0.94 | 0.91 | 0.90 | 0.89 | 0.89 | 0.87 |
| Area under curve | 0.99 | 0.99 | 0.99 | 0.99 | 0.99 | 0.99 |
B, number of words in the bag of words; Tr, size of training data.
Performance of classifiers on expert-classified patient identification incidents, with numeric texts and words of fewer than two letters removed from the bag of words
Footnotes
Funding This study was funded by the Australian Commission on Safety and Quality in Health Care (ACSQHC) and undertaken as part of the Learning from patient safety incidents: patient identification and clinical handover project. This research is also supported in part by grants from the Australian Research Council (ARC) LP0775532 and NHMRC Programme Grant 568612. FM is supported by an (ARC) APDI Fellowship and the University of New South Wales, Faculty of Medicine. M-SO is supported by an ARC APA(I) Scholarship.
Competing interests None.
Provenance and peer review Not commissioned; externally peer reviewed.