Article Text

Abstract
Background Some emergency admissions can be avoided if acute exacerbations of health problems are managed by the range of health services providing emergency and urgent care.
Aim To identify system-wide factors explaining variation in age sex adjusted admission rates for conditions rich in avoidable admissions.
Design National ecological study.
Setting 152 emergency and urgent care systems in England.
Methods Hospital Episode Statistics data on emergency admissions were used to calculate an age sex adjusted admission rate for conditions rich in avoidable admissions for each emergency and urgent care system in England for 2008–2011.
Results There were 3 273 395 relevant admissions in 2008–2011, accounting for 22% of all emergency admissions. The mean age sex adjusted admission rate was 2258 per year per 100 000 population, with a 3.4-fold variation between systems (1268 and 4359). Factors beyond the control of health services explained the majority of variation: unemployment rates explained 72%, with urban/rural status explaining further variation (R2=75%). Factors related to emergency departments, hospitals, emergency ambulance services and general practice explained further variation (R2=85%): the attendance rate at emergency departments, percentage of emergency department attendances converted to admissions, percentage of emergency admissions staying less than a day, percentage of emergency ambulance calls not transported to hospital and perceived access to general practice within 48 h.
Conclusions Interventions to reduce avoidable admissions should be targeted at deprived communities. Better use of emergency departments, ambulance services and primary care could further reduce avoidable emergency admissions.
- Emergency Department
- Prehospital Care
- Primary Care
- Healthcare Quality Improvement
This is an Open Access article distributed in accordance with the Creative Commons Attribution Non Commercial (CC BY-NC 3.0) license, which permits others to distribute, remix, adapt, build upon this work non-commercially, and license their derivative works on different terms, provided the original work is properly cited and the use is non-commercial. See: http://creativecommons.org/licenses/by-nc/3.0/
Statistics from Altmetric.com
Background
Large increases in emergency admissions have been identified,1 raising concerns about whether all admissions are necessary. Reducing unnecessary admissions is important because of their cost to commissioners, service providers and patients and their families. Definitions of ‘unnecessary’ emergency admissions focus either on ‘preventability’ or ‘avoidability’. ‘Ambulatory and primary care sensitive conditions’ have been identified whereby emergency admissions are prevented through intervention in primary care.2 For example, primary care asthma nurses monitor patients with asthma regularly to ensure optimum health and thus prevent exacerbations which might lead to an emergency admission. An alternative approach focuses on avoidability, that is, when a person has an acute health problem, or an exacerbation of an existing health problem, it is handled without resorting to emergency admission. For example, an asthma attack is dealt with immediately in a walk-in centre or general practice (GP) before it becomes serious enough to require emergency admission. Responsibility for preventability tends to be focused on primary care, while the responsibility for avoidability can lie with the range of services in the wider system of emergency and urgent care that respond to patients suffering an acute health problem.3 ,4
In the UK, the range of services that could respond to an acute health problem includes same-day appointments in GP, GP out of hours services, walk-in centres, telephone helplines such as NHS Direct, NHS 24 or NHS 111, community services such as district nursing, emergency departments and emergency ambulances. Some health problems are accompanied by a need for social care and therefore social services can be included in this emergency and urgent care system. These services can be viewed as an emergency and urgent care system because patients living within a geographical area seeking emergency or urgent care will make decisions about which service to contact first and will often have pathways of care involving a number of services.4 ,5 The availability, accessibility and quality of services within any system, as well as the coordination and integration between services, may affect emergency admission rates. Some admissions could be avoided by a well performing system. Fourteen conditions likely to be rich in such admissions have been identified through consensus methods with 48 senior clinicians, researchers and healthcare commissioners with a special interest in emergency and urgent care.6 These are listed in table 1 and include non-specific chest pain, non-specific abdominal pain and chronic obstructive pulmonary disease (COPD). The term ‘avoidable admissions’ will be used to refer to admissions with these diagnoses, although it is important to understand that admissions with these diagnoses offer an indicator, rather than a direct measure, of avoidable admissions. It would be useful to identify the rate of avoidable emergency admissions, consider whether there is variation in rates between different systems, and identify factors explaining variation to identify modifiable factors for decreasing these rates.
Numbers of admissions for 14 conditions rich in avoidable admissions between April 2008 and March 2011
Many researchers have explored the factors affecting emergency admission rates overall, or for specific conditions, either through studying variation between GPs7–11 or between healthcare commissioning organisations.1 ,8 ,12 Many of the factors shown to explain variation in emergency admission rates are related to population and geography, including deprivation,7 ,8 ,10–13 ethnicity,7 ,9 ,10 ,13 vulnerability, for example, living alone,13 health in terms of morbidity and mortality,7–13 prevalence of health behaviours such as smoking,8 ,9 ,11 ,12 and urban/rural status.10 ,11 Some variation has also been explained by health service related factors: quality of primary care,8 ,9 ,12 supply of primary care,8 access to primary care,7 ,11 and perceptions of access to GP.7 ,8 ,10 ,12 Much of the focus on health service related factors has been on primary care, but there is some evidence that organisational issues within hospitals can affect admission.10 ,14 There has also been speculation that system-related factors, such as integration of health and social services, might affect emergency admission rates.1 ,10 In this study, we build on previous research by focusing on potentially avoidable admissions rather than all admissions, and by considering the range of emergency and urgent care services that could affect admissions rather than only primary care services. That is, we consider the effect of characteristics of ambulance services, emergency departments and hospitals, and those of GP.
Methods
Definition of an emergency and urgent care system
A healthcare system can be defined as a set of services linked by patient pathways. Healthcare systems operate at a national level and at a subnational level. In an emergency and urgent care system people with a perceived need seek immediate advice or treatment for a health problem. Between 2006 and 2013, primary care trusts (PCTs) in England commissioned health services for a defined geographical population. Each of these 152 PCTs managed an emergency and urgent care system, ensuring that their population had access to emergency and urgent care, and that the system of care and individual services met the needs of their population. These PCTs represent 152 emergency and urgent care systems in this study.
Calculating an avoidable admission rate
An expert consensus group of 48 senior clinicians, researchers and healthcare commissioners with a special interest in emergency and urgent care identified health conditions for which exacerbations could be managed by a well performing emergency and urgent care system without admission to an inpatient bed.6 These are detailed in table 1. Numbers of emergency admissions for the set of 14 conditions for each emergency and urgent care system were calculated using Hospital Episode Statistics (HES) for the three financial years April 2008 to March 2011.15 Admissions from all sources were included: GP, nursing homes, emergency departments and outpatient clinics. The condition code for the first finished consultant episode was used. PCT mid-2009 resident populations were then used as the denominator to calculate the rate of avoidable emergency admissions per 100 000 population.16 The directly age sex standardised admission rates per 100 000 per year were calculated for each PCT for the 3-year period using seven age groups (0–4, 5–14, 15–44, 45–64, 65–74, 75–84, 85+) standardised to the whole population for England in 2009. A 3-year period was selected to ensure that the effect of annual variability in emergency admission rates at a system level was minimised.
Identification of factors affecting emergency admissions rates
Based on previous research on variation in emergency admissions, and the focus here on the range of services in the emergency and urgent care system, it was necessary to locate factors relating to the population, geography, health, and range of emergency and urgent health services for these 152 systems. We searched national databases of routinely available data for relevant data on factors at a PCT level. When factors were available by financial year, we selected 2009/10 which was the mid-point year of the 2008–2011 period or the calendar year 2009, or summed quarterly data for 2009. The Index of Multiple Deprivation has often been used as an explanatory factor for variation in emergency admissions. We used two separate domains of this index—employment and income deprivation—because the index itself includes standardised emergency admission rates.17 The employment deprivation domain reports the proportion of the working age population unable to work due to unemployment, sickness or disability. The income deprivation domain reports the proportion of the population in families that are out of work or have low earnings. The Standardised Mortality Ratio has been shown to explain variation in emergency admissions overall. We decided not to include it because it may be an indicator of health status of a population and performance of services for that population. Instead we used indicators of morbidity: the prevalence of disease in the population. The Atlas of Variation was a source of health service related factors but the authors expressed concerns that some variation may be accounted for by some organisations incorrectly calculating some factors.18 Therefore we replaced any very high values with the median value for that factor. We did this for two factors: emergency department attendance rate (replaced two high values) and admissions from nursing homes rate (replaced five high values). We calculated two variables using the HES data. First, the percentage of all emergency admissions staying less than 1 day. This might indicate coding differences between hospitals, for example, with patients waiting in the hospital for a few hours without using a bed coded as admissions in some hospitals and emergency department discharges in others, or different ways of managing patients within the hospital, for example, with some hospitals able to put community services in place so that emergency department attendances can be discharged while others admit patients to a hospital bed while arranging community services to allow discharge. Second, the percentage of all emergency admissions referred by GPs to identify the direct influence of GP on emergency admissions. Two factors about the emergency ambulance service—percentage of incidents not transported to hospital and percentage of incidents meeting the 8 min response target—were only available for ambulance services rather than PCTs. We allocated the ambulance service rate to each of the PCTs nested within that ambulance service. This underestimates the variation there is likely to be at the PCT level. We found no routine data for all PCTs for intermediate care, social care or system integration. The source of data for factors is reported in the Results section.
Analysis
We undertook general linear modelling in IBM SPSS V.20, weighted for the size of the system population to account for larger uncertainty of estimates for smaller systems. The dependent variable was the age sex adjusted admission rates for conditions rich in avoidable admissions for 152 PCTs. The independent variables were tested in a hierarchical multiple regression in two blocks, using forward stepwise regression within each block. Variables were included if the p value for the t test was <0.05. The two blocks were determined by the extent to which factors were modifiable by services. In block 1 we tested factors not modifiable by services: population, geographical and health factors known to affect emergency admissions. We then used the residuals from Block 1 as the dependent variable in block 2 and tested the added effect of factors modifiable by services including service availability, accessibility, and quality.
Results
Potentially avoidable admissions
There were a total of 15 million emergency admissions in the 3-year period 2008–2011, approximately 5 million in each year and increasing over time. Twenty-two percent (3 273 395/14 998 773) of these admissions were for conditions identified as rich in potentially avoidable admissions. Chest pain, abdominal pain, urinary tract infections, acute mental crisis and COPD accounted for over two-thirds of these potentially avoidable emergency admissions (table 1) and 29% occurred in people aged over 75 years old.
Variation in age sex adjusted admission rates for conditions rich in avoidable admissions by system
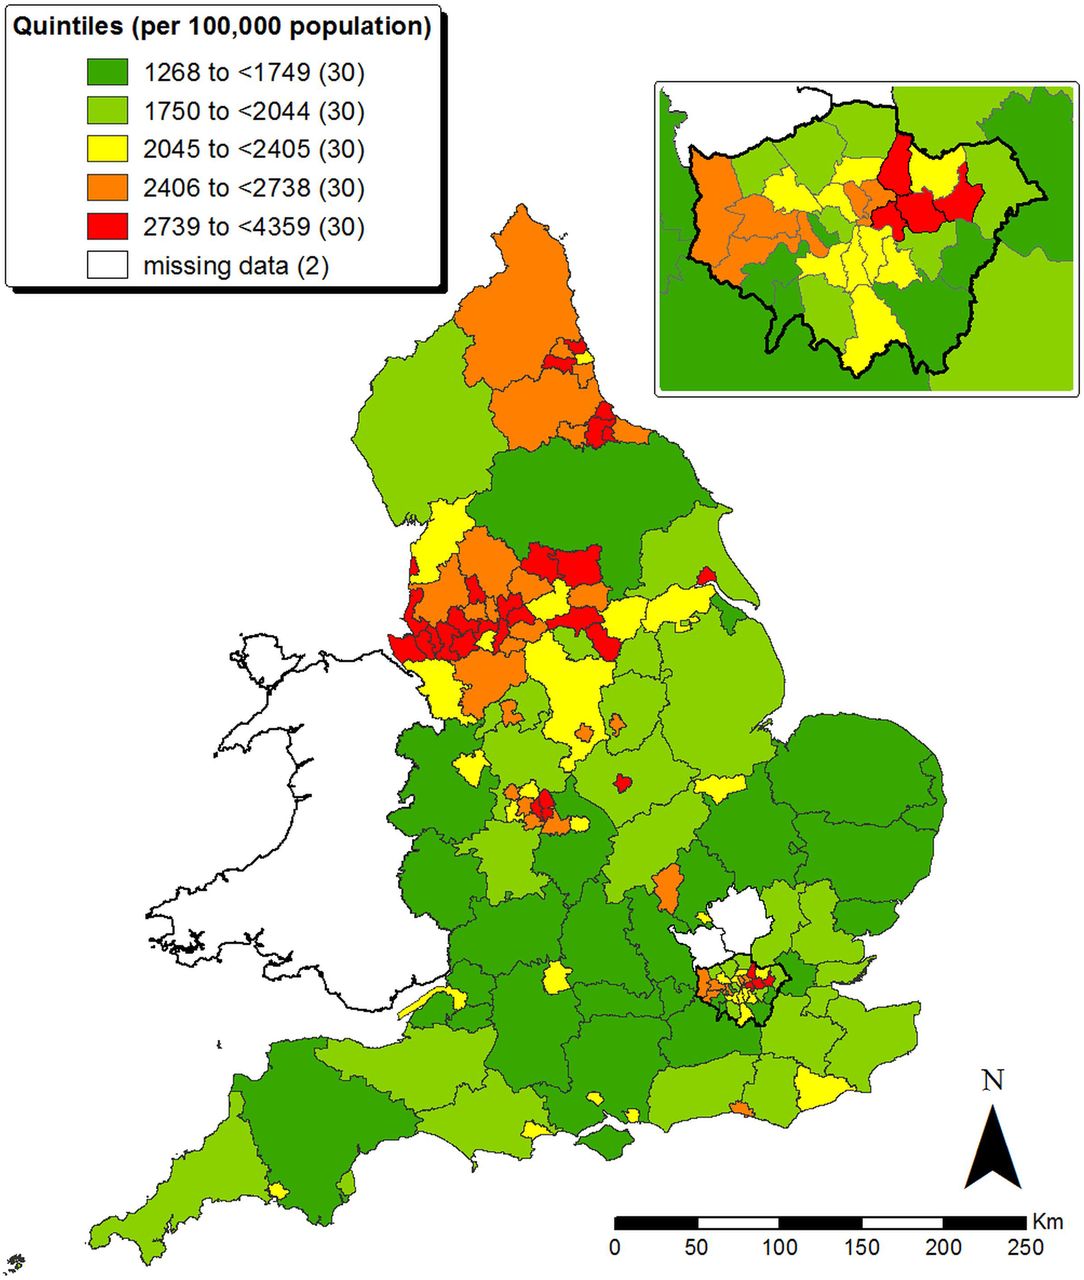
Two systems reported zero emergency admissions for 2010/11 because they had merged in 2010. We excluded them from the analysis, leaving 150 systems. The median age sex adjusted admission rate for conditions rich in avoidable admissions was 2258 (IQR 1808–2662), with a 3.4-fold variation between systems ranging from 1268 to 4359 and a 1.9-fold variation between the 10 and 90 percentiles. Geographical variation in the rate was apparent, with the highest rates clustering in the northwest of England and northeast London (figure 1). There was a strong correlation between the age sex adjusted admission rates for conditions rich in avoidable admissions and directly standardised emergency admission rates in 2009/10 (Pearson's R=0.88, p<0.001).

Map of age sex adjusted admission rates for conditions rich in avoidable admissions for emergency and urgent care systems.
Factors affecting age sex adjusted admission rates for conditions rich in avoidable admissions
We identified routine data for some of the relevant factors (see online supplementary table S2).19–29 We could find no routinely available data on availability and quality of intermediate care services or integration between services for these systems. We tested each factor separately in a univariate linear regression (see online supplementary table S2). Then we undertook multiple linear regression to identify the combination of factors which predicted potentially avoidable admission rates (table 2). In the univariate linear regression, two factors explained a large amount of variation in the rate. Both were population factors related to deprivation: income deprivation and employment deprivation (see online supplementary table S2). In the multiple linear regression we undertook the block 1 analysis—which tested population, geographical and health factors—and identified two factors which predicted potentially avoidable admission rates: employment deprivation (population factor) and urban/rural status (geographical factor). The more deprived populations and more urban populations had higher rates. These two factors together predicted 75% of the variation, with employment deprivation alone predicting 72% (table 2). In the block 2 analysis—which tested factors modifiable by services—factors related to emergency departments, hospitals, emergency ambulance services and primary care explained further variation (R2=85%). Systems with higher rates of potentially avoidable admissions had higher attendance rates at emergency departments, higher rates of conversion of emergency department attendances to admissions, higher proportions of very short stay patients, higher rates of ambulance calls transported to hospital and better perceived access to GP (table 2). There was no evidence of multicollinearity in block 2: variance inflation factors varied between 1.1 and 1.4.
Multiple linear regression
Some of the predictors in the multiple linear regression were correlated with others not included in the final regression. It is important to describe these correlations to facilitate interpretation of the final multiple regression. Employment deprivation was positively correlated with the prevalence of some of the 14 conditions (table 3). Urban/rural status was positively correlated with a number of factors, including the proportion of older people in a system and some primary care factors. Some of the factors in the multiple regression were correlated with each other, even though there was no multicollinearity: employment deprivation was negatively correlated with the proportion of ambulance callers transported to hospital; urban/rural status was positively correlated with perceptions of access to GP and the proportion of ambulance callers transported to hospital.
Large correlations between factors (Pearson's R>0.4)
Discussion
Summary of findings
Over a fifth of all emergency admissions in England between 2008 and 2011 were accounted for by 14 conditions that are likely to be rich in potentially avoidable admissions. There was considerable variation in age sex adjusted admission rates for conditions rich in avoidable admissions calculated for different emergency and urgent systems in England, with high rates clustering in the northwest and northeast London. A unique aspect of this study was consideration of the effect of the wider system of services offering emergency and urgent care on these emergency admission rates. Most of the variation in these potentially avoidable emergency admissions was explained by factors outside the control of emergency and urgent care system providers. Systems with higher rates of employment deprivation, and with urban geography, had higher rates of potentially avoidable emergency admissions. Employment deprivation alone explained 72% of the variation. This factor is likely to represent deprivation more generally because income deprivation had equally large explanatory power in the univariate regression. It is not clear from this study how deprivation affects admissions but it can be partly explained by higher levels of illness in deprived communities because deprivation was correlated with measures of disease prevalence.
Urban-based systems had higher rates of potentially avoidable emergency admissions than rural ones. However, the urban/rural factor was correlated with factors measuring access to GP and GP out of hours services, with rural areas having better perceived access to GPs. The urban/rural factor was also correlated with the proportion of ambulance calls not transported to hospital. This highlights the difficulty in interpretation of our findings (and those of other similar studies) because the causal pathways are unclear. Our hierarchical multiple regression assumes that services cannot modify their population or geography. Yet it may be that services in rural areas can tailor provision based on geography by keeping patients at home and in their community because of the distance to local hospitals, suggesting that services in urban areas could do the same. Or, it may be that services are able to operate in rural areas in ways that are simply not possible in urban areas.
There was evidence that variation in the operation and use of key emergency services—emergency departments, emergency ambulances, primary care and hospitals—accounted for a further amount of the remaining variation. The emergency department attendance rate, the conversion rate of emergency department attendances into hospital admissions, and the proportion of admissions with a very short length of stay were higher in some systems than others and were associated with higher rates of potentially avoidable admissions. The latter factor about short length of stay may be related to hospitals coding the same cases differently (as an admission or a discharge from emergency department) or managing the same cases differently because they are more or less able to discharge emergency department attendees back to the community. Some ambulance services kept a large proportion of callers away from hospitals, either by giving advice over the telephone or sending a response without then taking the person to hospital. There were no routinely available data on availability and quality of intermediate care services or integration between services for these systems, so we could not assess the effect of these potentially important factors.
Strengths and weaknesses
The strengths of the study were that it focused on admissions for conditions rich in avoidable admissions and moved beyond previous research which focused on primary care factors explaining emergency admissions. That is, it took a system-wide focus, recognising that a range of services can contribute to avoiding admission. There were six limitations. First, factors could only be tested if the data were available routinely by PCT and there will be other factors affecting admission that we were unable to include. Importantly some factors will be related to the population, which healthcare managers are unable to change, such as severity of illness. A key missing variable was distance to hospital because this has been shown to explain variation in emergency admission rates between GPs, with higher emergency admissions for practices close to a hospital.7 We could not generate a distance variable because PCT populations often do not use a single hospital but a number of hospitals within or outside the PCT boundaries. However, the geographical variable in our analysis may have addressed some of this issue in that distance to hospital is likely to be longer in rural than urban areas. Other important missing variables were related to social services, nursing homes, intermediate care, and system-level variables such as integration and coordination between services. Second, a large number of predictors were tested (n=30) for the number of subjects (n=150) and this can result in some factors being significant by chance and an over-optimistic regression with regards to goodness of fit. Third, the final regression was dependent on the variables that were tested for inclusion. For example, at an earlier stage of the study we included length of stay <2 days rather than <1 day because we were concerned that coding differences might account for variation. Later, we decided that length of stay less than 2 days might reflect discharge policy rather than admission policy so changed it to less than 1 day. By making this decision, the rate of attendance at emergency departments became a statistically significant addition to the regression. Fourth, it was not clear exactly how the factors affected admission rates. For example, high emergency department attendance rates might indicate a lack of availability or accessibility of alternative sources of urgent care in systems for example, minor injury units or walk-in centres, or that an emergency department was located in a densely populated area with short travel distance to the emergency department. Higher conversion rates from emergency department attendance to admissions might be caused by risk adverse decision making in the emergency department or lack of access to alternative services to admission at the emergency department. The short length of stay might indicate coding differences between hospitals for the same types of cases, or different management practices related to the emergency department, or simply that avoidable admissions tend to stay in hospital for less than a day. The next stage of our wider study is case studies of six systems with high and low admission rates for conditions rich in avoidable admissions to study systems in depth and understand how emergency and urgent care services are managed. Fifth, data errors in routine data may account for some of the variation. We substituted the median for very high values for two factors. The findings were the same when we included these values. Finally, regressions can overestimate correlation if the dependent and independent variables share the same denominator. Many of our variables were based on the PCT population. Taking the logarithm of the independent variables removes this problem. This made little difference to the findings. For example, employment deprivation explained 70% rather than 72% of variation.
Comparison with other studies
Deprivation has been identified as an important factor within multiple regressions, explaining variation in emergency admissions.7 ,9 ,30–34 It has also been identified as explaining very large amounts of the variation in emergency admissions between GPs,30–33 although this is not always the case.35 Disability living allowance explained 62% of variation in standardised emergency admission rates between primary care groups,30 socio-demographic patient characteristics accounted for 45% of variation in emergency admissions between GPs,31 age and deprivation explained 64% of variation between practices,32 and age, sex, ethnicity and deprivation explained 64% of preventable hospital admissions.33 The reasons proposed for deprivation explaining so much variation were that people in deprived areas may be more ill, may present later or may not have social support at home.31 We have shown that deprivation and prevalence of disease are correlated and indeed recent evidence shows a strong association between deprivation and multimorbidity.36 There is likely to be more to deprivation than high levels of morbidity because in our regression deprivation explained much more variation than disease prevalence. Researchers suggest that people from deprived communities may have difficulty negotiating access to services when they are ill.37 In the context of our study, this may result in under-use of existing community-based services which could help people to avoid a hospital admission.
Primary care factors have been tested in previous studies and found to explain small amounts of variation in emergency admissions7 ,9 ,31 ,35 or none at all.32 ,33 Aspects of primary care included patients reporting being able to see a particular GP,7 having access to a GP within 2 days,9 or being able to book an appointment with a preferred doctor.36 These aspects of perceived access to in-hours GP are relevant to avoidable emergency admissions because people with acute exacerbations may not be able to access urgent appointments at their GP or may perceive this to be a barrier. Indeed in our univariate regression, perceptions of good access to a GP within 48 h were related to lower admission rates. This factor was included in the final multiple regression but the relationship was in the opposite direction. This might be explained by the inclusion of emergency department attendance rates which in other studies were predicted by satisfaction with telephone access to GP38 and amount of support from a primary care team.39 That is, perceived poor access with GP can increase emergency department attendances which in turn result in emergency admissions, and perceived good access to urgent GP may also increase emergency admissions. One study found that the hospital which patients were admitted to explained 10% of variation,31 and we found that the hospital may have a significant effect in terms of admitting people who stay for less than a day.
Implications for policymakers and service providers
We found that deprivation accounts for a large amount of variation in admissions of selected health conditions where admission could be avoided by emergency and urgent care systems. Deprivation is strongly associated with multimorbidity and we have not been able to disentangle complex causal pathways using our study design. It is important to focus on what healthcare providers can do to reduce these avoidable admissions. We suggest investigating whether short-stay emergency admissions are related to coding differences or hospital management of emergency department attendances, why some emergency departments convert more attendances to admissions than others, why some populations think they have better access to urgent GP appointments than others, and whether ambulance services in urban areas are able to match those in rural areas by transporting lower proportions of callers to hospital. It is important not to treat population deprivation as a nuisance within this type of analysis. A key finding here is that the greatest potential for health services to reduce avoidable emergency admissions lies with focusing interventions to reduce admissions on deprived communities.
Conclusions
Variation in potentially avoidable emergency admissions was explained mainly by population factors. Healthcare providers can reduce avoidable emergency admissions by investigating why some populations attend emergency departments more than others, why some emergency departments convert more attendances to admissions than others, why some ambulance services transport more of their calls to hospital than others, and why some populations have better access to urgent GP appointments than others. The greatest potential for reduction in avoidable emergency admissions lies with understanding more about how health services can best provide care to deprived communities in ways that avoid emergency admission.
References
Supplementary materials
Supplementary Data
This web only file has been produced by the BMJ Publishing Group from an electronic file supplied by the author(s) and has not been edited for content.
Files in this Data Supplement:
- Data supplement 1 - Online table
Footnotes
-
Contributors AOC, JN, SG and JT designed the study. RM and TP calculated the emergency admissions rate. EK identified variables for testing. All authors contributed to analysis and interpretation. AOC wrote the first draft of the article and all authors contributed to the final article. AOC acts as guarantor.
Disclaimer
-
The views and opinions expressed in this article are those of the authors and do not necessarily reflect those of the HS&DR Programme, NIHR, NHS or the Department of Health.
-
Funding This project was funded by the National Institute for Health Research Health Services and Delivery Research Programme (project number 10/1010/08).
-
Competing interests None.
-
Provenance and peer review Not commissioned; externally peer reviewed.