Article Text

Abstract
Background Avoidable hospital mortality is often attributable to inadequate patient vital signs monitoring, and failure to recognise or respond to clinical deterioration. The processes involved with vital sign collection and charting; their integration, interpretation and analysis; and the delivery of decision support regarding subsequent clinical care are subject to potential error and/or failure.
Objective To determine whether introducing an electronic physiological surveillance system (EPSS), specifically designed to improve the collection and clinical use of vital signs data, reduced hospital mortality.
Methods A pragmatic, retrospective, observational study of seasonally adjusted in-hospital mortality rates in three main hospital specialties was undertaken before, during and after the sequential deployment and ongoing use of a hospital-wide EPSS in two large unconnected acute general hospitals in England. The EPSS, which uses wireless handheld computing devices, replaced a paper-based vital sign charting and clinical escalation system.
Results During EPSS implementation, crude mortality fell from a baseline of 7.75% (2168/27 959) to 6.42% (1904/29 676) in one hospital (estimated 397 fewer deaths), and from 7.57% (1648/21 771) to 6.15% (1614/26 241) at the second (estimated 372 fewer deaths). At both hospitals, multiyear statistical process control analyses revealed abrupt and sustained mortality reductions, coincident with the deployment and increasing use of the system. The cumulative total of excess deaths reduced in all specialties with increasing use of the system across the hospital.
Conclusions The use of technology specifically designed to improve the accuracy, reliability and availability of patients’ vital signs and early warning scores, and thereby the recognition of and response to patient deterioration, is associated with reduced mortality in this study.
- Adverse events, epidemiology and detection
- Control charts, run charts
- Decision support, computerized
- Information technology
- Mortality (standardized mortality ratios)
Statistics from Altmetric.com
- Adverse events, epidemiology and detection
- Control charts, run charts
- Decision support, computerized
- Information technology
- Mortality (standardized mortality ratios)
Background
Failure to recognise and respond to patient deterioration in hospitals is considered a major cause of avoidable morbidity and mortality.1–5 One of the initial steps in identifying deterioration involves the measurement of vital signs.6 ,7 For most patients on general wards, routine vital sign measurements are undertaken manually and intermittently, with or without automated machines, at intervals based on the patients’ severity of illness.4 ,7–9 Vital signs data are generally recorded on paper charts placed at the end of the patients’ beds or in their rooms. These processes are subject to potential error and/or failure, such as inadequate monitoring frequency,1–3 ,5 ,10–12 incomplete data,1 ,10 ,13 inaccurate calculations of early warning score (EWS),14–17 and poor legibility and interpretability of charts,18 ,19 all of which have been implicated in the failure to recognise, or respond to, patient deterioration.1–3 ,5
We postulated that an appropriately designed clinical information technology (IT) system could improve the reliability of collecting and charting vital signs; their integration, interpretation and analysis; and the delivery of decision support regarding subsequent clinical care. Therefore, staff from Queen Alexandra Hospital (QAH), Portsmouth and The Learning Clinic (TLC), London used existing knowledge, research data and National Institute for Health and Care Excellence (NICE) recommendations4 to design an electronic physiological surveillance system (EPSS)20—VitalPAC—with the specific objectives of improving the accuracy, reliability, availability and clinical impact of patients’ vital signs datasets and EWS records. The EPSS was subsequently deployed across QAH and a second acute general hospital in England—University Hospital Coventry (UHC)—in phased rollouts on each site. We report an observational study of the temporal changes in hospital mortality associated with the implementation of the EPSS in the two hospitals.
Method
Ethical committee approval
The Isle of Wight, Portsmouth and South East Hampshire Research Ethics Committee (study ref. 08/02/1394) approved the study.
The electronic physiological surveillance system (EPSS)
The EPSS—VitalPAC—is a specially designed software that prompts nurses to record a complete set of vital signs at the patient's bedside at appropriate intervals on handheld computing devices.20 For each vital sign, the EPSS takes the measured physiological value and the locally embedded aggregate weighted early warning scoring system (which were different at QAH and UHC) to assign a weighting, based on the derangement of the physiological value from an arbitrarily agreed ‘normal’ range. The EPSS automatically and accurately calculates the patient's EWS and provides instant bedside decision support to the staff, on a graded basis according to the EWS value.20 This includes when the next set of vital signs is due, whether care should be escalated to senior staff (eg, rapid response team (RRT)21), and the required speed of any response. These messages are delivered directly to the handheld device in use by the staff at the bedside via standard colour-coded screen messages. The devices communicate wirelessly with the hospital's computer system. They routinely record the vital signs data in a clear and easily interpreted electronic record that can be viewed anywhere in the hospital by staff with the appropriate access rights, using mobile or fixed computers linked to the hospital intranet.20 The EPSS also pulls in data from the hospital patient administration system, laboratory results and other clinical information stored electronically.
Setting and intervention
QAH and UHC are large (>1000 bed) acute general hospitals approximately 240 km apart in England. An acute care educational programme for ward staff,22 the use of a paper-based EWS system23 and an RRT21 were all well established in each hospital, many years before the implementation of the EPSS. EPSS implementation at the hospitals differed in several aspects. Vital signs charts were viewable on wireless PC tablets and desktop PCs at QAH, but only on desktop PCs on wards at UHC. The EPSS software used the locally embedded EWS (which were different at QAH and UHC). The EPSS was implemented sequentially in wards, although the speed and order differed at each hospital. As EPSS was implemented progressively in each ward, charting of vital signs there became electronic and paper-based charting ceased.
QAH
-
Following a pilot period of 14 months during which the system was developed, QAH deployed the EPSS to the Acute Medicine Unit (AMU) in May 2006 and then the Surgical Assessment Unit (SAU) in January 2007. The EPSS was implemented on a single medical ward in June 2008 and three high-risk medical wards (cardiology, pulmonology and elderly care) in February 2009. Further deployment across the hospital was delayed until after the opening of a new hospital wing on 15th June 2009. Thereafter, hospital-wide rollout continued in the following order—medical, surgical, trauma and orthopaedic (T&O) wards—and was completed in December 2009. During the implementation process (February–December 2009), a team of one whole time equivalent (WTE) nurse, 0.25 WTE trainers provided by TLC and 0.2 WTE physicians facilitated user training at QAH. After deployment, the nurse was available for postdeployment issues such training, support and operational policies for a further 7 months.
UHC
-
UHC conducted a single-ward pilot (May 2007–February 2008) before rolling out the EPSS on all adult inpatient wards, in no particular specialty order, from March 2008. Deployment to the UHC emergency admissions unit (EAU), which admits acute medical emergencies, was completed in April 2009. The remaining surgical and T&O wards implemented the EPSS late in 2009. A team of six WTE nurses provided user training and support at UHC for a total of 6 months.
The EPSS was not implemented in the maternity wards, paediatric units and intensive care units at either site.
Data collection and sources of data:
We collected two key items of data: a measure of EPSS implementation and hospital mortality.
Measure of EPSS implementation
-
We used the number of observation sets recorded per month to track the implementation of the EPSS.
Hospital mortality
-
The UK National Health Service (NHS) uses outcome data from 56 diagnosis groups (which account for 83% of inpatient deaths in England) to monitor and compare hospital performance.24 We analysed monthly observed mortality data from these diagnosis groups at QAH and UHC from July 2004 to June 2011. Admission data were obtained for both hospitals by means of the ‘Real Time Monitoring’ tool (Dr Foster Intelligence, London).25 Our numerator is the count of deaths at the point of discharge. Day-case admissions (inpatient admissions where the intention was to treat and discharge on the same day, and this was achieved) were excluded from the denominator; day-case deaths were retained in the numerator.
-
The overall preintervention average crude mortality rate for the aforementioned collection of 56 diagnosis groups was used to calculate the expected deaths in the intervention and postintervention years based on the number of admissions with the relevant diagnoses in those years. Avoided deaths are equal to the difference between the observed and expected deaths in each calendar year.
Data analysis
Crude monthly and annual mortality rates were calculated with 95% CIs based on the normal approximation for binomial proportions. Statistical analyses were performed using Microsoft Excel 2007 (Microsoft Corporation, USA), and Stata/IC 11.1 (StataCorp LP, USA). The mortality data were used in two ways:
Method 1: multi-year trend analysis
-
Seasonally adjusted, monthly, statistical process control charts26 of hospital mortality were produced for both hospitals from July 2004 to July 2011 inclusive and were studied for a persistent change in the run of data points around the mean (ie, evidence of special cause change). Upper and lower control limits were, as usual, set at 3 SDs from the mean. Seasonal variation was removed to emphasise the underlying trend and help identify any special cause change. Adjusting for seasonality required the calculation of monthly factors from the 7 years of data by means of a weighted 13-month moving average used as a symmetric filter. This yielded 6 years of monthly factors (since the first and last 6 months do not meet the centring requirement), which were used to remove the seasonal variation in deaths. Using a similar process, monthly admissions data were seasonally adjusted to derive a seasonally adjusted mortality rate (SA-MR) for each hospital.
Method 2: analysis of deaths occurring in specialties
-
The seasonally adjusted deaths from July 2004 to July 2011 for Medicine, Surgery and T&O were analysed using a cumulative sum control (CUSUM) method,27 plotting the cumulative monthly difference between expected deaths and the seasonally adjusted observed deaths. For each month, and each specialty group, expected deaths were calculated as the product of the mean mortality rate for the whole period over which the CUSUM is plotted (ie, July 2004–July 2011) and the seasonally adjusted admissions for the month. ‘Medicine’ included Cardiology, Diabetic Medicine, Endocrinology, Gastroenterology, General Medicine, Geriatric Medicine, Infectious Diseases, Nephrology, Neurology, Respiratory Medicine, Rheumatology, Clinical Haematology and Oncology. ‘Surgery’ included General, Breast, Cardiothoracic, Colorectal, Hepatobiliary & Pancreatic Surgery, Neurosurgery, Plastics, Renal Surgery, Transplantation, Upper Gastrointestinal, Urology, and Vascular Surgery. Control limits were added using the method described by Grunkemeier et al.28
Results
During implementation of EPSS across QAH, crude mortality fell from 7.75% (2168/27 959) at baseline (2004) to 6.42% (1904/29 676) after implementation (2010) (p<0.0001), with an estimated 397 fewer deaths (table 1). Similarly, at UHC, crude mortality fell from 7.57% (1648/21 771) at baseline (2006) to 6.15% (1614/26 241) (2010) (p<0.0001) at UHC (estimated 372 fewer deaths) (table 1). In both hospitals, SA-MR fell markedly and remained low in both hospitals within a short time of electronic physiological surveillance being implemented for the whole hospital journey (ie, AMU plus one or more medical wards at QAH; EAU plus medical wards at UHC) (Figure 1A and B) for medical patients. Before these points (QAH, June 2008: UHC, April 2009), seasonally adjusted mortality was predominantly above the 7-year mean (QAH 30/47 (63.8%) months; UHC 45/57 (78.9%)), whereas afterwards, it was seldom so (QAH 4/37 (10.8%) months; UHC 2/27 (7.4%)). In both hospitals, there was also less variation in SA-MR. Figure 1A and B also show special cause variation indicated by 28 successive SA-MR observations below the centreline at QAH, and two runs of 18 and 7 points at UHC.
Annual in-patient mortality for Queen Alexandra Hospital (QAH) (2004–2010) and University Hospital Coventry (UHC) (2006–2010)

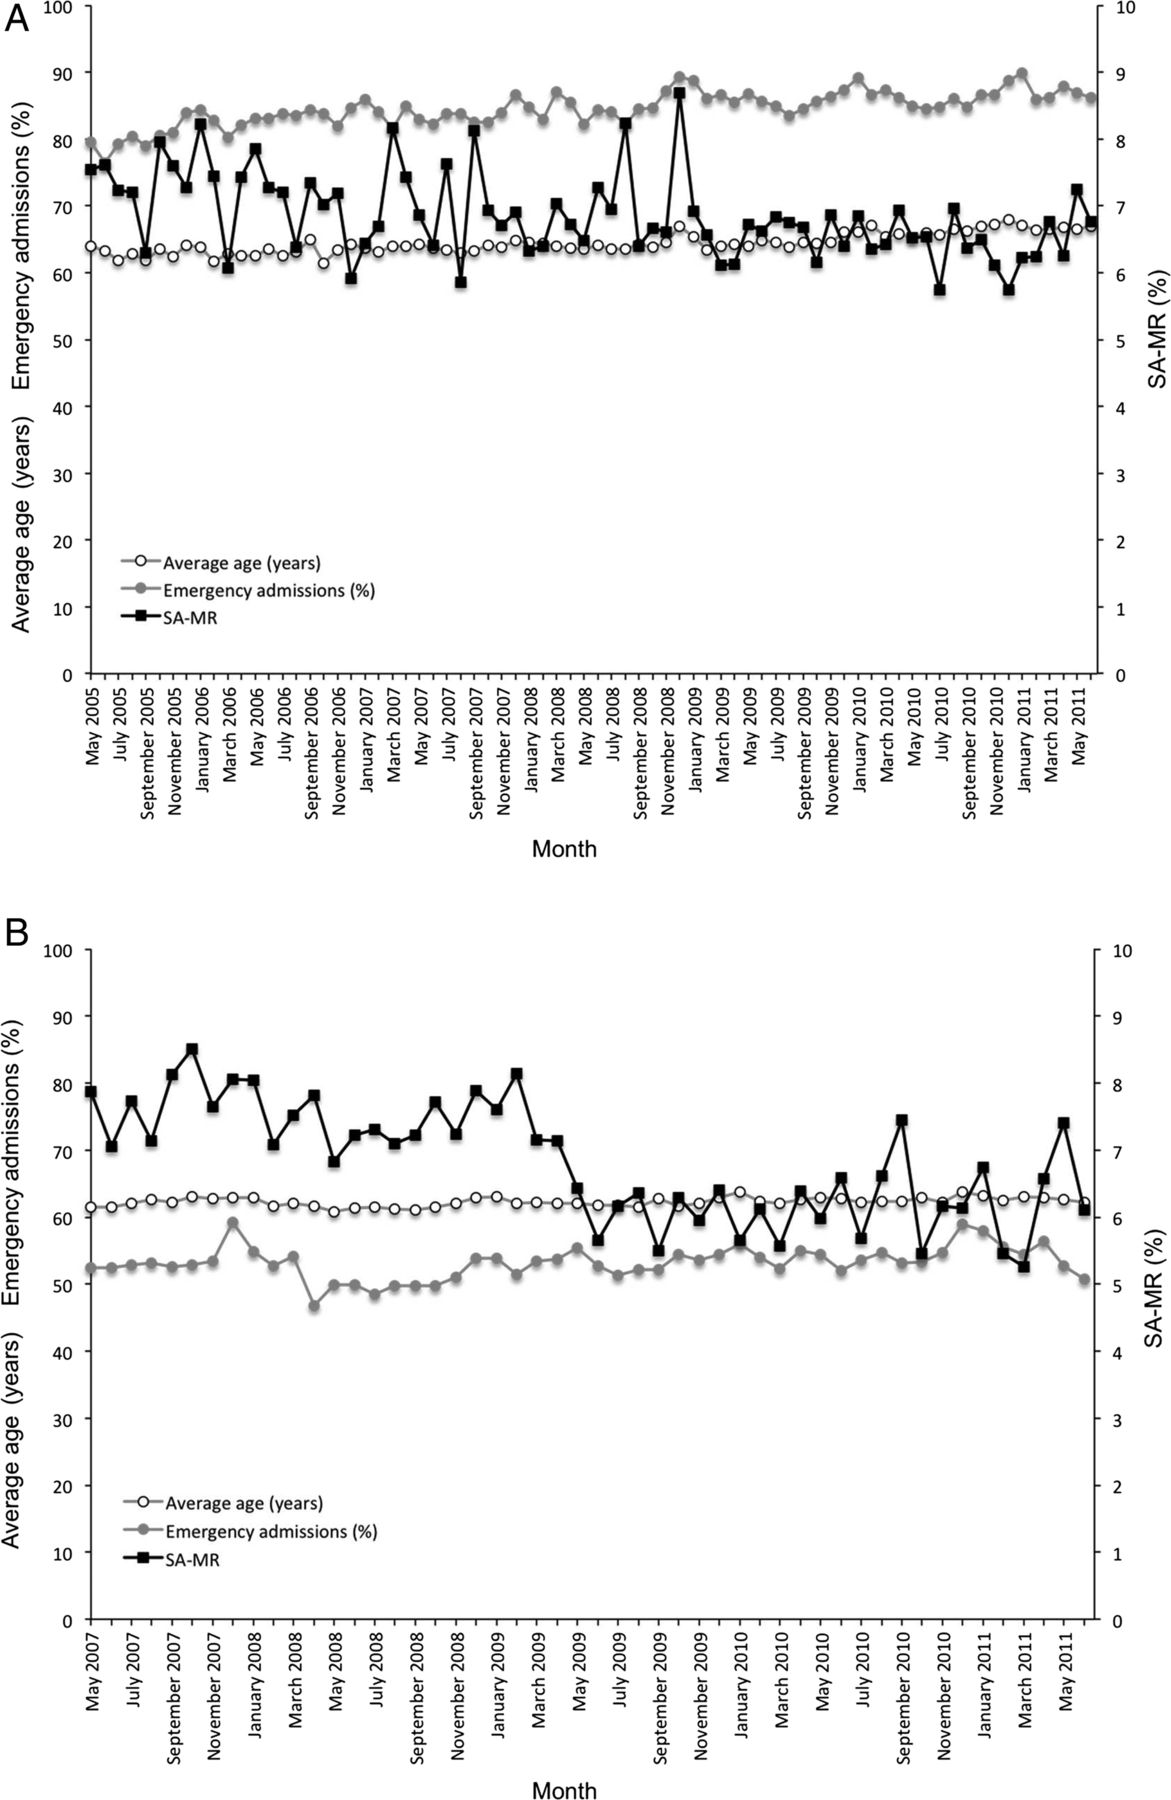
p-Chart with control limits of ±3 SDs of seasonally adjusted mortality rate (SA-MR) at Queen Alexandra Hospital (figure 1A) and University Hospital Coventry (figure 1B). Observations recorded by electronic physiological surveillance system implementation are superimposed. ucl, upper control limit; lcl, lower control limit.
During the EPSS implementation period, average patient age rose from 63.9 years (May 2005) to 67.0 years (June 2011) and percentage of emergency admissions from 79.5% (May 2005) to 86.2% (June 2011) at QAH (figure 2A). At UHC, there was a slight rise in average patient age (61.5 years, May 2007; 62.1 years, June 2011) and a slight fall in the percentage of emergency admissions (53.4%, May 2005; 50.8%, June 2011) (figure 2B).
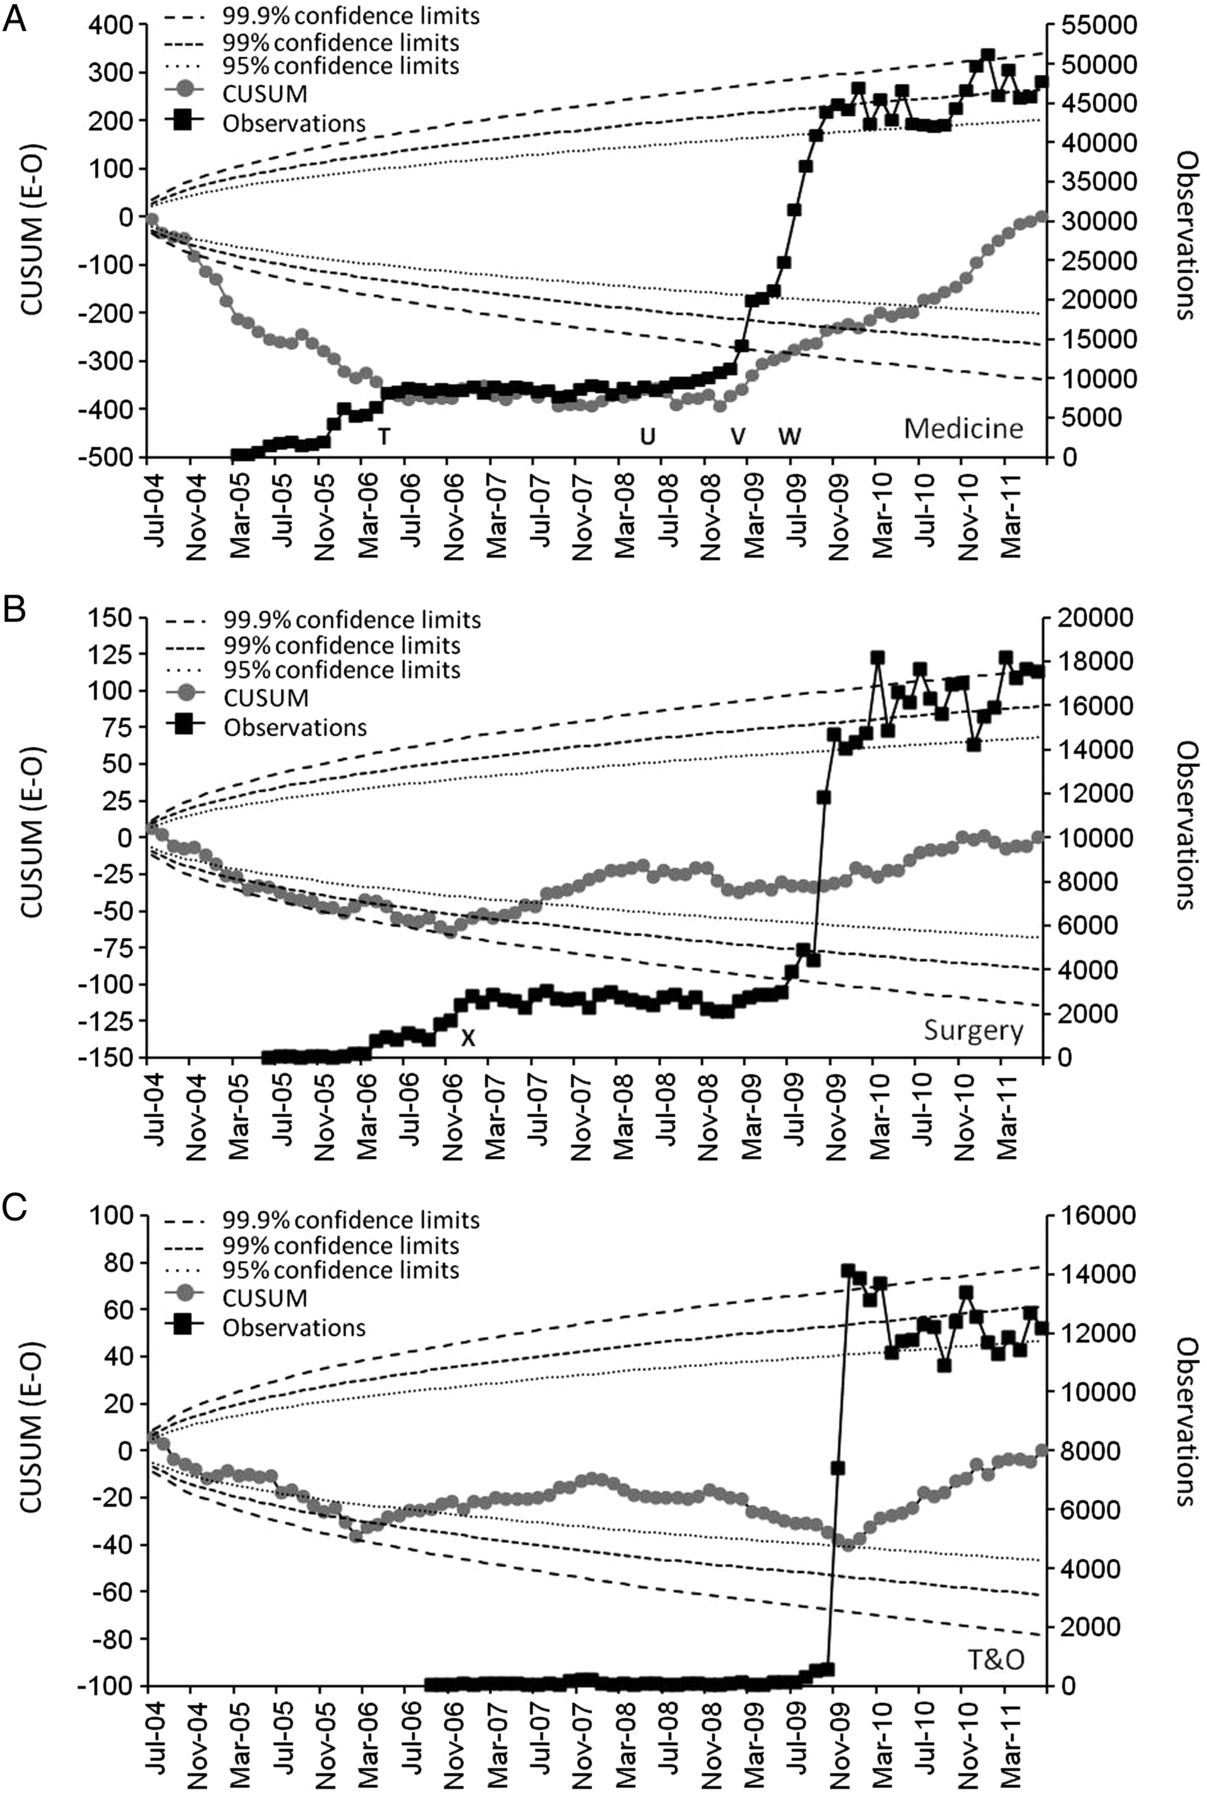
For the CUSUM charts (figure 3A–C, QAH; figure 4A–C, UHC), a downward slope corresponds to more deaths than expected and an upward slope corresponds to fewer deaths than expected. At QAH, all three specialties show a steadily rising total of excess deaths from July 2004. However, in May 2006, coincident with deployment of EPSS in AMU, the rate of rise slowed and plateaued (figure 3A) before falling (Feb 2009 onwards) with the hospital-wide rollout. A more abrupt reversal was seen following EPSS implementation in SAU in January 2007 (figure 3B). The reduction in mortality in T&O followed immediately after full implementation there (figure 3C). In all three specialties, increasing use of the EPSS across the hospital was associated with a decreasing cumulative total of excess deaths (figure 3A–C).

Cumulative sum control (CUSUM) charts of cumulative monthly difference between expected and seasonally adjusted observed deaths (E-O) in three specialties (Medicine, 3A; Surgery, 3B; trauma and orthopaedic (T&O), 3C) at Queen Alexandra Hospital. Control limits added using the method described by Grunkemeier et al.28 ‘T’ denotes deployment of the electronic physiological surveillance system to the Acute Medicine Unit (AMU). ‘U’ denotes implementation to the first medical ward outside the AMU. ‘V’ denotes sequential hospital-wide deployment, beginning with three medical wards. ‘W’ denotes opening of new hospital wing. ‘X’ denotes deployment to the Surgical Assessment Unit.

Cumulative sum control (CUSUM) charts of cumulative monthly difference between expected and seasonally adjusted observed deaths (E-O) in three specialties (Medicine, 4A; Surgery, 4B; trauma and orthopaedic (T&O), 4C) at University Hospital Coventry. Control limits added using the method described by Grunkemeier et al.28 ‘Y’ denotes sequential deployment of the electronic physiological surveillance system to adult inpatient wards. ‘Z’ denotes deployment to the Emergency Admissions Unit.
At UHC, there was also a rising total of excess deaths from July 2004 for all three specialties (figure 4A–C). For Medicine, the mortality plateaued following the first use of the EPSS, but did not begin to fall until the EPSS was also implemented in the EAU (figure 4A). The increasing use of the EPSS in the surgical and T&O wards from April 2008 onwards was again associated with reducing mortality, although the reduction was delayed in the T&O wards (figure 4B and C).
Discussion
This study provides evidence that the implementation of an EPSS specifically designed to increase the reliability of the collection, documentation and display of vital signs in hospital is associated with a significant reduction in hospital mortality. While impossible to prove a direct cause-and-effect relationship between the two, the development of the EPSS in one hospital, its subsequent implementation in a second hospital, approximately 240 km away and the almost identical results from the two sites support our view that this is a significant finding. Importantly, there are temporal relationships between mortality reduction and the events at hospital and specialty levels in both hospitals. Together, the results appear to suggest that the intervention has both reproducibility and generalisability, based on a plausible direct relationship.29
The results suggest a strong relationship between increasing use of the EPSS and reduced mortality in all three specialties at each hospital. The different timing of the reduction at the two hospitals also appears to reflect the different deployment schedules in all specialty groups except T&O at UHC, where a lag of almost 12 months is seen. We are unable to offer a definite explanation for this latter finding, but it may be due to issues that are not addressed directly by the EPSS and which have been reported in other hospitals, for example, staff reluctance to call for help with deteriorating patients.30 ,31
In both hospitals, most deaths occur in medical and elderly unscheduled admissions. For medical admissions at both hospitals, achieving surveillance for the whole patient journey appears to have been extremely important in reducing mortality (figures 3A and 4A). This point was reached at QAH for some medical patients in June 2008 when the EPSS was extended beyond the AMU to a single medical ward (a stroke ward). Any impact on mortality in this ward was not visible in the hospital-wide SA-MR, however, the effect of the subsequent implementation of the EPSS on three high-risk medical wards in February 2009 is clearly apparent (figure 3A). At UHC, although the EPSS was deployed on the medical wards early on, it was only deployed in the EAU in April 2009. The reduction in mortality occurred almost instantaneously thereafter (figure 4A). In both hospitals, SA-MR fell markedly and remained low within a short time of electronic physiological surveillance being implemented for the whole hospital journey (ie, AMU plus one or more medical wards at QAH; EAU plus medical wards at UHC) (figure 1A and B) for medical patients. Before these points (QAH, June 2008: UHC, April 2009), seasonally adjusted mortality was predominantly above the mean (QAH 30/47 (63.8%) months; UHC 45/57 (78.9%)), whereas afterwards, it was seldom so (QAH 4/37 (10.8%) months; UHC 2/27 (7.4%)). In both hospitals, there was also less variation in SA-MR. In figure 1A and B, the SA-MR plot also shows special cause variation indicated by seven or more successive SA-MR observations below the centreline at both QAH and UHC, immediately following the point at which electronic vital signs surveillance in medical patients was complete for the whole patient journey for at least some patients.
Of necessity, our research was a pragmatic observational study of real-world system deployments in two large hospitals. The difficulties of undertaking randomised controlled trials of technologies like ours—complexity, required duration and expense—have been previously discussed.32 The possibility of undertaking a stepped-wedge design study33 was precluded by project management considerations, limited availability of project staff, contamination by movement of some patients between wards and specialties and the complexity of creating matching cohorts for all inpatient specialties.
A weakness of our study is that we did not measure all-cause mortality, but focused on that in the 56 diagnosis groups used by the UK NHS to monitor and compare hospital performance.24 However, there appears to be a very strong relationship between mortality in the 56 diagnosis groups studied and that for all causes.34 Our findings could also be accounted for by a changing admission case-mix during the study. However, age and percentage of emergency admissions increased at QAH during this period, and at UHC there was no real change in either. Certainly, there were no major case-mix changes synchronous with the observed reductions in mortality. No adjustment was made in our analyses for patients with decisions of Do Not Attempt Cardiopulmonary Resuscitation.
It is also possible that a range of other changes in practice other than the EPSS (eg, introducing care bundles,35 altering nurse staffing levels36) could have caused or contributed to the year-on-year mortality reduction observed. However, to have this impact, it would have been necessary for these to have been introduced at very specific and different times in the given specialties at each of the hospitals. The opening of the new hospital wing at QAH (15 June 2009) occurred 4 months after the observed reduction in hospital mortality and could not explain the reduction in mortality seen at UHC. Finally, we could not identify any service reconfigurations, new processes, or increases in palliative care admissions or discharges to the local hospices that might account for our results.
It is also conceivable that the focus on the EPSS within the two hospitals produced a significant Hawthorne effect,37 which might account for some or all of the impact. However, the project teams’ focus on the EPSS deployment in each ward was usually limited to only 1–2 weeks and it seems improbable that this would result in an impact lasting for over 2 years. The finding that mortality reductions for each specialty occurred at different times but on each occasion coincided with the intervention in two separate hospitals also suggests that the EPSS itself was the critical agent of change.
Why might the EPSS have reduced the hospital mortality? Before the introduction of the EPSS, staff in the study hospitals documented vital signs on paper charts, manually calculated EWS values and followed escalation protocols written on paper. Given international evidence, it is likely that vital sign measurements were undertaken infrequently,1–3 ,5 ,10–12 datasets were incomplete1 ,10 ,13 and there were errors in the calculation of EWS values.14–17 Using traditional paper-based vital sign charts limited their instant availability to their immediate vicinity, usually at the foot of the patient's bed.
We investigated an electronic solution to these problems, as IT systems are known to ‘…improve communication, make knowledge more readily accessible, require key pieces of information (such as the dose of a drug), assist with calculations, perform checks in real time, assist with monitoring, and provide decision support…’38 In developing the EPSS, we deliberately ‘designed out’ errors and known system failures to improve the reliability, efficiency and effectiveness of the vital signs collection, charting and escalation processes. We incorporated many of the principles outlined by Bates et al, for example, integration of the EPSS in the user's workflow, fast delivery of decision support, anticipation of the user's needs, ensuring user acceptability by incorporating user feedback during the pilot phases, use of simple input screens, asking for data only when it was required and enabling tracking of the responses to the decision support.39
The EPSS requires the entry of a full vital signs dataset at each routine observation. Data from both study sites show that ∼98% of all vital signs datasets recorded by the EPSS are complete. It then uses a graded response strategy recommended by NICE4 to automatically determine the timing of the next vital signs measurement for each patient and provide highly visible, up-to-date reminders that observations are due.20 The EPSS warns of attempts to enter out-of-range data or erroneous values. It consistently assigns vital sign parameters to the correct EWS weightings, automatically and accurately calculates an EWS value and instantly displays the EWS on the handheld devices at the bedside.20 Direct bedside entry of the vital signs dataset makes it quicker for staff to enter the information into patients’ records than with manual methods.15 ,16 The decision support provided by the EPSS to bedside staff is both instantaneous following the input of vital signs data and explicit about the desired escalation protocol (eg, increase monitoring frequency, or involve RRT, or critical care staff).20 Finally, the EPSS makes the raw data and the vital signs charts instantaneously available across the whole hospital via wireless PC tablets or desktop PCs, thereby enabling rapid spread of the time-critical knowledge of a change in a patient's clinical condition to clinical teams involved in the patient's care.20 Given that errors and failures in the processes involved in vital signs collection, charting and escalation have been implicated in the failure to recognise or respond to patient deterioration, it is intuitive that improving these processes might reduce adverse patient outcomes.
Acute care educational programmes for ward staff,22 paper-based EWS systems23 and RRTs21 were already in place in both hospitals before implementation of the EPSS. These are essential components of the five-ring ‘Chain of Prevention’6 (ie, Education, Monitoring, Recognition, Call for help, Response), which is thought to be necessary for early detection and response to patient deterioration. By design, the EPSS improved the monitoring of patients’ vital signs, facilitated better recognition of deterioration and increased the likelihood that ward staff would call for help from senior clinicians and/or the RRT. Therefore, the addition of the EPSS to the existing rapid response system structures is likely to have ‘strengthened’ the ‘Chain of Prevention’,6 making deterioration and death less likely.
Finally, other research into technological solutions to improve the recognition of, and response to, patient deterioration has been limited to small-scale implementations, studies in specific patient groups (eg, patients receiving RRT calls) or focuses on process measures.40–51 Although many of these studies suggest potential benefit, ours is the first to consider a two-centre, whole hospital implementation and to measure mortality in all major adult specialties. Our findings suggest that implementation of technology specifically designed to improve the processes around the recognition of, and response to, patient deterioration can change both process and patient outcomes. The similarity of the impact in all three main specialties in two unconnected hospitals ∼240 kilometres apart provides support to this being a ‘cause and effect’ relationship, but prospective studies are needed to confirm these results.
Acknowledgments
The authors would like to acknowledge the efforts of the medical, nursing and administrative staff at Portsmouth Hospitals NHS Trust and University Hospitals Coventry and Warwickshire NHS Trust who collected the data used in this study, and thank the information systems and senior management teams at both hospitals for access and permission to use the data for research purposes. Dr Paul Meredith had full access to all the data in the study and takes responsibility for the integrity of the data and the accuracy of the data analysis.
References
Footnotes
-
Contributors PS led the intervention at QAH, steered the analysis of the data, wrote the original draft and coordinated amendments proposed by other authors. PS, RK, DP, GS and PM developed the concept of the observational study. PM researched and developed the analytical methods, obtained mortality and vital signs datasets for QAH and UHC, and conducted all analyses of QAH and UHC data. MM provided critical advice on methodology, data quality and case-mix adjustment. GS, MM, DP, PG and RK critically appraised the outcome data and methods. DW and VF led the intervention at UHC and ensured that service provision and VitalPAC deployment are correctly described. All authors contributed to amendments of the manuscript and approved the final version. GS is guarantor for the manuscript.
-
Competing interests VitalPAC is a collaborative development of The Learning Clinic (TLC) and Portsmouth Hospitals NHS Trust (PHT). At the time of the research, PHT had a royalty agreement with TLC to pay for the use of PHT intellectual property within the VitalPAC product. PM, DP PS and PS are employed by PHT. GS was an employee of PHT until 31/03/2011. MM, PS and the wives of GS and DP, are minority shareholders in TLC. GS, DP, and PS are unpaid research advisors to TLC, and have received reimbursement of travel expenses from TLC for attending symposia in the UK. MM facilitated a pilot study of VitalPAC in a West Midlands hospital, which subsequently established a tender process for an electronic early warning scoring system. VF and DW have no conflicts of interest.
-
Provenance and peer review Not commissioned; externally peer reviewed.