Article Text

Abstract
Background Optimising clinical responses to deteriorating patients is an international indicator of acute healthcare quality. Observation charts incorporating track and trigger systems are an initiative to improve early identification and response to clinical deterioration. A suite of track and trigger ‘Observation and Response Charts’ were designed in Australia and initially tested in simulated environments. This paper reports initial clinical user experiences and views following implementation of these charts in adult general medical-surgical wards.
Methods Across eight trial sites, 44 focus groups were conducted with 218 clinical ward staff, mostly nurses, who received training and had used the charts in routine clinical practice for the preceding 2–6 weeks. Transcripts of audio recordings were analysed for emergent themes using an inductive approach.
Findings In this exploration of initial user experiences, key emergent themes were: tensions between vital sign ‘ranges versus precision’ to support decision making; using a standardised ‘generalist chart in a range of specialist practice’ areas; issues of ‘clinical credibility’, ‘professional autonomy’ and ‘influences of doctors’ when communicating abnormal signs; and ‘permission and autonomy’ when escalating care according to the protocol. Across themes, participants presented a range of positive, negative or mixed views. Benefits were identified despite charts not always being used up to their optimal design function. Participants reported tensions between chart objectives and clinical practices, revealing mismatches between design characteristics and human staff experiences. Overall, an initial view of ‘increased activity/uncertain benefit’ was uncovered.
Conclusions Findings particularly reinforced the significant influences of organisational work-based cultures, disciplinary boundaries and interdisciplinary communication on implementation of this new practice chart. Optimal use of all chart design characteristics will be possible when these broader cultural issues are addressed.
- Human factors
- Attitudes
- Decision support, clinical
- Qualitative research
- Nurses
Statistics from Altmetric.com
Introduction
Timely recognition and appropriate management of patients showing signs of clinical deterioration is essential in ensuring optimal patient safety in acute healthcare facilities worldwide.1–3 Early signs of clinical deterioration can be detected in 60%–80% of patients at risk4 up to 48 h prior to occurrence of a potentially adverse event,5 with regular monitoring of six core physiological vital signs (respiratory rate, oxygen saturation, blood pressure, heart rate, temperature and level of consciousness).6 While various levels of automated vital sign monitoring are being integrated into some healthcare systems,7 ,8 traditional paper-based observation charts are currently the common format for recording and reporting physiological parameters of acute medical-surgical ward patients in Australia.9–11
The design and performance of paper-based observation charts in clinical practice has, however, received little systematic or theory-based attention until recently.10–12 While an observation chart should prompt and facilitate recording of patient monitoring and detection of abnormal findings, audits have consistently found both under-reporting and delays in initiation of action on the basis of abnormal observations.10 ,13 ,14 Despite practice initiatives to facilitate detection of deterioration and early intervention,15–17 early signs of patient deterioration continue to go unrecognised or there is a failure to respond.18–20
Observation charts redesigned to include track and trigger systems (TTS) have previously demonstrated improved recognition of deterioration.21–23 A TTS enables users to graph and track trends of a patient's vital signs over time24; when measurements reach predetermined abnormal thresholds, actions are recommended to trigger an appropriate clinical team response. Some TTS charts use coloured zones in the graphing section to indicate abnormal vital signs.11 Other charts include an early warning scoring system (EWSS) with points assigned to each abnormal vital sign.25 ,26 The sum of points provides an Early Warning Score designed to increase the likelihood of recognising deterioration.27 Current evidence, however, is inconclusive due to disparate variations in EWSS and poor or inadequate methodologies.28
An optimal TTS incorporates specific design features based on human factors’ principles to minimise any risk of error29; these characteristics include: separate graphing areas for core vital signs; indication of abnormal thresholds, with colours and a visual layout to minimise risk of error during documentation and alert and prompt staff to escalate care; and recommendations for appropriate actions according to a patient's deteriorating condition.6
To improve identification and response to clinical deterioration in acute care hospitals at a national level,6 the Australian Commission on Safety and Quality in Healthcare (ACSQHC) commissioned the development of a suite of Observation and Response Charts (ORC), incorporating the design principles listed above and TTS responses. Two initial chart versions (the Adult Deterioration Detection System; ADDS) were evaluated during simulation testing, and demonstrated lower error rates in comparison with a range of other charts that were in routine clinical use.24 Following this evaluation, three additional versions were developed for different levels of clinical response that aligned with local hospital escalation/rapid response team (RRT) protocols.
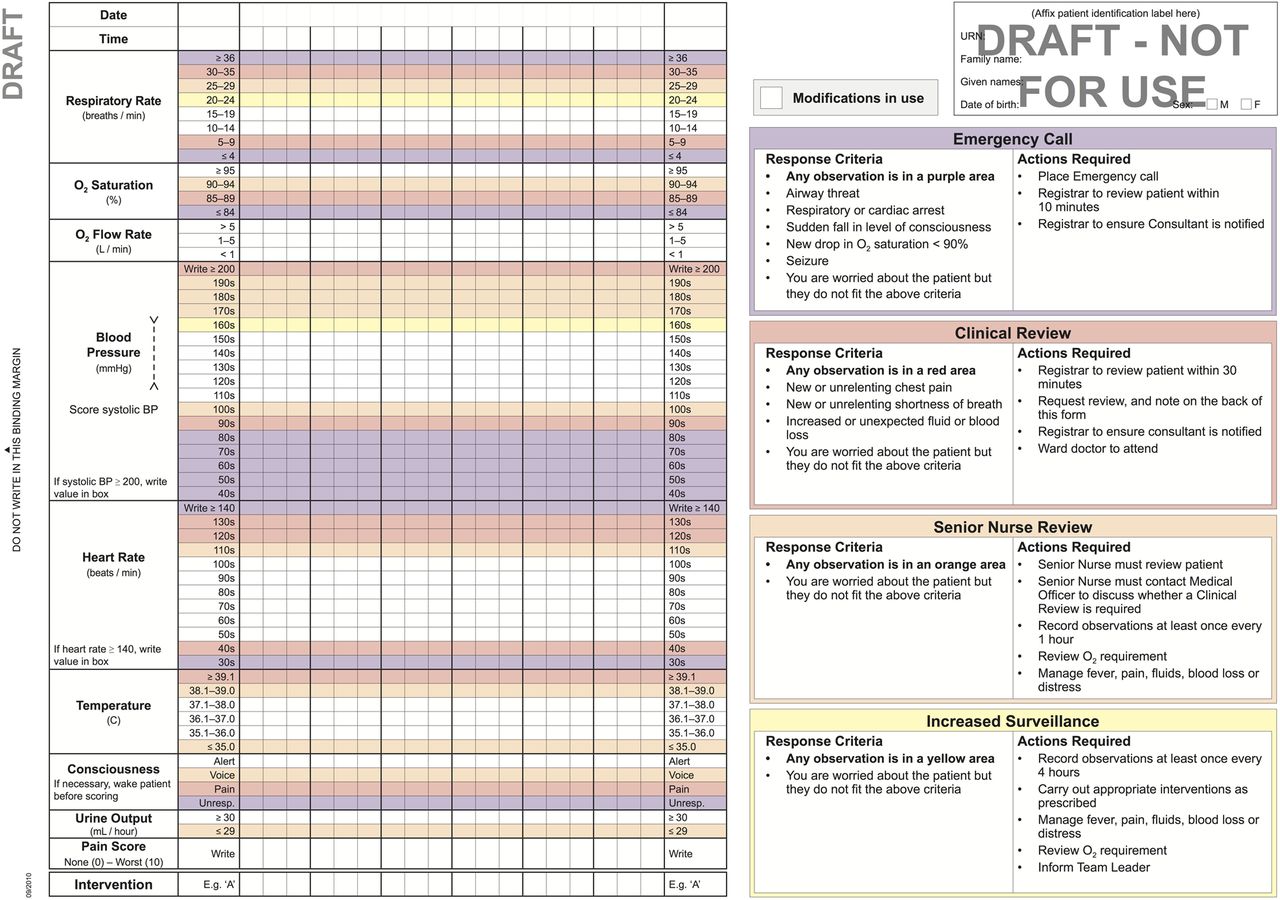
The ORC was developed as a double-sided A3-sized form with a left binding margin and a fold out to the right. When the chart is opened and folded out to the right, the inside left page contains the ‘vital signs charting area’ for documentation of nine parameters (respiratory rate, oxygen saturation, oxygen flow rate, blood pressure, heart rate, temperature, conscious level, urine output and pain score).
Each vital sign section has a range of normal values (with no shading) and a series of abnormal ranges with different coloured shading, to prompt an action according to local RRT protocols.30 For example, a systolic blood pressure in the ‘100s’ range (100–109 mm Hg) is shaded yellow and requires a senior nurse review as a response; a systolic blood pressure in the ‘80s’ range (80–89 mm Hg) is shaded purple and requires a Medical Emergency Team (‘MET’) call. The response criteria and actions required when a deterioration is identified are listed on the inside right chart page for user information (figure 1 illustrates the two inside pages of a sample four-level response ORC).

Example Observation and Response Chart (ORC)—two inside pages of a four-level response chart (used with permission, ACSQHC (Australian Commission on Safety and Quality in Healthcare)).
Calling criteria (parameters defining abnormal values) can be modified by a medical officer in a section on the cover page for individual patients. Any modifications to these criteria are reviewed according to local policy. Interventions in response to abnormal observations are also recorded in a designated section of the chart. Further details about the chart format and design characteristics are available.31 ,32
Following development of these new charts, the ACSQHC sought evaluation of the charts in clinical practice via a competitive tender process. The study reported here formed part of a larger two-phase multisite before–after mixed-methods study32 examining the clinical use and application of the ORCs in adult general acute medical-surgical wards.
Methods
One of the required objectives from the ACSQHC tender was to investigate the preferences and comments of clinical staff. This substudy reports on this objective using the study question, ‘What are the experiences and views of staff using the ORCs in clinical practice?’ Focus groups of clinical staff participants were conducted to explore their preferences and comments following introduction and use of the new charts in routine practice.
Sample
Participating sites were selected from 52 submitted expressions of interest to the ACSQHC. A purposive sample was sought to reflect the range and variety of acute healthcare facilities in Australia based on location, hospital size, public/private sector and level of service provided. Eight of nine health service sites recruited to this phase of the main study provided data for this report from four jurisdictions across Australia.
Implementation of charts in routine clinical practice
A project manager coordinated chart and study implementation, and site-based project officers with local knowledge of policy and practices were seconded to implement the charts into clinical practice and collect data at each site. Site executives were engaged as a project ‘champion’, providing executive support, commitment of key stakeholders and assistance for the project officers in profiling chart implementation and evaluation with all relevant clinical staff.
Before implementation, project officers attended a one-day training workshop on the chart design characteristics and rationale, use in practice and collection techniques of study data. Each project officer then provided extensive in-service education sessions and ongoing one-to-one staff support for chart use in clinical areas. Attendance at site education sessions was predominantly by nursing staff, as medical education time was seldom available. Medical officers, therefore, received ad hoc education primarily at the patient's bedside, during ward rounds or informal discussions.
Site staff selected a version of the ORC that aligned with their local escalation protocol and staff resources (see example in figure 1). Abnormal ranges (inside left chart page) and criteria listed (inside right chart page) were then adjusted to reflect each site's local calling criteria and RRT practices. Charts were incorporated into routine practice for between 2 and 6 weeks prior to participant evaluation. Chart implementations were service/district-wide for two clinical sites, hospital-wide for four sites and in three/four wards for the remaining three sites.
Data collection
The experiences and views of clinical staff using the charts were explored during brief semistructured focus groups conducted by the site project officers from February to March 2012. Focus groups were scheduled during shift overlap, staff development sessions and education forums to enable as many staff as possible to attend. An interview schedule guided discussion with items based on a review of the literature and from evaluations of early chart versions22 ,24 ,29 ,33 ,34 (see box 1).
Trigger questions for semistructured focus groups
-
How did you find using the new charts? (What did/didn't you like about them?).
-
Are there any particular sections of the Observation and Response Chart (ORC) that you particularly liked or disliked? (Please explain answer).
-
Did you encounter any difficulties while using the ORC? If so, what were they? Can you suggest any ways to resolve this?
-
How do you find graphing using ranges rather than writing the actual number?
-
How do you find the ORC compared with the charts you usually use? (Easier/harder to fill in or read? If so, in what way? What makes them easier/harder to use?).
-
Does the chart make any difference to your ability to detect/pick up changes in a patient's condition? (If yes, what is it about the chart that makes the difference?).
-
Does the chart make any difference to your ability to make decisions about patient care? (If so, in what way?).
-
Do you think the chart influences your ability to communicate clinical deterioration to the patient's team? (If so, in what way?).
-
Is there anything else about these charts that you would like to tell me about?
Data management and analysis
Focus group discussions were audio-recorded and the audio files sent to the research team for deidentification and verbatim transcription. Two members of the research team experienced in qualitative analysis conducted thematic analyses independently, using inductive reasoning guided by Gibbs’ framework of: (1) transcription, familiarisation and immersion into data; (2) code building; (3) dis/confirmatory theme development and (4) data consolidation and interpretation.35
Audio files were listened to repeatedly until researchers were familiar with the material. Using NVivo V.9 software (QSR International, Doncaster, Victoria, Australia), a process of open coding was initially applied as topics, issues, experiences and perspectives were identified; these were iteratively organised, structured and merged as overarching themes emerged. These investigators then discussed and reviewed the organisation of themes until consensus was achieved, providing a systematic approach for interpretation.36 ,37 These interpretations were then confirmed with other research team members.
Ethical considerations
The Human Research and Ethics Committees at each site approved the study. Participants provided informed consent prior to data collection. Confidentiality of participant identity was assured with focus groups (FG) only identified by codes in reports and publications.38
Findings
Eight of the nine project sites submitted focus group data (one site was unable to submit data within the study timeline because of competing workloads). A total of 218 staff participated across 44 focus groups (median participants per group was 5; range 2–8). Most participants were nurses; doctors were invited, but many did not participate inter alia because of stated workload priorities (see the Discussion section for elaboration).
The deteriorating patient observation continuum provided a framework for analysis; recording vital signs, detecting deterioration and escalating care. A number of inter-related themes emerged from these three temporal processes, as well as specific contextual influences on staff experiences of the chart in clinical practice (see figure 2 for the range of issues and themes identified). Key emergent themes are described below, with direct quotes used to elaborate or illustrate emergent issues.

Temporal mapping of emergent themes from staff focus groups. ORC, Observation and Response Chart.
Recording vital signs
A number of related themes reflected changes for participants from previous practices when recording vital sign parameters, particularly using preset ranges on the chart rather than writing numerical values. Issues were also raised for recording specific specialist observations, as well as benefits and concerns with the modifications section of the chart.
Range versus precision
Established observation documentation practices were challenged by the chart format, requiring staff to graph observations within a range rather than writing a numerical value (see figure 1). This was the single most common issue raised by participants, with descriptors such as ‘precise’, ‘specific’ and ‘accurate’ used to highlight participant concerns in most focus groups. For many nurses trained to value accuracy in measurement, this practice change created discomfort; as highlighted by, ‘we've always been taught accuracy is better’ (FG I3).
This graphical documentation of observations in ranges created particular discordance with medical staff requirements for precise values. As a result, documented observations were sometimes regarded as ‘not accurate’, and to avoid this perception, nurses would frequently write actual figures, double-document, repeat vital sign measurements or ‘guess the numbers’ (FG B6) when communicating with doctors. This fundamental mismatch between the chart format and the need for specific values in clinical practice hindered initial acceptance by clinicians.
Specialist practice, generalist chart
The ORC was developed to document observations for the majority of adult acute care medical-surgical patients. Some clinical areas across sites, however, continued to need and use separate specialty observation charts, such as neurovascular observations or the Glasgow Coma Scale. Surgical wards also required output measures from drains, wounds and packs that were not included in the ORC (even though these could be documented on a separate fluid balance chart). This meant different observation charts remained in use, with repetition of information across charts causing uncertainty about what to document and where.
Aside from potential duplication and more work for nurses, this increased the risk of observations not being documented at all, ‘if a doctor wants to see … it's not always in the one spot.’ (FG A4); or not located correctly, ‘instead of writing … blood glucose on the back [page of the ORC], people were getting a blood glucose chart … Then you look at the charts and think when was the last time the sugar was done’ (FG I2). This caused considerable frustration for staff, with participants frequently requesting for all necessary observations to be combined on one chart.
Modifications to calling criteria
Many participants considered the modification section of the chart, allowing tailoring of parameters for individual patients so that otherwise abnormal limits were clinically acceptable and beneficial to practice. Chart guidelines stated that doctors were responsible for documenting modifications to individual patient vital signs. In practice, however, participants reported that doctors often omitted completion of the modification section, failed to review previously recorded modifications or delayed documenting changes. This lack of engagement by medical staff meant that potentially inappropriate RRT actions were still recommended according to the documented chart.
As recording on observation charts was not traditionally a medical role, this meant that implementation of these new charts required multidisciplinary ownership and a shift in role boundaries. Nurses, however, felt they had become the custodian of the charts by default, with responsibility to ensure its completion, despite considerable practice challenges; as noted, ‘getting the doctors to fill in the modification … a nightmare’ (FG I3).
Detecting deterioration
Experiences of the charts as a decision aid in the presence of clinical deterioration varied for participants, with the emerging common themes: recognising trends while graphing within ranges; perceived challenges to clinical expertise, and level of autonomy to make clinical decisions.
Recognising a trend
Participants acknowledged that the specific chart design features facilitated recognition of patient deterioration. A general understanding of the rationale and benefits was also noted, including graphing values and observing trends or patterns in changes of a patient's clinical condition; as stated: ‘a dot … [to] graph so we can actually look at it at a glance … it is easier to see a trend’ (FG A1).
Graphing values for detecting trends was therefore supported, as many participants indicated this was similar to their previous charts. The colour-coded track and trigger sections were mostly regarded as positively supporting recognition of deterioration (especially for new staff) or making no difference (for experienced staff). Colours were seen as easy to differentiate, even with different lighting levels (ie, at night). Some, however, found the charts unnecessarily busy and this hampered their perception of pattern recognition.
As noted earlier, however, vital sign ranges with predetermined parameters and colour-coded sections for triggering a response were often perceived as too broad. This issue was noted where ‘dramatic changes in observations that still fall within the normal parameters’ (FG B5) did not trigger an alert. Importantly, staff identified this issue as a deterrent to early detection of deterioration, as a patient with baseline observations within the upper normal range (coloured white) would not register in the (yellow) alert range until they had already experienced a clinically significant fall, for example, 9 mm Hg blood pressure. Participants, therefore, wanted to see changes in trends both within and between ranges, especially for blood pressure, temperature and oxygen saturation; for example, ‘they're on oxygen for a reason and we wouldn't know when to take them off’ (FG H8).
Other important practice issues became evident when accurate measurements of vital signs were required to initiate important interventions; for example, the temperature at which blood cultures were taken and intravenous antibiotics commenced. Measurements of vital signs were also used as markers of response to treatment, such as antihypertensive and analgesic drugs. For example, ‘if somebody was in severe pain and their blood pressure went up but then you gave them some analgesia and then it came back down’ (FG H2).
Clinical credibility
A spectrum of views was therefore expressed on the use of the charts as a visual aid to detect deterioration. Less experienced nursing staff liked the ORC chart design and found them easy to use: ‘… from a glance you can see if it’s in a different colour, that there's something that you should be taking a closer look at’ (FG G3). While more experienced participants conceded the charts were helpful for less experienced staff, some considered them deskilling, creating a dependency and replacing clinical judgement; for example, ‘we should be educating junior staff to look for more than just teaching them to use colours’ (FG A6). Some participants were also defensive of their ability to recognise deterioration without needing a colour-coded track and trigger chart: ‘I’d like to think that it hasn't made any difference to me being able to detect my patient deteriorating’ (FG I1) and ‘I went to nursing school for three years—I know when it's time to ring the doctor’ (FG A4).
Professional autonomy
Recommended actions in response to a patient's deteriorating vital signs that met specific criteria on the charts were not always in line with nurses’ clinical judgements. In particular, senior staff resented that they were not allowed either to amend calling criteria themselves or go straight to a medical review when the chart criteria recommended a senior nurse review, but they perceived greater urgency; for example, ‘… if this patient is actually sick, you've wasted time waiting for the nurse in charge to review that patient, then in turn, they’ve got to go and get an intern to come and view that patient anyway’ (FG H7).
Shift team leaders were split over their responsibility for these clinical reviews. Some participants appreciated having greater confidence that junior staff would come to them if their patient's vital signs deteriorated; ‘they look at the colours as well as the numbers, most likely they'll tell somebody’ (FG F2). However, this also represented high demand on their time: ‘whoever is in charge is going to be so busy … checking their patients’ (FG H3).
Of note, some participants developed ‘work-around’ strategies for the recommended chart actions (despite this reflecting local escalation protocols). On occasions non-compliance was described, where abnormal vital signs were measured but considered acceptable for the individual patient; for example, staff ‘fudge it because it's easier to fudge it than do all that rigmarole’ (FG A3). This implied that it was acceptable to falsify an abnormal vital sign, rather than record observations accurately and follow recommendations or justify omissions. To retain a level of control over care of their patient, one participant explained, ‘If I’ve got...a score that tells me to do something, and I don't think I need to, I’m either going to be confident in my skills and write I’ve chosen to do nothing or I’m going to write my [made-up values] results in the white [graphing area]’ (FG A3).
Escalating care
Communicating actions recommended by the chart to escalate patient care was also sometimes challenging for participants, especially when attempting to obtain a response from medical officers. Importantly, medical staff attitudes impacted on acceptance of the charts in clinical practice.
Influences of doctors
For some participants, implementation of the chart was seen positively as pushing the organisation to challenge traditional professional boundaries and reporting practices, where ward/junior doctors were usually the first contact and initial decision makers when patient deterioration was identified. While decisions to review were protocol-driven, use of ranges rather than exact numbers did obstruct communication, particularly when nurses attempted to obtain a clinical review: ‘trying to tell them what the blood pressure is, and you can’t give them accurate information, and that’s what they’re wanting’ (FG I1).
On most occasions, doctors insisted exact values be provided, so the nurse was required to repeat the patient's vital sign measurements, which caused frustration and increased workload. As a result, ‘a lot of people [are] still writing the numbers (FG D2)’ even though participants understood that ‘it defeats the purpose of what the chart is there for in the first place’ (FG I1).
Protocols: permission and autonomy
The incorporation of local site escalation protocols into the charts was perceived as empowering for less experienced nurses, enabling permission to call for clinical assistance; for example, it ‘certainly gives you a bit more bravery to pick up the phone’ (FG G6). Of note, where deterioration was identified, use of the chart reduced the ‘wait and see’ culture reported by some participants: ‘In the past we might have sat on certain things to see how it goes, whereas this [chart] says, right do something about it’ (FG A4).
Interestingly, given the chart reflected existing local escalation policies, participants still demonstrated varied understanding of applying the chart escalation recommendations in clinical practice. Some thought the requirement to act or not was unclear; others felt that response to chart recommendations was compulsory, even when they were confident in making a different judgement based on their clinical expertise and knowledge. Some experienced participants, therefore, viewed the charts as curtailing autonomy in decision making, predominantly for nurses but also for doctors.
Increased activity/uncertain benefit
These preceding key themes (as well as other issues noted in figure 2 but not reported here for issues of brevity) reflected an overall sense that using the ORCs in practice resulted in increased activity but with uncertain benefits. Although the charts were considered as empowering nurses to escalate care, there was concern of premature or unnecessary intervention because ‘in reassessing, observations might improve … instead of just relying on a chart and going hey, it's up to the doctor to come and diagnose this’ (FG D5). One participant noted issues of increased workload with potential false alarms and alarm fatigue, suggesting that if every patient received every review as required by the chart ‘the nurse in charge would be constantly reviewing twenty-eight patients and that’s all they would do all shift, because at some time, each patient would fall into the orange section for some reason’ (FG H2).
Participants also felt strongly that any new observation chart should streamline documentation requirements, and the number of charts in use, rather than add to their current workload with multiple charts. This related, in particular, to frequently recorded patient information, such as bowel function, daily weights, pain score and analgesia, which were located on a separate page from the main graphing page of the ORC or were recorded on additional charts. Importantly, while the chart was considered by some to be ‘needlessly complicated’ (FG D7) and caused an unnecessary increase in workload, the majority agreed that ORC completion was generally ‘self-explanatory’ (FG E1).
Discussion
Key findings in relation to previous literature
These findings from a large sample of focus group participants across a range of health services and jurisdictions in Australia add to our developing knowledge of staff attitudes and behaviours related to practices in the afferent limb of the rapid response system (RRS).30 ,39 Although routine observations of vital signs are ritualistic and task-oriented practices, often perceived as low priority and requiring low levels of skill,40 evidence and understanding of these processes remain sparse.39
In this multisite, multijurisdictional exploration of clinician views shortly after implementation of the TTS-based observation charts, key themes included: tension between vital sign ranges and precision to support decision making; using a standardised generalist chart in specialist practice; challenges with clinical credibility, professional autonomy and influences of doctors when communicating abnormal signs; and permission and autonomy when escalating care according to site protocols. A range of positive, negative and mixed views was identified, with issues of user compliance, documentation practices, interprofessional collaboration and clinical decision making also uncovered.
Benefits, particularly for less experienced staff, were identified despite charts not always being used to their optimal design function, challenging developer intentions24 and potentially reducing the likelihood of recognising deterioration. While simulated experiments found easier detection of deterioration with vital signs graphed in ranges,24 participants reported tensions in practice between chart objectives and clinical practices, revealing mismatches between design characteristics and human staff experiences with embedded cultural practices, beliefs and attitudes.19
Intended as a decision-making tool to facilitate detection of deterioration and appropriate timely responses, charts were considered primarily a benefit for junior, agency or new staff,41 while more experienced nurses perceived that required responses undermined their individual clinical judgement that involved intuition and pattern recognition.40 Specific vital signs values were expected during interprofessional communications, particularly within the context of clinical deterioration. Reporting vital signs in ranges, therefore, led to perceptions of imprecision among doctors, resulting in some not responding to an escalation request.40 ,42 Conversely, writing values adds to ‘visual clutter’ of a chart, with the potential to increase cognitive load and the risk of failing to recognise clinical deterioration.29
Removing precision from vital signs measurements also challenged participants’ professional perceptions and interprofessional relationships. Nurses’ work was perceived as devalued in the eyes of their medical colleagues.40 Doctors were also sometimes unaware of or resistant to their responsibilities for establishing escalation criteria and recording modifications on the chart, which caused challenges in practice. One contributing reason may be due to observation chart completion being traditionally viewed as a nursing role.40
Participants also viewed doctors as resenting abrogation of their individual decision making,42 even though the chart reflected local escalation protocols. Of note, this study did not introduce a new RRS to participating sites, with all calling criteria used in the charts reflected existing local protocols. To have these documentation, communication43 and collaboration issues occurring in the context of increasingly abnormal vital signs is a serious practice and patient safety concern.41 ,44 Delayed MET activation has been consistently identified19 ,20 ,45–47 and debated,44 with these continuing cultural barriers19 ,44 ,47 reflected in participants’ views here.
Based on these focus-group findings, it appears that an apparently simple chart replacement challenged fundamental role demarcations, power balances and professional autonomy for participants.48 Interprofessional tensions and role conflict occur where blurred boundaries in autonomy and clinical decision making exist,49–51 particularly within a complex sociotechnical environment.19 ,40
These findings, therefore, highlighted factors influencing implementation of practice changes in acute clinical settings.52–54 While practice cultures are strongly influenced by shared values and beliefs of professional groups such as nurses, doctors and policy makers, there are, nonetheless, differing levels of ownership and influence on the acceptance of clinical initiatives.51 ,55 ,56 Findings also demonstrated the importance of mutual understanding of others’ professional roles, so as to enable effective interdisciplinary teamwork and communication,57 and the time it may take to embed these changes into practice.19 ,58–60 Facilitating an interprofessional collaborative approach for adopting new policies or procedures requires proactive engagement of all disciplines at the outset of the practice change.40 ,61
Methodological strengths and limitations
Wide implementation of the charts across a number of sites and considerable participation from staff in focus groups are study strengths. With the range of hospital types and settings, the common themes identified here may have resonance more widely across acute health organisations considering implementation of a TTS-based observation chart.
Despite a structured implementation strategy including use of site executives as project champions, secondment of a local site-based project officer and timing chart implementation to coincide with the commencement of a new clinical year and term for resident medical officers, there were difficulties engaging medical staff, given existing medical education programmes and workload. Even with an extensive education programme at all sites, health professionals’ limited understanding of chart design characteristics also hindered acceptance in practice.
While this study was conducted in a short timeframe, implementation of new initiatives to change and improve practice behaviours may take many years to embed into an organisation's culture.19 ,51 ,62 Similar to other recent smaller, single-site qualitative studies of the rapid response system afferent limb,20 ,63 focus group participants were mainly nurses, and findings may, therefore, not encapsulate views of all intended user groups. Site project officers conducted the focus groups, which had the potential to influence participant responses.
Implications for practice
While charts were designed to specifically improve detection of deterioration and minimise risk of error when recording vital signs, they also serve other purposes in clinical practice; for example, monitoring response to treatment, or informing and tailoring treatment plans. Instances were highlighted where the charts provided less usage, particularly when precise values were essential.
Implementation issues are also highlighted, especially with some experienced nurses and medical staff resisting engagement with this type of practice change. Interdisciplinary conflicts, where role boundaries and responsibilities between medical and nursing staff continue to exist,64 create barriers to adoption of practice changes aimed at improving patient safety.19 ,57 How different disciplinary cultures respond to documentation such as these charts is important to consider. As noted earlier, implementing this type of complex sociocultural intervention may take considerable time to be culturally accepted. Implementing interprofessional training on key design and process characteristics (attempted here, but not successful) would be a progressive step towards improving collaborative practice changes.65 ,66 ,40
The ACSQHC does not recommend local changes to their chart design; specific guidelines are, however, available if alterations are necessary to accommodate local protocols and practices.31 Maintaining integrity of these design characteristics is important to augment recognition of clinical deterioration. Stakeholders and clinicians should note that chart alterations made contrary to these guidelines may increase the risk of errors when recording vital signs, or delaying recognition of clinical deterioration.
Recommendations for further research
Organisational cultures have significant influence on the success of rapid response systems.19 ,57 ,67 Follow-up evaluations are required to confirm whether these initial views of users continue or change with further use of the charts. Additional research is also essential to develop deeper understandings of how day-to-day clinical environments influence practice cultures39 so as to enable a more integrated patient safety approach that engages and facilitates interprofessional collaboration.
Conclusion
There are two key messages from this study. First, users reported mixed views on the benefits of these new track and trigger-based observation charts in practice. Importantly, less experienced nursing staff believed that the chart facilitated their decision-making processes during events of patient deterioration. In these circumstances, the chart achieved its intended purpose. With continued use in practice, use and acceptance of the charts with accompanying changes to established practices may result in improved identification and responses to clinical deterioration in these organisations.
Second, these qualitative findings also confirm that significant barriers continue to exist with practice and communication processes around the interface between the afferent and efferent limbs of rapid response systems across a range of different organisations. The significant influence of organisational work-based cultures, disciplinary boundaries and interdisciplinary communication during chart adoption was uncovered, with mismatches between design characteristics and human staff experiences revealed. Optimal use of all chart design characteristics will be possible when these broader cultural issues are addressed. These findings may, therefore, inform future implementation strategies, enabling optimal use of track and trigger observation chart designs and other rapid response system initiatives within these complex sociotechnical environments.
Acknowledgments
We thank the hospital executives of the participating sites for supporting the study, and also acknowledge the important work of our site-based project officers: Ballarat Health Services, Victoria (Ms Angie Spencer, Mr Jason Wiseman); Calvary Wakefield and Calvary North Hospitals, South Australia (Ms Jane Cleveland, Ms Shelley Roberts); Eastern Health, Victoria (Dr David Charlesworth, Ms Sam Brean); Lyell McEwin Hospital, South Australia (Ms Cindy Halliwell, Ms Tovah Green); North Shore Private Hospital, New South Wales (Ms Sue Engle, Ms Dena-Louise Hogben; Ms Sarah Lichenstein); Northern Area Health Service, Tasmania (Ms Sophie Legge); Southern Health, Victoria (Ms Monica Finnigan, Ms Kate Flynn); St Vincent's Hospital, Melbourne, Victoria (Mr Vince Gaglioti, Ms Caroline Scott); St Vincent's Hospital, Toowoomba, Queensland (Mr Jeff Potter, Ms Sam Ward).
References
Footnotes
-
Contributors DE led development of the overall study in response to the request for tender. SMcK, LP, CD, RI, RG, MF, MR, EA contributed to development of the study methods. DE directed and EA managed implementation of the study. EA provided data management. LP and MF led analysis and interpretation of the findings reported here. All other authors contributed to this interpretation. DE and EA wrote the manuscript, with contributions from LP, MF, CD, RG, RI, SMcK, MR. All authors approved the final submission.
-
Funding Australian Commission on Safety and Quality in Health Care RFT 424/910.
-
Competing interests None.
-
Ethics approval Eastern Health Area Health Service HREC, Adelaide Calvary HREC, Lyell McEwin HREC, Tasmania Northern Area Health Service HREC, North Shore Private HREC, Monash Medical Centre HREC, St Vincents Private Melbourne HREC, St Vincents Public Toowoomba HREC, Ballarat Health Services HREC.
-
Provenance and peer review Not commissioned; internally peer reviewed.
-
Data sharing statement Unpublished data from the overall project is accessible to the Australian Commission on Safety and Quality in Health Care and participating sites have access to data collected at the sites through the first and second author, or UTS Health Faculty.