Article Text

Statistics from Altmetric.com
- Healthcare quality improvement
- Health services research
- Quality improvement
- Statistical process control
Introduction
Time series plots are widely used, across sectors and media, probably because many find them easy to understand. Figure 1 is a time series plot of how the readmission rate in a hospital changed over time (constructed data set).

Example of fictive time series data displaying the percentage of discharged patients readmitted to the hospital within 30 days for each month. The time series stretches over 31 months. After month 17, a quality improvement programme was introduced to reduce the proportion of patients readmitted to the hospital.
Statistical process control (SPC) and interrupted time series (ITS) designs are two closely related methodologies in the field of quality improvement. In both approaches, data are organised in time series and presented using time series plots. Both SPC and ITS use data to assess whether observed changes reflect random variation or ‘real’ change.
SPC is a popular method in quality improvement in the health sector worldwide, with scores of time series data collected. These data represent a golden but largely lost opportunity for learning and improving quality of care. First, because findings from SPC projects are rarely published: Thor and colleagues searched comprehensively for reports on the use of SPC in healthcare quality improvement and identified only 57 articles published between 1990 and 2004.1 Second—we will argue—because the potential for rigorous impact evaluation based on SPC data is not fully exploited.
Statistical process control
Simplified, SPC is a tool for monitoring processes by means of time series plots. Two key concepts in SPC are ‘common cause variation’ and ‘special cause variation’. Common cause variation implies that the observed variation reflects random fluctuations. When this is the case, the process is ‘in control’. On the other hand, a process is not in control when there is more variation than can be expected by chance alone, that is, the variation is due to external events (‘special causes’).
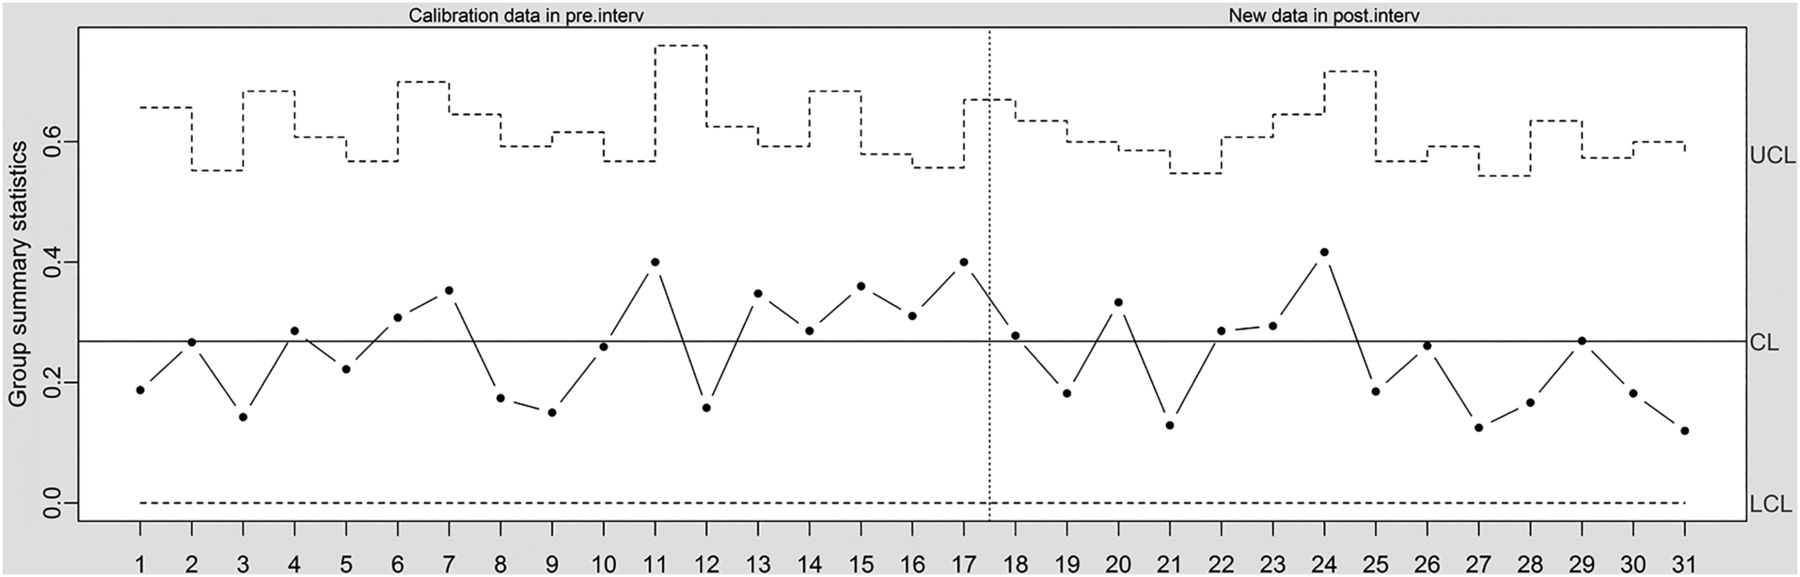
The central component of the SPC approach is the ‘control chart’—a simple time series plot with the addition of three lines representing the expected mean value, an ‘upper limit’ and a ‘lower limit’. The upper and lower limits are used to identify special cause variation and are typically set at 3 SDs from the mean.2 Figure 2 shows a control chart (‘u-chart’) based on the data shown in figure 1. From month 18, a quality improvement programme was implemented, aiming at reducing readmission rates. The central line is based on data before the quality improvement programme was implemented (months 1–17). The control limits are based on the central line for the pre-intervention data and the number of discharges for each month. From reading the control chart, the intervention did not lead to any detectable change (no special cause variation).

Times series data in control chart (u-chart, which allows for varying control limits to account for varying number of observations at each time point). CL, centre line; LCL, lower control limit; UCL, upper control limit.
There are two major advantages of the SPC approach: (1) managers and clinical staff with little or no statistical knowledge can easily understand and interpret the control charts; and (2) the charts provide updated information that supports prompt decision-making. Establishing the upper and lower control limits requires statistical insights (or appropriate software),2 but once those are set, the use of control charts is quite straightforward.
When using SPC for monitoring, the time series plot provides a graphical report on how the process develops. The control limits are helpful for interpreting whether an observed change reflects a real (‘special cause’) change or just ‘common cause variation’. SPC data can also be used to assess whether an event, such as a quality improvement programme, was associated with a change in performance. Consider, for example, a hospital manager who introduces SPC to monitor the door-to-needle time for patients with myocardial infarction. The manager shares the control chart with the staff, and they put in place measures to improve quality. A subsequent control chart shows that the door-to-needle time has indeed gone down.
Even though SPC is clearly useful for monitoring, it can be challenging to assess the impact of interventions based on SPC plots, for at least two reasons.
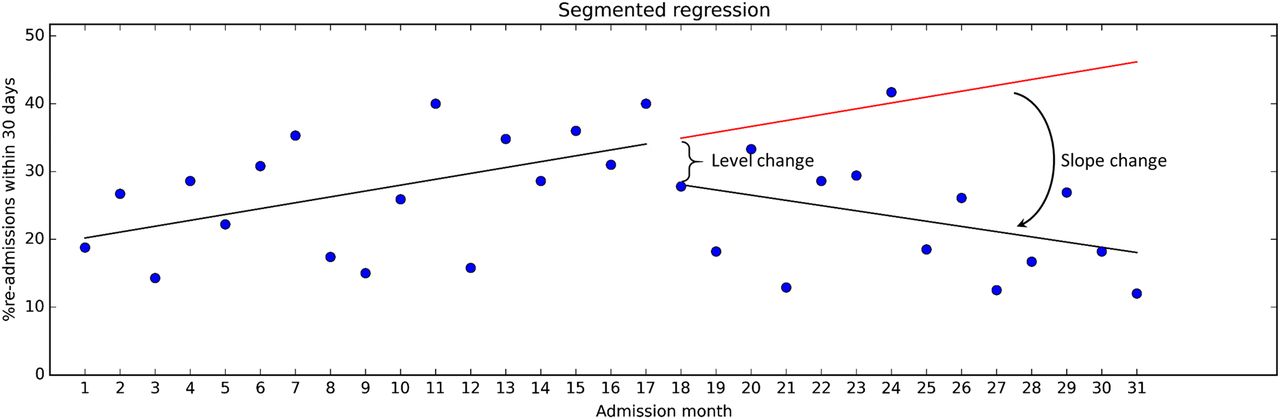
First, a requirement for evaluating changes by means of SPC methods is a stable baseline. But, as pointed out in the Standards for Quality Improvement Reporting Excellence guidelines, “healthcare systems are also subject to secular trends that may appear in any given period of pre-intervention and during the intervention period”.3 Consider figure 3, where we have included regression lines for the pre-intervention and post-intervention data from figure 2. During the pre-intervention period, readmission rates steadily increased, but the trend shifted after the intervention. This was not easy to see by inspecting the SPC u-chart in figure 2. A common analytical approach in studies based on SPC data is to compare the pre-intervention mean with the post-intervention mean, for example, using a t test. This approach ignores secular trends and may yield misleading results. Some authors use the term ‘interrupted time series’ simply to indicate that time series data were collected, before and after an intervention. In our view, the term also implies taking the time variable into account in the analysis.4 ,5

Time series data with regression lines for the pre-intervention and post-intervention periods.
Second, time series measurements may not to be independent of each other, for example, high values tend to follow high values and vice versa (autocorrelation).6 If not adjusted for in the analysis, this can lead to exaggerated precision around effect estimates, that is, too narrow CIs.
Interrupted time series
ITS analysis entails using statistical methods to quantify changes in level and trend from before to after an intervention, and to assess whether the estimated differences are statistically significant. The intervention ‘interrupts’ the time series, hence the name.
Regression modelling where separate coefficients are estimated for the data segment preceding and succeeding an intervention—‘segmented regression’—is a commonly used ITS method.
The basic assumption in ITS is that observations from the baseline period predict where the future data points would lie in the absence of an intervention. If the intervention is associated with observations that deviate from the predicted observations, the difference represents the effect of the intervention.
The effect size is expressed in terms of level change (ie, a shift observed in direct association with the intervention) and slope change (ie, a change in trend). See figure 4 for illustration. Our calculations showed that the level change was about −5.2 percentage points, which was not statistically significant (p=0.39; 95% CI −17.39 to 6.92). However, the level change does not provide all information found in the data. The slope during the pre-intervention period was 0.87, corresponding to a monthly increase in readmissions of 0.87 percentage points (p=0.040; 95% CI 0.04 to 1.69). Following the intervention, the trend reversed to −0.77 (p=0.026; 95% CI −3.01 to −0.26). This can reasonably be seen to indicate that the intervention has had some impact on the readmission rates.
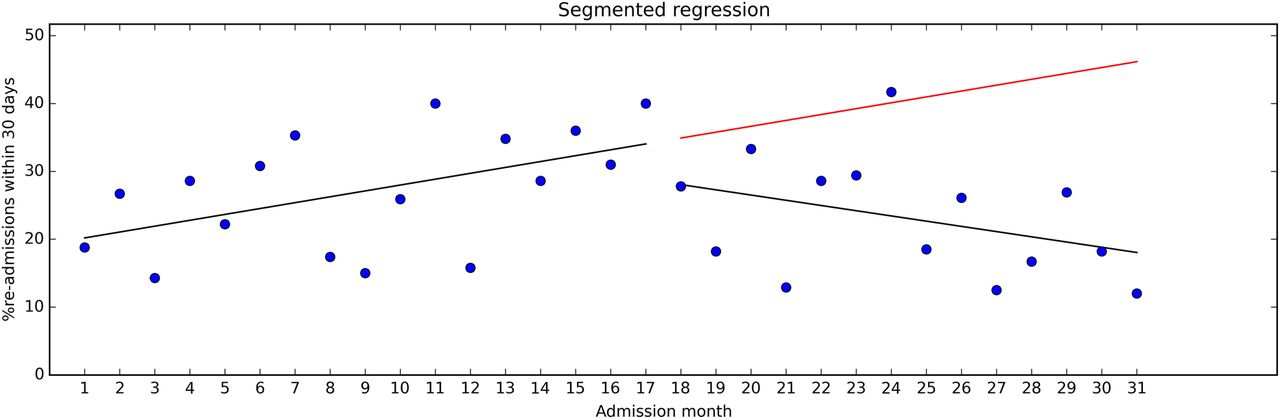
Time series data with pre-intervention regression line extended into the post-intervention period.
Hypothetically, if more post-intervention data were available and readmission rates continued to decrease at the same pace, a difference between the average pre-intervention and post-intervention rates would eventually become visible (and statistically significant by means of a t test). If so, the added value of ITS in this case would be that the decreasing readmission percentage is detected earlier than by SPC alone.
ITS analysis includes testing for autocorrelation and allows for necessary adjustments if autocorrelation is present.5 In our case, we detected little or no autocorrelation (Durbin Watson statistic=2.5).
By including secular trends and autocorrelation in the analysis, ITS offers the key features that SPC lacks for producing sound effect estimates for quality improvement programmes and other ‘external causes’.
While the ITS approach is conceptually simple, its application is not always straightforward. Often, statistical expertise is needed to set up a segmented regression analysis model (or other ITS model) and for the data analysis. Ramsey and colleagues have shown that ITS data are often inappropriately analysed.7
While widely considered a robust method for effectiveness evaluation, findings from ITS analyses can be misleading. The assumption that the baseline trend would have continued into the future in the absence of the intervention can be violated in various ways.8
First, external causes other than the specific intervention in question may have influenced the outcome. In quality improvement work, many initiatives—small or large—often happen simultaneously, and it can be hard to discern one from the other. Thus, a careful assessment of the full range of possible causes of change is important.8
Second, the data collection method might have changed. Perhaps the observed ‘effect’ is simply due to changes in coding practices.8
Third, the risk of selection must be considered, that is, that the type of patients or health professionals providing data for the study changed. For example, the intervention may have led to increased attrition due to more intensive follow-up, meaning that patients who would have provided data in the pre-intervention period dropped out from the post-intervention period. This reduces the comparability of the pre-intervention and post-intervention populations.8
A golden, but so far lost opportunity
The evidence base for many quality improvement interventions is weak, both because of lack of data and because few interventions have consistently proven to be effective.9 Even though randomised trials are preferable, the ITS design is a sound methodological approach for impact assessment, when applicable.4 ,5 ,9 Most of the data used for SPC should also be suitable for ITS analysis. Thus, more and better use of data from SPC projects by means of ITS analysis could strengthen the evidence for, and against, various quality improvement approaches.
Surely, many quality improvement projects have little or no value beyond their local context. Still, if a hospital deals with a common problem—for example, hospital-acquired infections or waiting times—and manages to reduce the problem substantially through some innovative smart way, it would be well worth sharing that newfound knowledge with the wider community. It would be equally important to learn about quality improvement initiatives that fail.
Users of SPC and users of ITS seem to belong to separate communities, with seemingly limited collaboration and few communication lines. As an indication: a simple search on PubMed combining the phrases “statistical process control” and “interrupted time series” yielded only four hits (9 March 2015).
One likely reason for disconnect between the two communities is that users of SPC and users of ITS have somewhat different objectives. SPC is used mostly to inform timely decision-making locally, while ITS tends to be used for research, that is, to generate evidence for future decisions. Still, there is much overlap between the two: SPC can be used to generate evidence that is useful beyond the local context, and findings from ITS analyses can directly inform decisions.
More and better use of SPC data
If publishing of findings from a SPC project is desirable—as it often should be—the quality of the study must withstand critical scientific scrutiny. In essence, this entails ensuring that the findings are valid, which again requires the use of sufficiently rigorous methods. The perhaps most important factor is the research design. As outlined above, ITS methods are widely seen as a rigorous quasi-experimental approach,4 but possible sources of bias need careful attention.8 Conflicts of interest is also an issue. Groups and individuals involved in quality improvement are likely to have a strong interest in documenting that quality is actually improving. This might influence choice of outcomes measures, data collection, how data are analysed, the interpretation of them and the selection outcomes to report on—analogous to the interest pharmaceutical companies have in getting positive results from their drug trials.10
To address potential conflicts of interest, it is advisable to prepare a detailed protocol in advance, describing the planned interventions, data sources and analyses. Many quality improvement methods entail ‘rapid cycle’ assessments with continuous adjustments and multifaceted strategies, so describing the exact content of the interventions in advance might not be possible. However, it should be feasible to describe the outcome data and the analytical approach upfront in relative detail. To the extent possible, those who assess the outcomes should not know whether the data are from the pre-intervention or post-intervention period, unless the outcome measures are objective (eg, mortality or length of stay).
An external evaluator can provide a healthy distance to both stakeholders and data, and may be a wise approach, if budgets allow.
The use of sound scientific methods is necessary to establish a cause–effect relationship between an intervention and an observed change, but how important is it to establish this relationship? Those responsible for quality improvement might argue that achieving positive change is the most important outcome—understanding the exact causes of improvement less so. From a learning and research perspective, though, it is crucial to identify the likely causes, and estimate the size, of the observed effect.
Conclusion
A key question in quality improvement is ‘What works?’ More and better use of data from SPC-projects can strengthen the evidence base and lead to more effective quality improvement strategies. Applying ITS analysis should be a matter of routine when SPC data are used for impact assessment.
Acknowledgments
We thank Geir Nordheim and Dag Hofoss for providing useful comments on earlier versions of the manuscript.
Footnotes
Contributors AF wrote the first draft. OT commented on the draft and performed the statistical analyses.
Competing interests None declared.
Provenance and peer review Not commissioned; externally peer reviewed.