Article Text

Abstract
Background Drug name confusion is a common type of medication error and a persistent threat to patient safety. In the USA, roughly one per thousand prescriptions results in the wrong drug being filled, and most of these errors involve drug names that look or sound alike. Prior to approval, drug names undergo a variety of tests to assess their potential for confusability, but none of these preapproval tests has been shown to predict real-world error rates.
Objectives We conducted a study to assess the association between error rates in laboratory-based tests of drug name memory and perception and real-world drug name confusion error rates.
Methods Eighty participants, comprising doctors, nurses, pharmacists, technicians and lay people, completed a battery of laboratory tests assessing visual perception, auditory perception and short-term memory of look-alike and sound-alike drug name pairs (eg, hydroxyzine/hydralazine).
Results Laboratory test error rates (and other metrics) significantly predicted real-world error rates obtained from a large, outpatient pharmacy chain, with the best-fitting model accounting for 37% of the variance in real-world error rates. Cross-validation analyses confirmed these results, showing that the laboratory tests also predicted errors from a second pharmacy chain, with 45% of the variance being explained by the laboratory test data.
Conclusions Across two distinct pharmacy chains, there is a strong and significant association between drug name confusion error rates observed in the real world and those observed in laboratory-based tests of memory and perception. Regulators and drug companies seeking a validated preapproval method for identifying confusing drug names ought to consider using these simple tests. By using a standard battery of memory and perception tests, it should be possible to reduce the number of confusing look-alike and sound-alike drug name pairs that reach the market, which will help protect patients from potentially harmful medication errors.
- Patient safety
- Medication safety
- Human factors
- Human error
This is an Open Access article distributed in accordance with the Creative Commons Attribution Non Commercial (CC BY-NC 4.0) license, which permits others to distribute, remix, adapt, build upon this work non-commercially, and license their derivative works on different terms, provided the original work is properly cited and the use is non-commercial. See: http://creativecommons.org/licenses/by-nc/4.0/
Statistics from Altmetric.com
Introduction
Drug names often look and sound alike (eg, diazepam and diltiazem, hydroxyzine and hydralazine, Paxil and Taxol, fomepizole and omeprazole, Foradil and Toradol).1–4 As a result, pharmacists, doctors, technicians, nurses and lay people may mistake one drug for another.5–7 These errors can occur at any stage of the drug use process: prescribing or ordering, transcription, dispensing, administration or monitoring. Some of these errors present low risk of harm because the two drugs have similar indications, effects and doses (eg, alprazolam and lorazepam, duloxetine and fluoxetine). Often times, however, the consequences are severely harmful and even fatal, as when the wart remover Durasal was confused with the eye drop Durezol,8 when chemotherapy drugs such as cisplatin and carboplatin or vincristine and vinblastine have been confused,9 or when opioids such as morphine and hydromorphone are confused.4 ,10
Errors of this type persist despite significant, long-term efforts to eliminate them. Regulators, drug companies and medication safety experts have tried to address this problem both before new names are approved and after names are on the market. Preapproval strategies involve subjecting new names to a variety of tests to assess how often they are misperceived or misremembered and, if so, which existing names they might be confused with and what harm they might cause.11–13 Computerised searches, using the new name as a query, can identify existing names that are highly similar to the query name in spelling or pronunciation.14–16 Expert judgements of confusability are sometimes solicited from practicing health professionals and patients, and these same types of respondents sometimes complete simulated prescribing, transcribing, dispensing and product selection tasks to assess confusability. Methods such as failure mode and effects analysis (FMEA) are then used to synthesise test results, leading to an overall assessment as to a new drug name's acceptability.17 After a name has reached the market, a variety of other methods are used in an attempt to minimise the risk of confusion. These include bar coding,18 shelving similar products on different shelves, use of mixed case lettering,3 ,19 ,20 special labelling and packaging,21 and computerised alerts.22 ,23 Among all of these techniques, only bar coding is supported by strong evidence of effectiveness, reducing dispensing errors by >90% and adverse drug events by more than 60%,18 ,24 but bar coding has no effect on the other stages of the drug use process that lead to errors.
In spite of the efforts of drug companies and regulators, confusing names continue to enter the marketplace. At the time of this writing, the US Food and Drug Administration (FDA) has just warned of confusion between Brilinta (ticagrelor) and Brintellix (vortioxetine).25 The persistent problem of confusing names entering the market is likely due to the ineffectiveness and inconsistent use of preapproval strategies for identifying potentially confusing names. None of the preapproval strategies described above is supported by strong evidence of effectiveness. There is some evidence that psycholinguistic properties of drug names, such as similarity and familiarity, can predict error rates in laboratory studies of memory and perception for drug names.5–7 In a draft guidance,26 Health Canada recommended that drug companies use a standard battery of memory and perception tests to assess the confusability of new drug names, but this proposal was dropped in the final guidance after stakeholders argued that the methods were burdensome and had not been shown to predict real-world error rates.13 To address this concern, we carried out a study to measure the association between error rates observed in laboratory-based memory and perception tests and drug name confusion error rates observed in real-world outpatient pharmacies. We had doctors, nurses, pharmacists, pharmacy technicians and lay people complete tests that assessed the ability to accurately see, hear or remember drug name pairs. We then examined the extent to which error rates and other data from the laboratory memory and perception tests (along with attributes of the drug names, such as their familiarity and similarity) were associated with real-world error rates from a large, outpatient pharmacy chain. Our hypothesis was that there would be a significant association between the laboratory test error rates and the real-world error rates.
Methods
Design
We designed a study to quantify the association between real-world drug name confusion error rates and error rates observed when participants attempted to see, hear and remember potentially confusing drug names in the laboratory.
Participants
Eighty participants (16 each of doctors, nurses, pharmacists, pharmacy technicians and lay people) completed the memory and perception tests. Three additional participants were tested during the pilot phase of the study but were not included in the final sample. The mean age of participants was 29.1 years (SD=9.2; range=19–62), and the gender breakdown was 61 females (76.3%) and 19 (23.7%) males. The age, gender, race and work context by participant type (doctors, nurses, pharmacists, pharmacy technicians and lay people) are provided in table 1. Participants indicated that they had no uncorrected speech, language, hearing or thinking impairments and were comfortable speaking and reading English (the language of testing). One participant had a hearing impairment corrected with a hearing aid. Participants were recruited through flyers, emails and word-of-mouth from a university community and were paid for their participation. Participants provided verbal informed consent to participate after reading an information sheet describing the study's procedure, purpose, risks and benefits. Record of the consent was documented by completion of a demographic questionnaire, which participants filled out after giving verbal consent. This procedure (and the rest of the protocol) was approved by a university ethics boards.
Demographic characteristics of participants
Procedure
After giving consent, participants completed a demographic questionnaire. Next, each participant completed two of the four laboratory memory and perception tests (described below in Materials). Participants were assigned to two tests randomly but with constraints on the randomisation process so that each test was assigned to 40 participants (8 doctors, 8 nurses, 8 pharmacists, 8 pharmacy technicians and 8 lay people). Participants were assigned to only two of the four tests because the tests were mentally taxing, and the participants may have experienced discomfort if asked to complete all four tests. One participant completed only one test because of an equipment error on the second test (the short-term memory test). After completing the two tests, participants filled out a questionnaire in which they rated their familiarity of each drug name on a 1 (not at all familiar) to 5 (extremely familiar) scale (see table 1 for median familiarity ratings for each participant type). Participants then received a gift card as compensation for their time. The full protocol usually took 60–90 min.
Materials
Laboratory memory and perception tests
Four tests were included in the laboratory test battery: backward masking (a test of visual perception), progressive demasking (a test of visual perception), speech-in-noise (a test of auditory perception) and short-term memory (a test of short-term recall and recognition memory). These four tests are well-established tests in the psychological literature and have previously been used in drug name experiments.5 ,7 ,27 A visual depiction of the tests is provided in figure 1. In all tests, to make the stimuli consistent and to minimise extraneous factors, all drug names were displayed with the first letter in upper case and the rest of the letters in lower case; thus, tall-man lettering was not used.
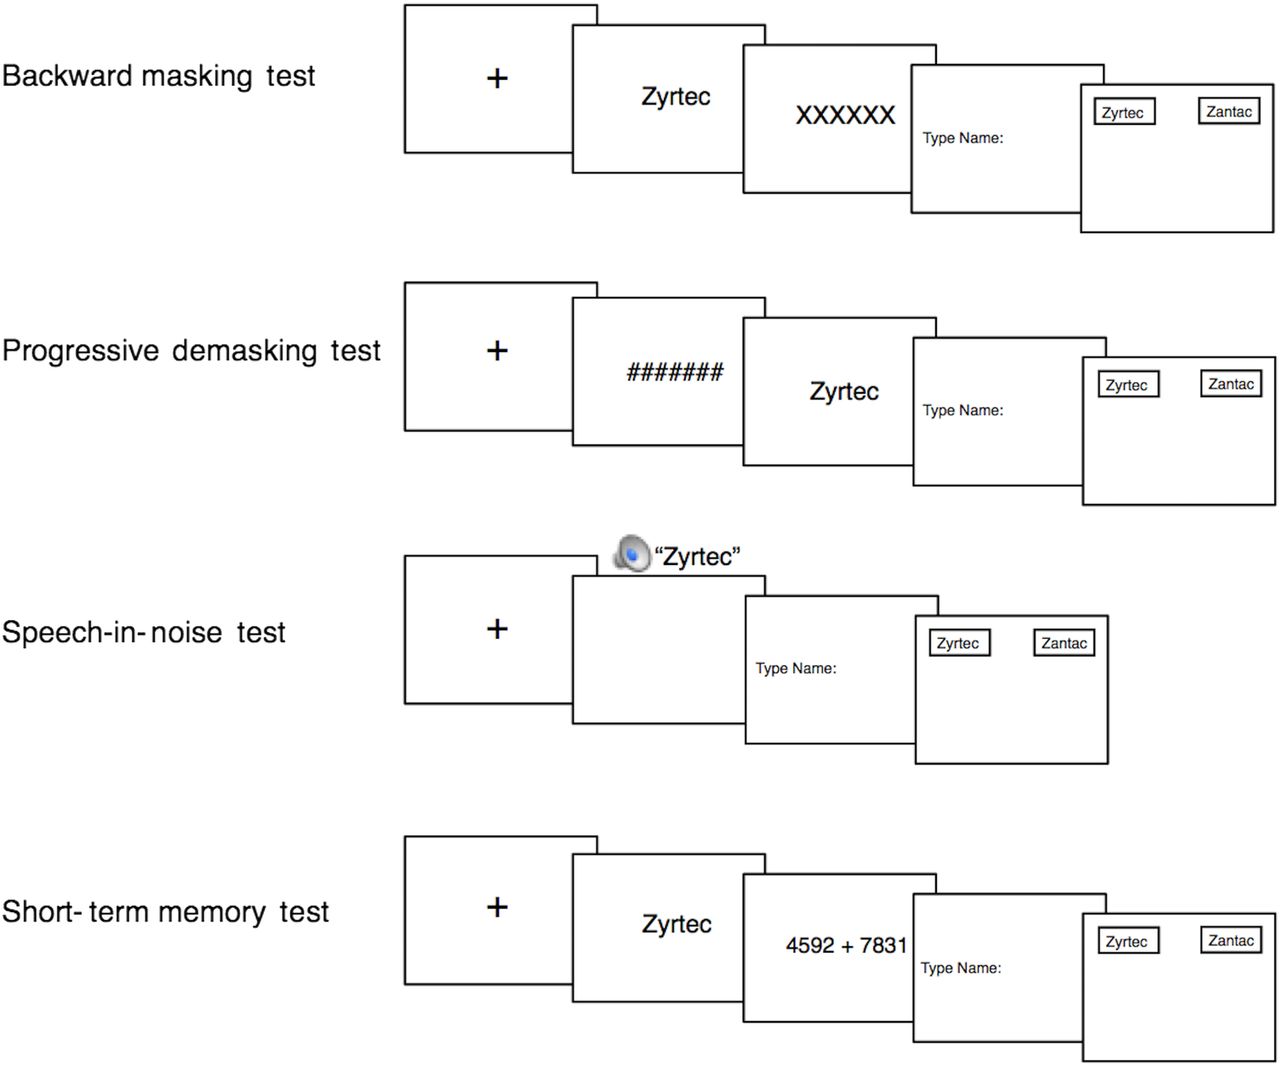
The battery of laboratory memory and perception tests. In the backward masking test, participants attempted to identify a visually presented drug name that was immediately concealed by a visual mask (a row of XXX's). In the progressive demasking test, participants tried to detect a visually presented drug name that was gradually revealed from behind an obscuring visual mask (a row of ###'s). In the speech-in-noise test, participants attempted to identify an orally presented drug name played in background multitalker babble. In the short-term memory test, participants attempted to remember a visually presented drug name after solving a complex math problem. At the end of each trial on each test, participants made two responses: (1) a free recall response in which participants typed the target drug name that they saw or heard and (2) a two-alternative forced-choice response in which participants chose between the target drug name and a competitor drug name.
In the backward masking test (which assessed the ability to accurately see a drug name), participants first saw a fixation cross (ie, +) for 500 ms, focusing their attention on the centre of the screen. Next, a drug name (eg, hydroxyzine) was presented on the centre of the screen for a short duration (32 ms), followed by a row of XXXX's that blocked (or ‘masked’) the previously shown drug name (the XXXX's appeared for 1000 ms). After viewing the name, participants were prompted to type in the name they just saw (a recall test of the target drug name) and press <ENTER> to submit their response. Then, participants were asked to decide which of two names presented on the screen (eg, hydroxyzine or hydralazine) was the name they recently saw (ie, a two-alternative forced-choice test between the target drug name and the competitor drug name). Participants made a response by using the mouse to move the cursor (which was automatically placed at the bottom middle of the screen) to one of the two names displayed on the top left and right of the screen and clicking on one of the names. The errors, response times, and x and y coordinates of the mouse cursor were recorded during the two-alternative forced-choice test by the computer programme Matrix Laboratory (Matlab). (MathWorks. Matlab: The language of technical computing: MathWorks; 2015 (Available from: http://www.mathworks.com/products/matlab/.)
In the progressive demasking test (which also assessed the ability to accurately see a drug name), participants were first presented with a fixation cross to direct their attention to the middle of the screen (500 ms duration). Participants then saw a drug name that was gradually revealed from behind an obscuring row of ####'s (ie, the name was ‘progressively demasked’). With every additional iteration, the name was presented for longer (from 18 to 126 ms in 18 ms intervals) and the mask was presented for shorter (from 108 to 0 ms in 18 ms intervals), creating the perception of a name being increasingly uncovered. As soon as the participants thought they recognised the name, they pressed a button (<ENTER>), which stopped the demasking process and took them to the response part of the test. In the response part, participants typed in the name they just saw (the recall test) and then chose the name from two names displayed on the screen (the two-alternative forced-choice test), while their mouse coordinates were recorded.
In the speech-in-noise test (which assessed the ability to accurately hear a drug name), participants were first shown a fixation cross (2000 ms duration). Next, a spoken drug name was presented over headphones. The name was played amid background noise composed of multitalker babble. The background noise was played at 69 decibels, while the name was played at 66 decibels, creating a −3 dB signal-to-noise ratio. The background noise began 500 ms before the onset of the name and ended 500 ms after the offset of the name. After hearing the name, participants completed the recall and two-alternative forced-choice tests (as described above for backward masking and progressive demasking). The spoken drug names were recorded by a female pharmacist whose native language was English. The background noise (‘multispeaker babble,’ obtained from Auditec of St. Louis) consisted of 20 people concurrently speaking. The drug names and background noise were peak amplitude normalised using Audacity.
In the short-term memory test (which assessed the ability to remember a drug name), participants saw a fixation cross (1500 ms), followed by a drug name (500 ms). Next, participants were given a math problem to solve (an addition problem with two 4-digit numbers; eg, 7483+8533). Participants typed in the answer followed by <ENTER> to submit their response. Then, participants completed the recall and two-alternative forced-choice tests.
The perception and memory tests were conducted on a 13-inch MacBook Pro laptop using Matlab's Psychtoolbox extension. An Apple magic mouse and Sennheiser HD-280 Pro Headphones were also used for testing.
Drug names and real-world error rates
The drug name stimuli used in the laboratory memory and perception tests came from a data set of real-world errors provided by an Agency for Healthcare Research and Quality (AHRQ)-listed patient safety organisation (PSO) in the US.28 The PSO compiled the data from annual dispensing error incident report data from a large, national retail pharmacy chain with more than 1000 locations. The data were collected over a 12-month period from all of the chain's stores (which cover most states in the US). The data set has not been validated before, but the data are consistent with expected patterns (eg, higher similarity between the prescribed and dispensed drug name and lower frequency and familiarity of the prescribed drug name were correlated with higher error rates).
The data set consisted of 109 look-alike and sound-alike pairs of names, each with a prescribed drug (eg, hydroxyzine) and an incorrectly dispensed drug (eg, hydralazine). The 109 pairs consisted of a roughly equal number of high-frequency, medium-frequency and low-frequency error pairs. For each pair, the number of incidents was provided (eg, how many times hydroxyzine was prescribed but hydralazine was dispensed), along with the number of times the prescribed drug was prescribed overall (eg, how many times hydroxyzine was prescribed overall). These data allowed us to determine each drug name pair's real-world error rate (the number of times the error occurred divided by the number of opportunities). These real-world error rates were used as dependent measures in the analyses, to be predicted by data from the laboratory memory and perception tests (for more details, see the Data Analysis section).
The drug names in this data set were to be used as stimuli in the laboratory memory and perception tests. However, the specific names that were mistaken in these errors were not known precisely, because the data set did not indicate whether the drug products were prescribed and dispensed using their brand or generic names (in other words, both the brand and generic names were listed in the data set). Thus, the errors could have reflected one of four combinations of mistakes: generic mistaken for generic, brand mistaken for brand, generic mistaken for brand or brand mistaken for generic.
To determine which of the four combinations of mistakes was most probable (and which should represent each pair in our tests and analyses), we used the following procedure. First, if any of the four combinations was included on the Institute for Safe Medication Practice's (ISMP's) List of Confused Drug Names,1 then that combination was selected as the most probable. In the second step, the degree of linguistic similarity among all four combinations was calculated. The similarity measure was an average of two metrics: BI-SIM (a measure of orthographic similarity) and EDITEX (a measure of phonological similarity).14 ,15 After computing the average of BI-SIM and EDITEX for all four combinations, the combination with the highest similarity score was selected. When there was a tie for the highest similarity score, prescribing frequency data from the National Ambulatory Medical Care Survey (NAMCS) and National Hospital Ambulatory Medical Care Survey (NHAMCS) were used to break the tie; the drug name combination with the highest frequency was selected. When the highest similarity score yielded a combination of two drug names that did not share the same first letter, we selected the next highest similarity combination in which the same first letter was shared. Similarity in the onset of the word overruled BI-SIM and EDITEX similarity because previous research has indicated stronger linguistic interference between two words that share onset overlap relative to two words that share rhyme overlap.29 The third step was clinical judgement. The selected names were sent to a team of practicing pharmacists and doctors and medication safety experts. If the team thought another name combination was more likely than the selected combination, then that name combination was also included in the laboratory memory and perception tests. This procedure resulted in 123 prescribed–dispensed name combinations to be used in the laboratory memory and perception tests, with the prescribed name being the target name and the dispensed name being the competitor name in the two-alternative forced-choice test.
The 123 name pairs were presented on the laboratory memory and perception tests in one of four lists. The four lists were generated randomly, but with constraints, so as to ensure that repeated names were not consecutive, and, if possible, repeated names appeared in all possible presentation orders an equal number of times. For example, Prozac was listed as the prescribed drug twice, with two different dispensed drugs (Prozac/Prilosec and Prozac/Provera). The lists were designed so that Prozac/Prilosec and Prozac/Provera never occurred consecutively and were presented in half of the lists with Prozac/Prilosec first and in the other half of the lists with Prozac/Provera first. Additionally, for all name pairs, the position of the target name on the two-alternative forced-choice test was on the left in half of the lists and on the right in the other half of the lists.
For the pairs in which there were multiple possible combinations (because of uncertainty as to whether it was a brand–brand, generic–generic, brand–generic and generic–band mistake), after the laboratory test data were collected, the combination that produced the highest error rate overall across the four memory and perception tests was chosen to represent that pair in the analyses. This procedure yielded the 109 name pairs that were most likely to be the source of the errors and were therefore to be used in the analyses. In this set of 109 names, there was one name pair (glyburide prescribed—glipizide dispensed) that had two real-world error rates in the data set, one representing a combination product and one representing a single-component product. Because there were two real-world error rates for the same name pair, we could not include it in the analyses. (However, glipizide prescribed—glyburide dispensed did have a single real-world error rate and therefore was included in the analyses.) Thus, 107 pairs of names were considered in the analyses. These 107 pairs are provided in the online supplementary appendix (columns 1 and 2), along with their real-world error rates (column 3). Of the 214 names in the 107 pairs, 88 were brand names and 126 were generic names. The pairs' real-world error rates have been linearly transformed by multiplying all of them by the same undisclosed number. When multiplied by the undisclosed number, the lowest error rate became 1.0 and served as the reference rate. This transformation concealed the true error rate but maintains the relative magnitude differences among the error rates. The true error rate was concealed based on an agreement with the PSO that provided the real-world error data. The transformed error rates, which appear in the online supplementary appendix and were used in all of the analyses, had no effect on the analyses (ie, the F-values, R2 and normalised root-mean-square error (RMSE) were the same regardless of whether transformed or untransformed error rates were used).
Supplementary appendix
Data analysis
We began by computing descriptive statistics (mean, SD and range) for the transformed real-world error rates, the laboratory memory and perception data (eg, error rates, near miss rates and response times), as well as word attributes of the drug names, such as subjective familiarity ratings and objective measures of name similarity and frequency.
The laboratory memory and perception test error rates (and near-miss rates and response times) were obtained from the two-alternative forced-choice component of the tests (rather than from the free recall component) because these errors are directly relevant to confusions of drug name pairs. (The free recall data will be used in a separate study in which individual names rather than pairs of names are considered.) Laboratory test error rates were defined as the number of participants who made an incorrect response on the drug pair divided by the number of participants who completed the test, multiplied by 100 (ie, (number of participants who made an error/number of participants total)×100). For example, 2 out of 40 participants (5%) made an error on alprazolam/lorazepam in the backward masking test, so an error rate of 5% was entered into the analysis for that drug name pair (see online supplementary appendix). The error rates from the laboratory memory and perception tests and the real-world error rates were based on different units, with the test error rates based on participants (the number of participants who made an error over the total number of participants) and the real-world error rates based on prescriptions (the number of wrong prescriptions dispensed over the total number of prescriptions). Laboratory test near miss rates were defined as the number of participants who made a near miss (ie, moved the cursor over the incorrect response but did not select the incorrect response) on the drug pair divided by the number of participants who completed the test, multiplied by 100 (ie, (number of participants who made a near miss/number of participants total)×100). Laboratory test response times were defined as the mean duration it took all participants who took the test to select the correct answer on fully correct (ie, non-error and non-near miss) trials for the specific drug pair in question. The response time started at the onset of the presentation of the two names on the two-alternative forced-choice test and ended when participants clicked on the name. (For the progressive demasking test, response time was an average of the response time it took to complete the two-alternative forced-choice test and the response time it took to indicate they recognised the target name during the demasking process (ie, from onset of the name to when the participant selected <ENTER>).)
Familiarity was derived by averaging participant response ratings on the familiarity questionnaire (these data are provided in the online supplementary appendix, column 8). Frequency was based on the prescribing frequency provided in our real-world data set. Length was calculated as the number of letters in the word. Bigram frequency was the mean of the English frequency of all adjacent letter combinations in the word (as determined by Cross-Linguistic Easy-Access for Phonological and Orthographic Neighborhood Densities (CLEARPOND)30). Similarity was the mean of BI-SIM ratings (a measure of orthographic similarity) and EDITEX ratings (a measure of phonological similarity).5–7 ,28 ,29
Next, we conducted the main analyses. The goal of these analyses was to quantify the magnitude of the association between data from the laboratory memory and perception tests (and word attributes) and error rates observed in the real world. First, we computed bivariate correlations (Pearson's r-values) between the real-world error rates and the data from the memory and perception laboratory tests (as well as word attributes). Then, we conducted a multiple linear regression analysis with data from the laboratory memory and perception tests (and word attributes) as the independent variables and real-world error rates as the dependent variable. The F-value, R2 and normalised RMSE were used to evaluate how well each step of the regression model fit the real-world error data. (The normalised RMSE was calculated by dividing the RMSE by the difference between the maximum and minimum value of the transformed dependent variable (ie, the real-world error rates), and then multiplying by 100.)
In the first step of the multiple linear regression analysis, error rates from the laboratory memory and perception tests were entered as predictors. In the second step, we added near miss rates from all four tests. In the third step, response times on the four tests were added. In the fourth step, we added other metrics that did not come from the laboratory memory and perception tests. Specifically, we included several word attributes that are known to affect language processing—the target name's word frequency, familiarity, length, bigram frequency and similarity to the competitor name.5–7 ,31 ,32
We also conducted two exploratory multiple linear regression analyses. In the first exploratory analysis, we examined whether the association between the laboratory test data and real-world data would be different if only the clinical participants (doctors, nurses, pharmacists and pharmacy technicians) were considered, given that these participants have more familiarity with the names used in the laboratory tests and more experience seeing, hearing and remembering drug names than do lay people. In the second exploratory analysis, we considered only pharmacists and pharmacy technicians because our data sets of real-world errors were pharmacy errors committed by pharmacists and pharmacy technicians.
We then conducted a mixed-effects logistic regression analysis to further examine the association between laboratory memory and perception error rates and real-world error rates. A benefit of the mixed-effects logistic regression analysis is that it considers every trial of the laboratory memory and perception tests (by contrast, the multiple linear regression analyses collapse across trials). The mixed-effect logistic regression also determines whether the results from the multiple linear regression maintain when a different type of regression analysis is conducted. Because logistic regression analyses require binary data, the data were inverted such that memory and perception accuracy (correct or incorrect) was the dependent variable and real-world error rates were the independent variable. The logistic regression analyses were three-level analyses with the drug name pairs at level 1, participants at level 2 and type of participant (doctor, nurse, pharmacist, technician, lay person) at level 3 in a random intercepts model. These analyses were conducted separately for each of the laboratory memory and perception tests, yielding four models. The coefficient estimates of the error rate were used to evaluate how well each model accounted for the real-world error data.
Subsequently, two cross-validation analyses were conducted to determine whether the laboratory measures could successfully predict other drug name error data. Specifically, we assessed whether the laboratory measures' prediction of errors generalises to previously unseen drug name pairs (the first cross-validation analysis) and to a different pharmacy chain (the second cross-validation analysis).
In the first cross-validation analysis, a 10-fold cross-validation procedure was conducted. The final multiple linear regression model (as derived from the analyses described above) was trained on 90% of the drug name pairs and then tested on 10% of the drug name pairs. This procedure was repeated 10 times, so that every subset of data served as the 10% test set once. After each of the 10 iterations, the difference between the predicted error rate and the actual error rate was calculated for each drug name pair in the test data, from which a normalised RMSE was derived. The normalised RMSE from the cross-validation was then compared with the normalised RMSE from the final multiple linear regression model, with a small difference between the two RMSE values indicating a successful cross-validation. This type of cross-validation guards against overfitting and gives a more unbiased estimate of the model's performance on unseen data (as opposed to its performance on data that were used to build it).
In the second cross-validation analysis, we examined whether the laboratory memory and perception data predicted real-world error rates from a different pharmacy chain. Sixty-four of the 107 drug name pairs from the first pharmacy chain's data set were also in this second pharmacy chain's data set. The error data from the second pharmacy chain were provided to the authors by the same AHRQ-listed PSO that provided the first data set. The second pharmacy chain was a large, national retail pharmacy chain with more than 1000 locations, and the data were collected over an 18-month period from all of the chain's stores (which are located in most states in the USA). We used the final model from the multiple linear regression analysis to predict the 64 drug name pair error rates in the second pharmacy chain.
The above analyses were conducted using R, Statistical Package for the Social Sciences (SPSS), and SuperMix.32 The data entered into the analyses were processed using Matlab. (MathWorks. Matlab: The language of technical computing: MathWorks; 2015; available from: http://www.mathworks.com/products/matlab/).
Results
Descriptive statistics
Table 2 provides the mean, SD and range for the transformed real-world error rates, laboratory memory and perception data (error rates, near misses and response times) and word attributes (drug name word frequency, familiarity, length, bigram frequency and similarity).
Descriptive statistics for all measures
We also computed mean accuracy for the math problems completed during the short-term memory test. Participants, on average, answered 75.0% of the problems correctly, indicating that participants were not disregarding the math component of the memory test.
Bivariate correlations
Table 3 presents correlations between real-world error rates and laboratory memory and perception and word attribute measures.
Bivariate correlations between real-world errors and laboratory and word measures
Laboratory memory and perception error rates
All laboratory memory and perception test error rates were positively correlated with real-world error rates, such that more errors on the laboratory tests were associated with higher real-world error rates. These correlations ranged from small (r=0.09) to moderate (r=0.34). Correlations among the error rates from the four laboratory tests ranged from 0.03 to 0.63.
Laboratory memory and perception near misses
All near miss rates were positively correlated with real-world error rates, indicating that more near misses on laboratory memory and perception tests were associated with more real-world errors. These correlations ranged from small (r=0.13) to moderate (r=0.34). Correlations among the near miss rates from the four laboratory tests ranged from 0.14 to 0.46.
Laboratory memory and perception response times
All response times were positively correlated with real-world error rates. Longer response times were associated with more real-world error rates. These correlations were small (ranging from r=0.11 to r=0.29). Correlations among the response times from the four laboratory tests ranged from 0.55 to 0.78.
Word attributes
Correlations between word attributes and real-world error rates ranged from small (r=0.05) to moderate (r=0.37). Correlations among the word attributes ranged from 0.33 to 0.36.
Multiple linear regression
The results of the multiple linear regressions are displayed in table 4.
Multiple linear regression results
Laboratory memory and perception error rates
In the first step of the regression model, error rates from the laboratory memory and perception tests were entered as independent variables and real-world error rates were entered as the dependent variable. This model provided a statistically significant fit to the data (F(4, 102)=7.13, R2=0.22, R2 adjusted=0.19, p<0.001, normalised RMSE=12.8%), indicating that the laboratory error rates significantly predicted real-world error rates. The significant predictors were backward masking error rate (β=0.32, p<0.01), progressive demasking error rate (β=−0.35, p<0.01) and short-term memory error rate (β=0.36, p<0.01). Speech-in-noise error rate was marginally significant (β=0.17, p=0.056). The progressive demasking error rate switched directions in the regression analysis, becoming a negative predictor despite being positively correlated with real-world error rates, a case of the reversal paradox (possibly due to collinearity).33
Laboratory memory and perception near misses
The addition of near miss rates in the second step significantly improved the model fit, F-change (4, 98)=2.69, p<0.05, and increased the R2 to 0.30 and R2 adjusted to 0.24 (F (8, 98)=5.14, p<0.01, normalised RMSE=12.1%). With error rates and near miss rates in the model, the significant predictors were short-term memory error rate (β=0.41, p<0.01), progressive demasking error rate (β=−0.30, p<0.05), backward masking near miss rate (β=0.21, p<0.05) and speech-in-noise near miss rate (β=0.21, p<0.05). The backward masking error rate was marginally significant (β=0.21, p=0.069).
Laboratory memory and perception response times
Adding response times in the third step did not significantly improve the model fit, F-change (4, 94)=0.92, p>0.1. Response times were therefore dropped from the model.
Word attributes
In the fourth step, word attributes (frequency, familiarity, bigram frequency, length and similarity) were added to the model, yielding a statistically marginal improvement in model fit, F-change (5, 93)=2.06, p=0.078 and increasing the R2 to 0.37 and R2 adjusted to 0.28 (F(13, 93)=4.13, p<0.001, normalised RMSE=11.5%). This model, which accounted for 37% of the data and served as the final regression model, is displayed in figure 2. The significant predictors in the model were short-term memory error rate (β=0.45, p<0.01), backward masking near miss rate (β=0.20, p<0.05) and familiarity (β=−0.26, p<0.05).
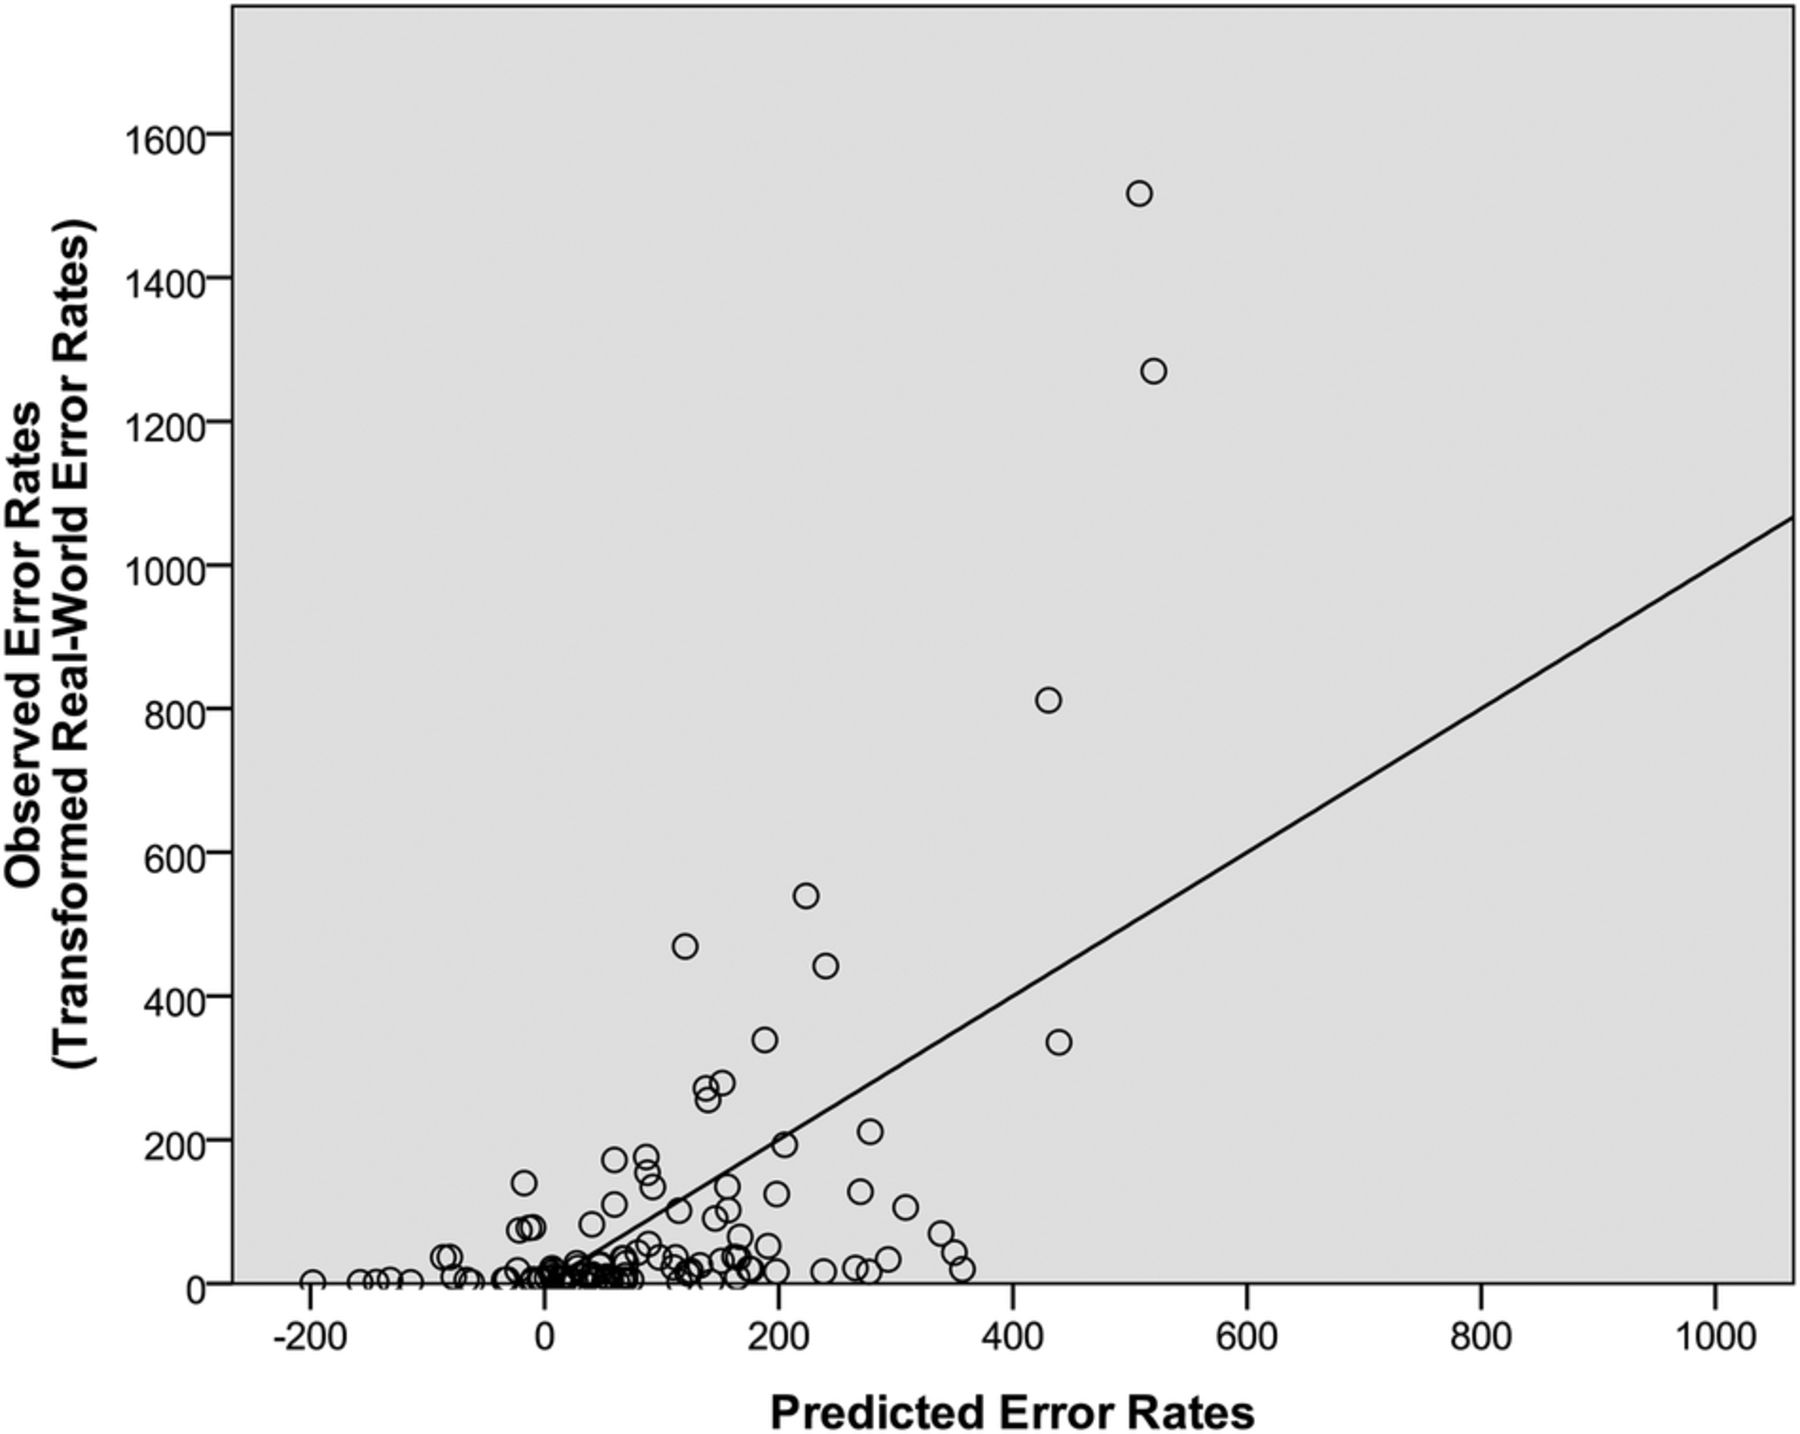
The predicted error rates relative to the real-world error rates. The predicted error rates were derived from the final regression model, which included laboratory test errors, laboratory test near misses and word attributes. The regression line represents the least-squares best-fitting line from the final regression model.
In a follow-up analysis with only the clinical participants (doctors, nurses, pharmacists and pharmacy technicians) included, 40% of the data were accounted for (a statistically significant model, p<0.01), which is slightly higher than the 37% that was obtained with all participants included. In a second follow-up analysis with only the pharmacists and pharmacy technicians included, 36% of the data were accounted for (a statistically significant model, p<0.01), which is slightly smaller than the percentage achieved with all participants.
Mixed-effects logistic regression
The significant association between laboratory memory and perception error rates and real-world error rates (as evidenced by the significant bivariate correlations and multiple linear regression analyses) was also observed in the mixed-effects logistic regression analysis. In the mixed-effects logistic regression analysis, real-world error rates were reliably associated with error rates on all four laboratory memory and perception tests: backward masking (b=−0.0009, p<0.01), progressive demasking (b=−0.0009, p<0.01), speech-in-noise (b=−0.0003, p<0.05) and short-term memory (b=−0.0012, p<0.01).
Cross-validation
In the first cross-validation analysis, a 10-fold cross-validation of the final multiple linear regression model (with laboratory error rates, laboratory near misses and word attributes as the independent variables) yielded a normalised RMSE of 13.3%. The cross-validation normalised RMSE was minimally different from the normalised RMSE of the final multiple linear regression model (11.5%), a 1.8% difference, indicating that the initial model only slightly overfit its training data.
In the second cross-validation analysis, we conducted a multiple linear regression analysis with laboratory memory and perception error rates, laboratory memory and perception near misses, and word attributes as independent variables (ie, the same independent variables as the final model derived above) and error rates from a second pharmacy chain as the dependent variable. (The Pearson's bivariate correlation between the two data sets was r=0.84 and p<0.01.) This model provided a statistically significant fit to the data (F(1350)=3.19, R2=0.45, R2 adjusted=0.31, p<0.001, normalised RMSE=13.7%), indicating that laboratory test data were significantly predictive of real-world error rates from a second pharmacy chain. The only significant predictor in this analysis was short-term memory near miss rate (β=0.29, p<0.05). This model, in which 45% of the variability in the real-world data were accounted for, is depicted in figure 3.

The predicted error rates relative to the real-world error rates from the second pharmacy chain. The predicted error rates were derived from the final regression model, which included laboratory test errors, laboratory test near misses and word attributes. The regression line represents the least-squares best-fitting line from the final regression model.
Discussion
The current study demonstrated a significant association between real-world wrong drug name confusion error rates and error rates from laboratory tests of memory and perception. This significant association suggests that laboratory memory and perception tests may be able to predict how often a drug name will be confused in outpatient pharmacy settings. We confirmed this predictive capacity through cross-validation analyses in which the laboratory measures effectively predicted real-world error rates for drug names on which the model was not trained and error rates from a second pharmacy chain.
Previously, it had been proposed that laboratory memory and perception measures could be an effective preapproval test for determining whether a proposed drug name is excessively confusing and should not enter the marketplace.26 However, these tests have not been adopted because of the lack of evidence for a reliable association between a drug name's performance on memory and perception tests and real-world error rates.13 Here, we demonstrate such an association. In fact, this study is the first, to our knowledge, to find a significant association between any method that may be used for preapproval testing and real-world error rates.
Although not the primary goal, this study also addresses the source of drug name confusion errors by suggesting that many of them may be caused by lapses in memory and perception. In previous studies, it had been suggested that visual perception, auditory perception and short-term memory might underlie many drug name confusion errors.5–7 By demonstrating a significant association between laboratory memory and perception tests and real-world data, the current results strengthen the argument that misremembering and misperceiving are the source of many drug name confusion errors.
Limitations
Four limitations of the study are worth noting. The first is the limited scope of the study. The study was limited in the number of participants, number of drug names and number of pharmacy chains. Thus, it remains to be determined whether the results will generalise to other participants, other drug names and other pharmacy chains. The cross-validation results, however, suggest that the findings are likely to translate beyond the current study.
A second limitation of the current study is that the real-world error data came from a pharmacy setting, while many of our clinical participants worked in a different setting, a hospital setting. However, the vast majority of the drugs included in the current study are used in both pharmacy and hospital settings. As evidence, the participants' high familiarity ratings of the drug names indicated that they had significant experience with these drugs. Thus, the difference in setting was unlikely to substantially affect the current results, and the findings are likely to generalise to both pharmacy and hospital settings.
A third limitation is that the data set did not specify whether the brand or generic names were involved in the errors. Consequently, we had to determine the names through several methods, including clinical judgement, laboratory tests, objective similarity ratings and ISMP's List of Confused Drug Names. In some cases, these methods may have led to the wrong names. Using the wrong names, however, would have only underestimated the ability of the laboratory tests to account for the real-world error rates, and thus the tests may be more effective than was observed in the current study.
A related and final limitation is how well the laboratory tests accounted for the variance in real-world error rates. The laboratory data explained 37% of the variance in the data set from the first pharmacy chain and 45% of the variance in the data set from the second pharmacy chain. These are strong and significant associations, but nevertheless may be smaller than desired. By refining the laboratory tests used here and including other laboratory tests that tap into other cognitive, perceptual and motor processes that are involved in drug name mistakes, the amount of variance explained may be increased. This study nevertheless serves as a good starting point from which more effective preapproval laboratory testing procedures can be developed.
Conclusion
The current study provides evidence that laboratory tests of memory and perception can predict real-world error rates. Because these tests are evidence-based and also simple and inexpensive to design and administer, regulators and pharmaceutical companies should consider adopting these tests to screen proposed drug names during the preapproval process. By using effective preapproval tests, harmful drug name confusion errors can be minimised.
References
Footnotes
Correction notice This article has been updated since it first published Online First. The author names have been corrected.
Twitter Follow Bruce Lambert at @bruce_lambert
Contributors BLL, SRS, MMS, WLG, GDS, AJV, MJG, MB, CR and SF designed the study; SRS and MMS collected the data; SRS and BLL analysed the data; SRS, BLL, MMS, WLG, GDS, AJV, MJG, MB, CR and SF wrote the manuscript.
Funding This project was supported by grant number U19HS021093 from the Agency for Healthcare Research and Quality. The content is solely the responsibility of the authors and does not necessarily represent the official views of the Agency for Healthcare Research and Quality.
Competing interests BLL has ownership interests in two companies (BLL Consulting, Inc. and Pharm I. R., Inc.) that provide software and consulting services related to the prediction, detection and prevention of drug name confusion errors. Neither company had any role in the conduct of these experiments or in the preparation of the manuscript.
Ethics approval Institutional Review Boards at Northwestern University and University of Illinois at Chicago.
Provenance and peer review Not commissioned; externally peer reviewed.
Data sharing statement The primary data are available in the online supplementary appendix. To access all other data, please contact the corresponding author.