Article Text

Abstract
Background: Internationally, there is increasing recognition of the need to collect and analyse data on patient safety incidents, to facilitate learning and develop solutions. The National Patient Safety Agency (NPSA) for England and Wales has been capturing incident data from acute hospitals since November 2003.
Objectives: This study analyses patterns in reporting of patient safety incidents from all acute hospitals in England to the NPSA National Reporting and Learning System, and explores the link between reporting rates, hospital characteristics, and other safety and quality datasets.
Methods: Reporting rates to the NPSA National Reporting and Learning System were analysed as trends over time, from the point at which each hospital became connected to the system. The relationships between reporting rates and other safety and quality datasets were assessed using correlation and regression analyses.
Results: Reporting rates increased steadily over the 18 months analysed. Higher reporting rates correlated with positive data on safety culture and incident reporting from the NHS Staff Survey, and with better risk-management ratings from the NHS Litigation Authority. Hospitals with higher overall reporting rates had a lower proportion of their reports in the “slips, trips and falls” category, suggesting that these hospitals were reporting higher numbers of other types of incident. There was no apparent association between reporting rates and the following data: standardised mortality ratios, data from other safety-related reporting systems, hospital size, average patient age or length of stay.
Conclusions: Incident reporting rates from acute hospitals increase with time from connection to the national reporting system, and are positively correlated with independently defined measures of safety culture, higher reporting rates being associated with a more positive safety culture.
Statistics from Altmetric.com
Since the publication of the US Institute of Medicine report “To err is human”1 and the UK Department of Health report “An organisation with a memory,”2 there has been increasing recognition of the need for healthcare organisations to monitor and learn from patient safety incidents. Proposals on how to accomplish this have included the use of reporting systems, and over the last few years several countries have established national or system-wide reporting systems to facilitate large-scale monitoring and analysis of incident data.3–5 The National Reporting and Learning System (NRLS) for England and in Wales, established by the National Patient Safety Agency,6 was rolled out from late 2003 and has now received over one million reports, mainly from acute hospitals.7
Although there may be benefits to be gained from the establishment of large reporting systems,89 there are challenges that accompany their development, both at the individual reporting level and at the data-handling and analysis level. Many incidents still go unreported, with doctors being less likely than nurses to report.1011 Barriers to reporting include time constraints, lack of knowledge about how and what to report, fear of blame, lack of feedback and a perceived lack of value in the reporting process.11–13 There are also technical challenges, such as connecting the national system to the many different local systems within health organisations, and developing a consistent framework for categorising incidents.31415 Furthermore, once the information has been captured, large amounts of data must be analysed so that meaningful feedback can be produced.3 The World Health Organization Draft Guidelines for Adverse Event Reporting and Learning Systems8 identify a range of analytical approaches, including correlations and trend and cluster analyses, that might be used to identify patterns and assess risks.
All acute hospitals in England are now beginning to report to the National Reporting and Learning System, having been progressively connected to the system over a period of about 2 years. However, even taking into account the differential timetables for connection, it is clear that some organisations are reporting higher numbers of incidents than others.7
The National Reporting and Learning System is not the only quality and safety system to which hospitals in England are asked to report. For example, all are expected to report cases of bacteraemia due to methicillin-resistant Staphylococcus aureus (MRSA) to the Department of Health,16 and to report incidents related to medicines and equipment to the Medicines and Healthcare Products Regulatory Agency.17
In addition, there are other data related to quality and safety that may have a relationship to incident reporting. For example, the annual NHS Staff Survey18 includes questions about safety culture and incident reporting, and the NHS Litigation Authority19 conducts a risk-management assessment within each hospital and awards a rating on the basis of this.
The NHS in England therefore has an increasingly rich dataset relating to safety and quality in healthcare. This study has two main aims. First, it analyses the patterns and trends in reporting by acute hospitals in England to determine whether there are any defining features of those which have higher or lower reporting rates. Second, it explores the relationship between reporting rates and other data relating to patient safety and quality of care.
METHODS
Hospitals included in the analysis
Anonymised, aggregated data on the number and type of incidents reported by the 173 acute hospitals in England to the National Reporting and Learning System (NRLS) between April 2004 and November 2005 were provided by the National Patient Safety Agency.6 Of the 173 acute hospitals, 148 were included in the analysis, as they had a permanent connection to the NRLS and had reported at least one incident during the period analysed (April 2004 to November 2005).
Analyses undertaken and their objectives
Initially, an analysis of patterns and trends in reporting was undertaken to explore whether higher reporting rates were associated with particular hospital characteristics or types of incident (table 1). Second, the relationship between reporting rates and other hospital-level safety data was explored (table 2).
Calculation of reporting rates
To account for hospital size and activity, reporting rates were expressed as the number of reports per 100 bed days per month, or per 100 consultant episodes per month. Data on bed days and consultant episodes were obtained from the Hospital Episode Statistics (HES) website.21
Calculation of trends in reporting rates
The moving average method was used to calculate the trend in reporting rates,24 in order to minimise fluctuations caused by data being reported and processed in batches, both within hospitals and within the NRLS. In this method, the first data point is an average of months 1, 2 and 3; the second point is an average of months 2, 3 and 4; and so on. The data points were calculated from each hospital’s connection date onwards.
Correlation and regression analyses
Linear associations between reporting rates to the NRLS and other safety data were explored using the Spearman correlation coefficient and ordinary least-squares linear regression analyses, using STATA.25 Statistical tests were two-sided, and a significance level of p⩽0.05 was used for all analyses.
RESULTS
Trends and patterns in reporting to the National Reporting and Learning System
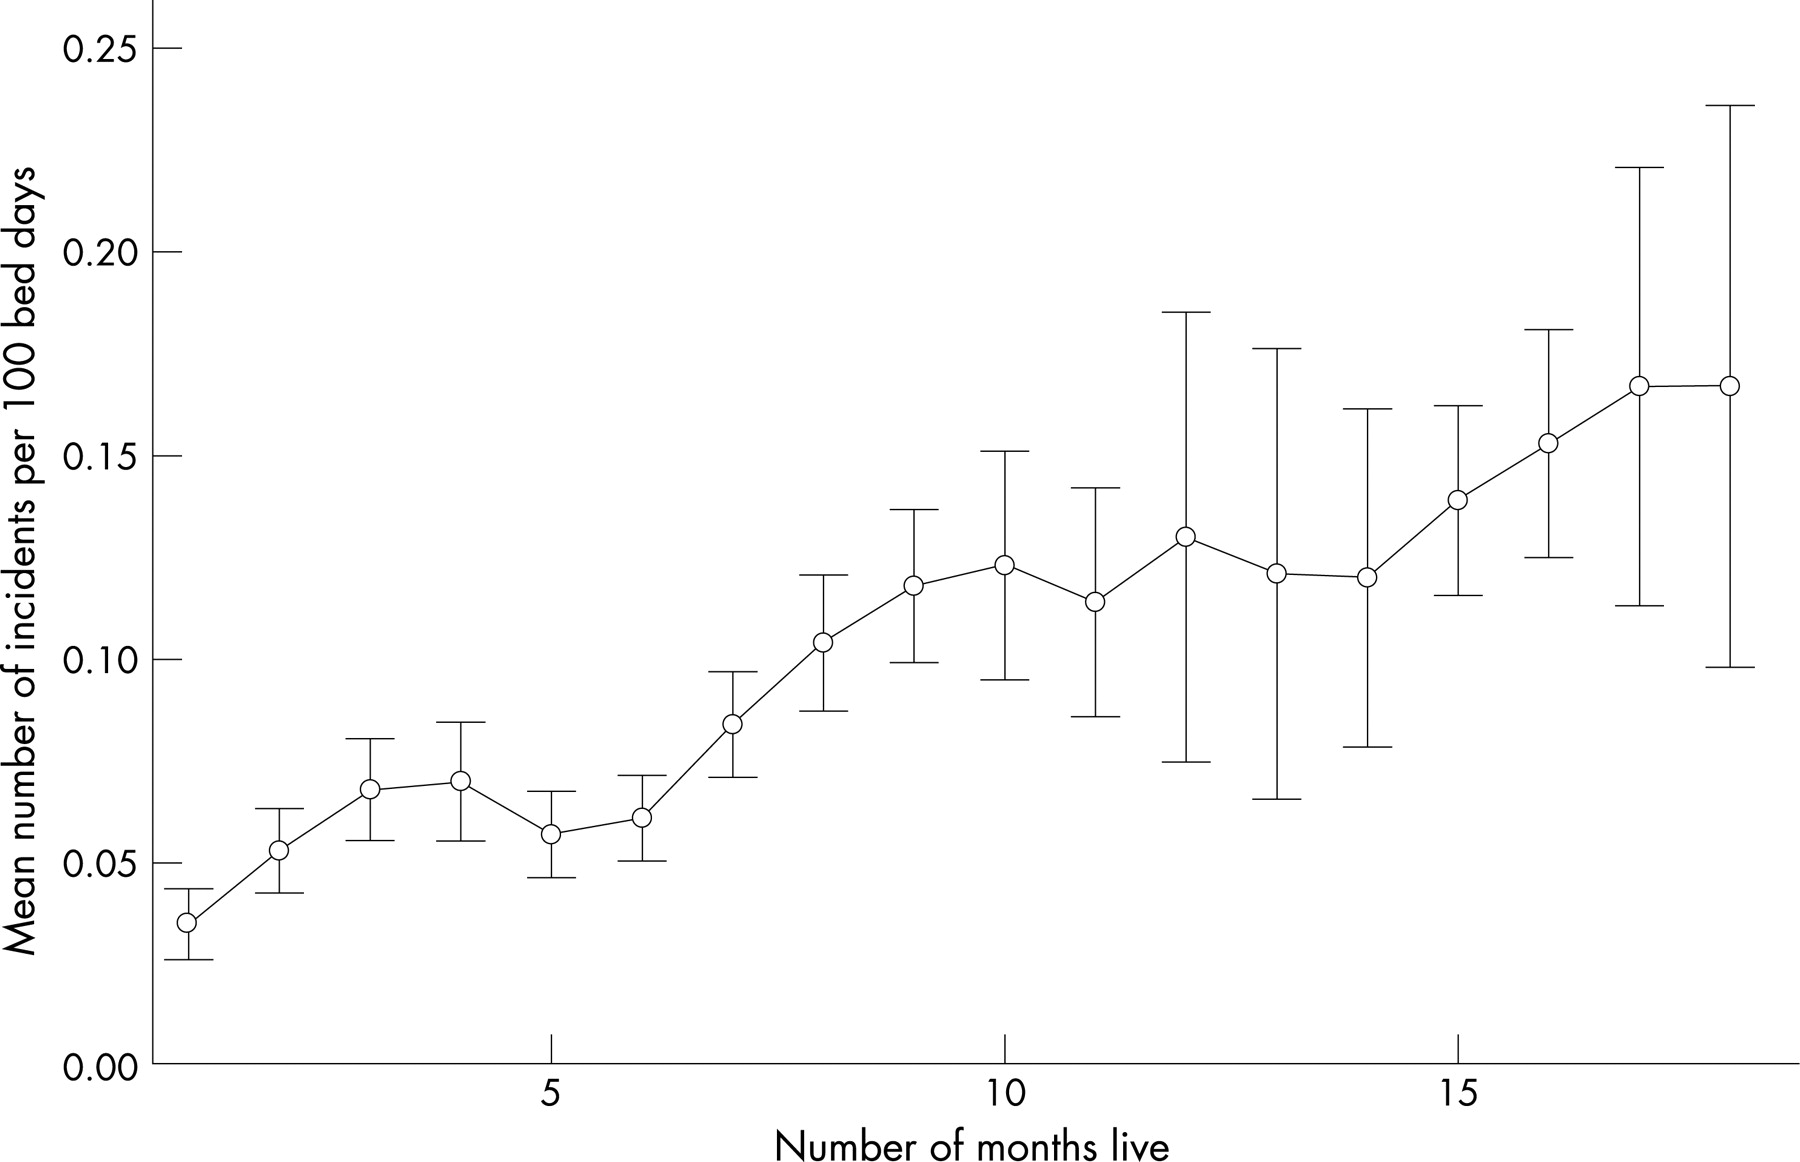
Figure 1 shows the trend in mean reporting rates to the NRLS across 148 hospitals (per 100 bed days per month). To minimise the effect of hospitals becoming connected to the system at different times, the data points are calculated from each hospital’s connection date onwards (ie, month 1 is an average of the first live month of all hospitals, irrespective of date of connection). Reporting rates were still increasing when hospitals had been connected to the system for 18 months (mean reporting rates showed a linear trend; p<0.001). Trends in reporting rate were similar whether expressed per 100 bed days or per 100 consultant episodes (not shown); rates per 100 bed days were selected as a proxy for hospital size and activity, since bed days are a more discrete entity and were thought to better reflect the level of hospital activity.
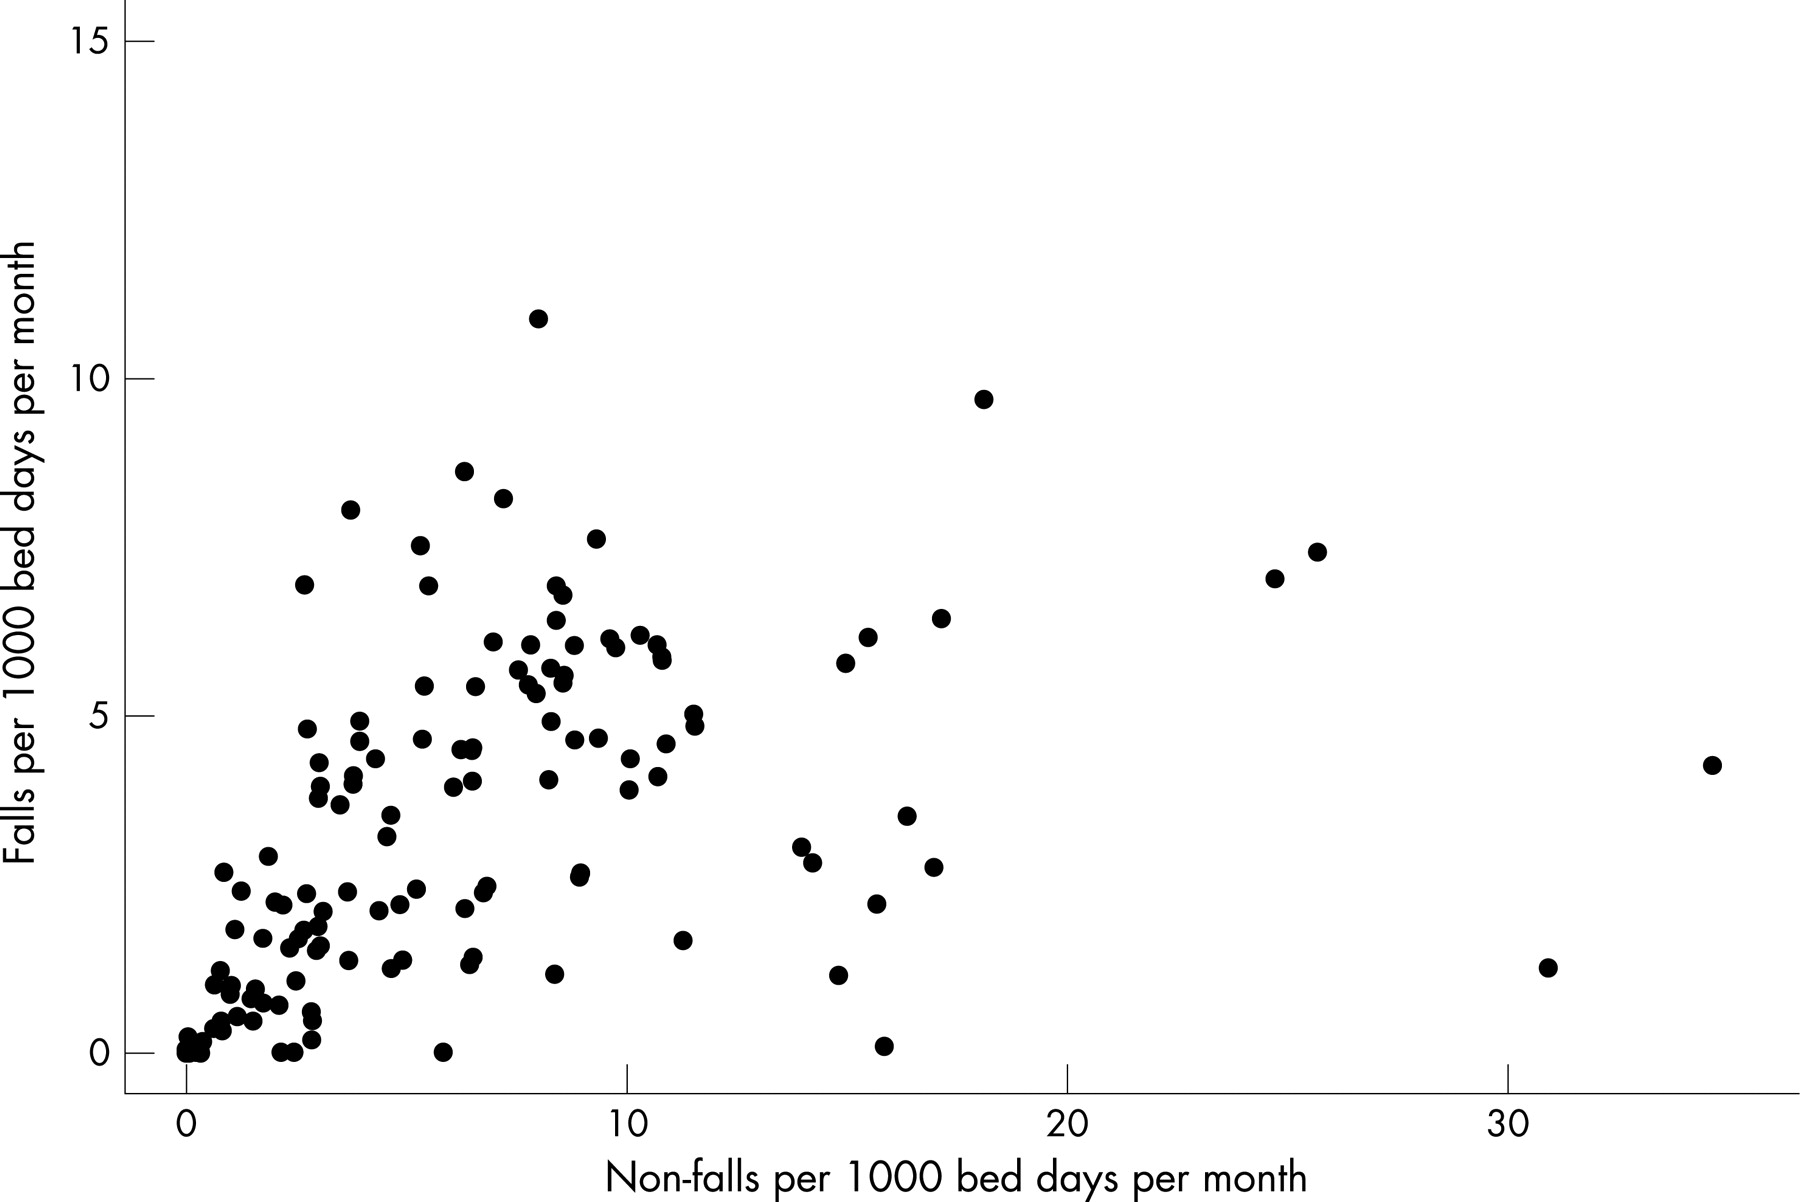
Hospitals with higher overall reporting rates had a lower percentage of reports in the “slips, trips and falls” incident category (correlation −0.21, 95% CI −0.37 to −0.05, p = 0.015). Figure 2 illustrates that while, for the majority of hospitals, the rate of falls increases in line with other types of incident, a few hospitals appear to be reporting higher rates of non-fall incidents while the rate of falls remains relatively constant. There were no significant correlations with proportions of other incident types. Nor was there any correlation between overall reporting rate and the proportion of reports relating to incidents of differing levels of severity.

Relationship between reporting rates and safety culture data
The NHS Staff Survey is completed annually by staff in all NHS organisations in England. We analysed the relationship between reporting rates to the NRLS and the proportion of staff at each hospital giving positive responses to the NHS Staff Survey over two consecutive years—2004 and 2005—using questions on safety culture and incident reporting.18 Of the six questions on fairness and effectiveness of reporting in the 2004 survey, there were significant linear relationships between higher reporting rates and a higher proportion of positive responses to four of the questions (table 3). Although the wording and response categories were somewhat dissimilar in the 2005 survey, there were significant correlations on the question on encouragement to report (regression coefficient 0.03, 95% CI 0.01 to 0.06, p = 0.009) and on the question on blaming and punishing for making errors (regression coefficient 0.03, 95% CI 0.01 to 0.06, p = 0.002).
Of the eight questions on health and safety at work in the 2004 survey, there was a significant linear relationship with one question: whether staff have access to counselling services at work (regression coefficient 0.02, 95% CI 0.004 to 0.036, p = 0.016). This question was not included in the 2005 survey.
The survey also included questions on the number of errors observed and reported by staff. The correlation between higher reporting rates and the proportion of staff having seen at least one error in the last month was not significant (2004 survey, regression coefficient 0.02, 95% CI −0.001 to 0.05, p = 0.058). However, there was a significant positive correlation between higher reporting rates and a higher proportion of staff having reported the last error/near miss they saw (2004 survey data, regression coefficient 0.04, 95% CI 0.01 to 0.06, p = 0.005, 2005 survey data, regression coefficient 0.04, 95% CI 0.01 to 0.07, p = 0.015).
There was an additional correlation in the 2005 data in which as the number of staff indicating that they had a moving and handling injury increased, there was a decrease in the number of reported overall incidents per 100 bed days per year (correlation coefficient −0.046, 95% CI −0.090 to −0.002, p = 0.041). A similar non-significant trend was found in the 2004 data.
The NHS Litigation Authority (NHSLA)19 conducts risk-management assessments within hospitals. Organisations can choose whether to be assessed for Level 1, 2 or 3, with Level 3 being the highest (table 4), and receive a financial incentive for achieving a higher level. We explored the relationship between reporting rates and NHSLA risk-management ratings. The 10 hospitals achieving Level 3 had significantly higher reporting rates than hospitals at Level 1 or 2 (table 4), although there was no significant difference in reporting rates between hospitals at Levels 1 and 2.
Relationship between reporting rates and other safety and quality data
The numbers of reports to the NRLS were compared with the numbers of reports to other safety-related reporting systems. There were no significant correlations with the number of reports to either the MRSA bacteraemia surveillance system16 (correlation −0.05, 95% CI −0.22 to 0.11, p = 0.511) or the Medicines and Healthcare Products Regulatory Agency medical device reporting system17 (correlation 0.08, 95% CI −0.09 to 0.25, p = 0.355). However, it should be noted that the numbers of reports to these systems were low, with an average of 42 reports to the MRSA surveillance system per hospital per year (95% CI 36 to 47) and 15 reports to the Medicines and Healthcare Products Regulatory Agency (MHRA) medical device reporting system (95% CI 13 to 18).
The relationships between reporting rates to the NRLS and selected patient outcome measures were also assessed. No significant correlations were observed, either with Hospital Standardised Mortality Ratios22 (correlation 0.02, 95% CI −0.16 to 0.19, p = 0.865) or with three Patient Safety Indicators (see Methods) relating to (1) number of deaths in low-mortality Healthcare Resource Groups, (2) number of decubitus ulcers and (3) number of postoperative sepsis cases.
In addition, we explored the relationship between reporting rates and hospital characteristics. There was no significant difference overall between the mean reporting rates from different sizes and types of acute hospital as defined by the Healthcare Commission,20, for example large, medium, small, teaching or specialist. Neither were there any significant correlations between reporting rate and data on patient age, gender, length of stay, waiting list time, or proportions of emergency or day-case admissions.21
DISCUSSION
Patterns of reporting
Acute hospitals are reporting increasing numbers of incidents to the National Reporting and Learning System, even after 18 months’ connection to the system. It will be interesting to monitor whether rates continue to increase, particularly following the provision of more structured feedback to hospitals which began in May 2006. The use of bed days as a denominator for reporting rates seems to be an appropriate way of accounting for hospital size and activity, and we found that using consultant episodes gave very similar results (not shown). It is also interesting to note that, while slips, trips and falls still account for around 40% of incidents being reported,26 some hospitals appear to be reporting higher numbers of other incident types. Falls are traditionally reported by nursing staff, but our results suggest an improvement in willingness or ability of NHS staff to report other types of incident in addition.
Limitations of this research
This analysis was undertaken at an early stage in the lifetime of the NRLS, and it is worth noting that reporting rates may be affected by factors such as the technicalities of transferring data from local systems to the national system. The method used to calculate reporting rates took account of variations in when hospitals started to report to the NRLS, but may not adjust for this fully.
What this study adds
Several countries have begun to implement national reporting systems for patient safety incidents in healthcare, in order to facilitate large-scale analysis of incident data. The number of incidents reported by different hospitals varies widely. However, little is known about the relationship between incident reporting rates and other hospital-level data on safety and quality of care.
This study indicates that incident reporting rates from acute hospitals to a national reporting system increase with time from connection to the system, and that rates are positively correlated with measures of safety culture, higher reporting rates being associated with a more positive safety culture.
Relationship between reporting rate and safety culture
Since incident reports to a national system are a relatively new data source, contextual analysis alongside other data is critical for interpretation. The significant correlations between reporting rates and staff survey responses over two consecutive years (2004 and 2005) suggest that staff perceptions of the culture of safety and reporting within their hospital influence the actual number of reports being made. There was also a correlation between high reporting rates and the hospitals scoring highest in the NHS Litigation Authority risk-management assessment. The positive association of actual reporting rates with independent data on safety culture is an important finding and supports the view that, currently, higher reporting rates indicate safer organisations.
The apparent lack of any relationship with Hospital Standardised Mortality Ratios and Patient Safety Indicators may reflect the difficulty in demonstrating the link between safe, good quality care and patient outcomes.27 The lack of correlation with reporting rates to other reporting systems (such as the MHRA medical device reporting system and the MRSA bacteraemia reporting system) is likely to be due to the relatively low numbers of reports to these systems, or to other factors such as the type of hospital and severity of casemix. It should also be borne in mind that while measures of safety are often collected at hospital level, both the reporting rate and the safety culture have been shown to vary widely between different departments within a single hospital, and also between different sectors of staff.101128
Implications
Our findings suggest that higher reporting rates may be related to a more supportive culture of safety and reporting, as indicated by the relationship between reporting rates and data from the NHS Staff Survey and the NHS Litigation Authority. Reporting rates also appear to be improving over time across acute hospitals in England. The NPSA is now providing hospitals with regular feedback reports to allow hospitals to benchmark data in comparison with other similar hospitals, as part of a strategy to improve the quantity and quality of data reported. This analysis has been undertaken using nationally available data sources at the hospital level. However, individual hospitals are likely to have access to additional data sources, which will aid the interpretation and analysis of NRLS reporting rates.
Hospital reporting rates are not published widely or used directly as measures of compliance with healthcare standards. On the basis of our analysis, and in the context of making data available to support a choice of care providers, we suggest that high reporting rates may be indicators of a positive safety culture, rather than markers of less safe care. It might also be that in an increasingly pluralistic health economy where patient safety will eventually be a key driver, UK hospitals might wish to use high reporting rates as one of their markers of success in the creation of a safer healthcare environment.
Acknowledgments
We wish to thank P Bain and the other NPSA Patient Safety Managers who assisted with the study, and the MHRA for providing data.
Footnotes
See Editorial, p 2
Funding: Funding for the study was provided by the National Patient Safety Agency to the University of Sheffield.
Competing interests: SS and RT were responsible for commissioning this work on behalf of the National Patient Safety Agency.
AH wrote the research proposal, directed the study and contributed to analysis and writing; TY undertook much of the analysis and contributed to the writing; KC managed the research process, undertook some analysis and contributed to the writing; AM undertook the qualitative evaluation and contributed to the findings; JK contributed to the design and analysis; SS and RT proposed the project and contributed to design, writing and interpretation.
The National Patient Safety Agency “National Learning and Reporting System” (NRLS): more information on the NRLS, including data on types of incidents and severity, is available at: http://www.npsa.uk/health/resources/NRLSdata.
Linked Articles
- Quality lines
- Editorial