Article Text

Abstract
Risk-adjustment schemes are used to monitor hospital performance, on the assumption that excess mortality not explained by case mix is largely attributable to suboptimal care. We have developed a model to estimate the proportion of the variation in standardised mortality ratios (SMRs) that can be accounted for by variation in preventable mortality. The model was populated with values from the literature to estimate a predictive value of the SMR in this context—specifically the proportion of those hospitals with SMRs among the highest 2.5% that fall among the worst 2.5% for preventable mortality. The extent to which SMRs reflect preventable mortality rates is highly sensitive to the proportion of deaths that are preventable. If 6% of hospital deaths are preventable (as suggested by the literature), the predictive value of the SMR can be no greater than 9%. This value could rise to 30%, if 15% of deaths are preventable. The model offers a ‘reality check’ for case mix adjustment schemes designed to isolate the preventable component of any outcome rate.
- Mortality (standardized mortality ratios)
- Hospital medicine
- Quality improvement
This is an open-access article distributed under the terms of the Creative Commons Attribution Non-commercial License, which permits use, distribution, and reproduction in any medium, provided the original work is properly cited, the use is non commercial and is otherwise in compliance with the license. See: http://creativecommons.org/licenses/by-nc/3.0/ and http://creativecommons.org/licenses/by-nc/3.0/legalcode
Statistics from Altmetric.com
Introduction
Hospital mortality rates are widely used as a measure of quality in developed countries. The Health Care Financing Administration (HCFA) released risk-adjusted mortality data, in the form of standardised mortality ratios (SMRs), on all Medicare patients admitted to hospitals in the USA in 1986.1 After years of criticism,2–7 and attempts to improve the estimates,8–11 HCFA abandoned the effort and for a while hospital mortality data fell into disuse as a way to assess quality of care, outside of a single high-volume surgical procedure—coronary bypass surgery. However, there has been a renewal of interest and a dramatic increase in the number of North American hospitals publishing mortality data.12–16 In England, adjusted mortality statistics for NHS hospitals have been published since 2001 by the Dr Foster organisation,16 ,17 and the Department of Health has recently sponsored a similar approach—the Summary Hospital Mortality Index (SHMI).18 ,19 However, there is little new evidence to support such metrics as indicators of care quality, and further evidence questioning their validity.20 ,21 A recent paper concluded that an observed lack of agreement between different methods for calculating hospital-wide mortality rates may result from ‘fundamental flaws in the hypothesised association between hospital-wide mortality and quality of care’.22 Such a fundamental flaw would arise if the signal (preventable deaths) was small in relation to the noise (inevitable deaths). To further explore this possibility, we model the correlation between overall risk-adjusted mortality and mortality due to poor care.
Since a review of the relationship between mortality and quality of care found no empirical studies that directly report the relationship between SMRs and preventable mortality,21 we develop the argument from a number of plausible scenarios using a mathematical model for hospital mortality rates.
Derivation of the model
The model, though generic to any outcome, is explicated with respect to hospital mortality. For each hospital we assume that the rate of in-hospital mortality (M) can be partitioned into two components: where U denotes the mortality rate arising from deaths that could not have been avoided even under optimal care, and V denotes the mortality rate arising from deaths due to suboptimal care. The SMR is defined as the ratio of the actual number of deaths to the number of deaths expected after case mix is taken into account within a risk-adjustment scheme.
The proportion of the variance in SMRs attributable to preventable mortality—and the correlation between these quantities—depends on the contribution of preventable mortality to overall hospital mortality rates, and on the performance of the risk-adjustment scheme in eliminating variation due to differences in case mix.
The critical quantities are:
ξ: the average proportion of deaths that are preventable (the ‘preventability index’);
cV: the coefficient of variation (defined as SD÷mean) of the preventable mortality rate across hospitals;
cM: the coefficient of variation of the total in-hospital mortality rate;
R2: the proportion of the variance in total mortality rates explained by the risk-adjustment process;
Q: the correlation coefficient between the hospital SMR and the preventable mortality rate.
The performance of the SMR as a proxy for preventable mortality is governed by the numerical value of Q, and Q2 can be interpreted as the proportion of the variation in SMRs attributable to preventable mortality. In the online appendix an upper bound for Q is derived under two assumptions. The first of these deals with the possibility that a high rate of natural (unavoidable) death (U) in a hospital might go hand in hand with a high rate of preventable death (V). In practice, the presence of such positive correlation is entirely plausible since patients at high intrinsic mortality risk are also those for whom medical error is likely to have the most catastrophic consequences. As stated, the assumption (A1) implies that all such correlation between U and V can be accounted for in terms of case mix factors that reflect that intrinsic risk. The second assumption is concerned with the variation in mortality rates among hospitals with identical case mixes. The simplest version of the assumption (A2) says that such variation, as measured by the statistical variance, is the same whatever the case mix happens to be. As demonstrated in the online supplementary appendix, this leads unequivocally to the bound on Q used throughout this paper.
It follows that Q2 will not exceed: 1This result enables us to explore the conditions under which SMRs may provide a useful indication of preventable mortality.
Assumption A2 may be a sensible first approximation, but it is open to question as an exact description of reality. Put simply, there is more scope for variability in rates at case mixes when the mean rate is high than at case mixes when it is low. For this reason an alternative assumption (A2′) has been entertained, which posits a proportional relationship between the variance and the square of the case mix-specific mean. (This could arise if case mix differences impact on the relative mortality risk between hospitals.) Under A2′ there may be a modest inflation in the bound for Q, leading to an estimated increase of up to 5% (or 10% for Q2) in the base case described below (see online supplementary appendix). Such increases are not large enough to disturb the general conclusions of the paper.
Populating the model
The coefficient of variation of the overall mortality rate (cM) for 143 Acute Hospital Trusts in England in 2007/8 was 0.19;23 here a base case value for cM of 0.2 has been assumed.
In the SHMI scheme proposed for the NHS, the proportion of the variance explained by risk adjustment has been estimated as 81%;18 a value of R2=0.8 has therefore been assumed.
There appears to be no published study describing the variation in preventable death rates across hospitals. However, the variance of the between-hospital component of preventable adverse events is given as 0.15 by Zegers et al.24 We used this figure, together with information in their paper, to compute an approximate between-hospital SD of 0.42 for the logarithm of the rate of such events. This roughly corresponds to a coefficient of variation on the natural scale and informs our base case choice for cV of 0.4 which, as it happens, is exactly twice the base case for cM.
Studies of hospital deaths describe the proportion of deaths that may have been caused by clinical error (often at low probability),25–27 rather than the proportion of deaths that were preventable. An exception is the direct estimate (ξ=6%; 95% CI 3.4% to 8.6%) given by Hayward and Hofer and used here.28
SMRS as a proxy for rates of preventable mortality
The expression (1) imposes a severe constraint on the correlation between hospital SMRs and preventable mortality rates when the parameter values described above are used. For example, if 6% of deaths are preventable (as estimated by Hayward and Hofer), and base case assumptions are made (cM=0.2, cV=0.4, R2=0.8), it follows that Q2 cannot exceed: (or about 0.079 if the alternative assumption A2′ is preferred). Hence it seems that preventable mortality can account for no more than 8% of the variation in SMRs. This leaves very little scope for risk-adjusted mortality to function as an effective proxy for quality of care.
The point is reinforced if the SMR is treated as a formal diagnostic test for high rates of preventable mortality. Suppose that a warning is triggered if the SMR for a hospital places it among the worst 2.5% of all hospitals. This criterion corresponds to a ‘2-sigma’ action limit for the SMR. The diagnostic performance of this test depends on the value of Q2. The positive predictive value (PPV) of such a warning for identifying a hospital with high preventable mortality will be very low indeed if Q2<0.08, as suggested above. For instance, the PPV for identifying a hospital with a preventable mortality rate among the worst 2.5% of hospitals would be no more than 0.09 (ie, 9%). The same applies to the true positive rate (TPR) of the action limit for correctly detecting high preventable mortality. In fact the TPR equals the PPV here because the same fraction (2.5%) has been used to define the action limit and to specify the notion of high preventable mortality. Based on these numbers, at least 10 warnings out of 11 would be false alarms, and at least 10 out of 11 poorly performing hospitals would escape attention.
At higher levels of the preventability index (ξ) the bound on Q2 in expression (1) becomes less stringent, and effective monitoring using the SMR will be correspondingly more feasible. The effect is illustrated in figure 1, which shows how an increase in ξ translates into potential for an improved PPV (and TPR). Nevertheless, it appears that worthwhile PPV (or TPR) values can be attained only at values of ξ well in excess of what is supported by empirical studies. For example, a PPV of 0.3 would require that more than 15% of deaths are preventable (ξ>0.15).

Diagnostic performance of the standardised mortality ratio (2-sigma upper limit) to detect a hospital among the worst 2.5% for preventable deaths. The curve shows the dependency of the upper bound for positive predictive value (PPV) (or true positive rate (TPR)) on the preventability index under a risk-adjustment scheme accounting for 80% of the variation between hospitals. The base case relationship cV = 2cM is assumed.
Departing from the base case: the realistic scope for SMRs
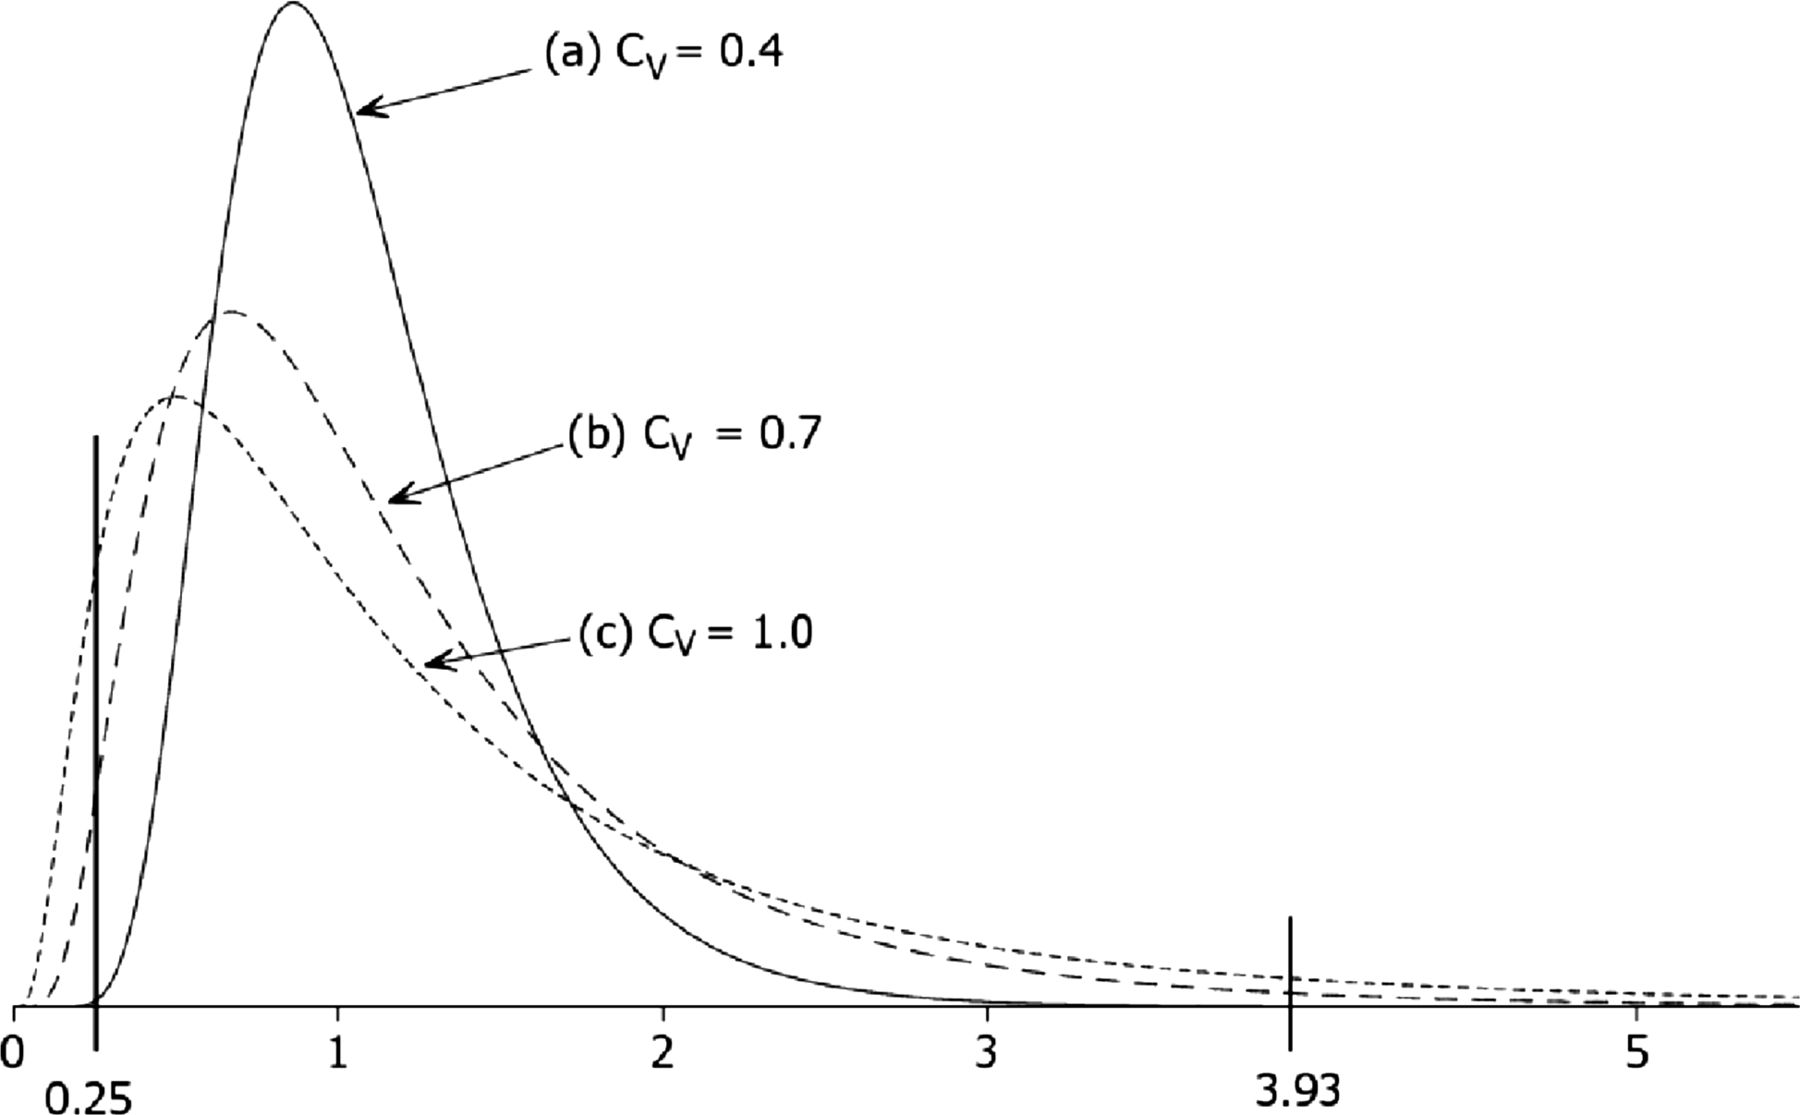
The argument so far has relied on a base case value for cV (=0.4) grounded in a study of preventable adverse events. Under this condition, preventable mortality rates vary fourfold between the 5th and 95th centiles (figure 2). A lower value of cV will tighten the constraint (1) on the correlation Q and thus reduce the scope for the SMR to diagnose poor care. This would be the case if, for example, the coefficient of variation was the same for preventable as for overall mortality. For the SMR to function as an effective proxy for preventable mortality rates, cV would need to be higher—indeed, much higher—than the base case value. For example, when ξ=0.06, as in Hayward and Hofer, a PPV of 0.3 could be achieved only if cV were increased from 0.4 to 1.0. This would mean that in a group of 20 randomly chosen hospitals the preventable death rate is, on average, more than 15 times higher in the worst hospital compared with the best one (figure 2). It is doubtful whether such wide discrepancies among similar institutions in the same healthcare system are plausible.

Three candidate distributions to describe variation among hospitals in rates of preventable mortality. The distributions are scaled to unit median and a log-normal model is assumed. Under the base case (cV=0.4) the hospital in the 95th centile would have about four times the preventable mortality rate of the hospital at the 5th centile. Under the most dispersed distribution (cV=1.0) the ratio between the 5th and 95th centiles (ie, 0.25 and 3.93) is more than 15, an implausibly large range across a random sample of 20 hospitals.
Satisfactory diagnostic performance could perhaps be achieved if both ξ and cV were to exceed their base case values, but by smaller amounts. For example, case (b) in figure 2 envisages a value of ξ (=8.6%) at the upper confidence limit in Hayward and Hofer.28 Then cV need be no more than 0.7 (case (b)) to achieve the same effect on the upper bound for Q2 as in case (c). Here preventable mortality rates still would need to differ by an arguably implausible factor of 8.0 between the 95th and 5th centiles.
Discussion
The results indicate that worthwhile correlations between case-mix adjusted SMRs and rates of preventable mortality are not attainable unless rates of preventable mortality are either (a) much higher than current estimates suggest, or (b) implausibly variable between different hospitals. It can be argued that specificity is not crucial to the performance of SMRs, since they are used as a screen for hospitals requiring further investigation, not as a diagnostic trigger for sanction. However, there is always a trade-off between sensitivity and specificity even for screening tests. In the case of SMRs, high false positives waste resources, stigmatise hospitals, and lead to gaming;29 ,30 while false negatives provide false reassurance, thereby deflecting attention away from quality issues across the whole healthcare system.31 Until risk adjustment can explain much larger proportions of the variance in mortality it is unsafe to use high SMRs to identify poor quality of care in any particular hospital, as has been done recently for some English hospitals.29 ,30
Aside from quality of care, possible sources of variation in hospital SMRs include: differences in discharge policies leading to variations in underlying mortality rates; differences in recording practices for primary diagnoses or comorbidities;20 sampling fluctuations in observed mortality rates; and failures of the risk adjustment scheme to adequately account for patient differences. However, a full discussion is beyond the scope of this paper.
One message from our study is that the diagnostic value of institution-level outcome data is critically dependent on the preventability index (ξ) as demonstrated in figure 1. In the base case (ξ=6%), PPVs are very low, although they start to climb steeply once ξ exceeds about 15%. Most of the relevant literature provides an estimate of the proportion of deaths for which a potentially preventable factor was present, rather than an estimate of the proportion of deaths that were in fact preventable. For example, Zegers et al32 found an error that may have been causal in 4% of deaths, while Hogan et al33 found such a factor that was causative on the balance of probabilities in 5.2% of deaths. Only Hayward and Hofer have attempted to measure the critical quality—the proportion of deaths that were preventable.28 More research into this issue is urgently needed. The model demonstrates that the predictive value of SMRs is also highly sensitive to the extent to which preventability varies across hospitals. An indirect estimate suggests a coefficient of variation in the rate of preventable deaths in the region of 40% (cV=0.4), consistent with a fourfold variation in rates across a representative sample of hospitals. However, there appear to be no direct estimates of this quantity in the literature. It may even be that our estimate is too high for a mortality measure in which eclectic performance across individuals and departments is aggregated at the hospital level. In such circumstances variation in the performance of individual clinical units may be diluted when these are combined together.
Other things being equal, standardised outcome rates will discriminate well for specific conditions in which preventability rates are high (eg, pressure ulcers, maternal deaths, deaths following elective surgery).23 ,34 ,35 Moreover, the variance-dilution effect will be absent when performance is measured at the level of the individual clinical unit. For these reasons standardised mortality rates are likely to be more reliable as a reflection of preventable mortality rates when the unit of comparison is relatively discrete (eg, clinical specialities) than when it is a consolidated measure across separate entities (eg, hospital-wide outcome rate).
When the preventability index is low, as it is for hospital mortality and many other outcomes in healthcare, it may be necessary to fall back on direct measurement of process and outcome by examining individual cases in detail—for example, by case-note review. Currently, this method is expensive, though it may become easier as sophisticated electronic records become widespread. It is also subject to classification errors (eg, judgment of the preventability of deaths varies by case reviewers). Yet it may remain the only viable option for measuring preventable mortality rates unless there are further improvements in risk-adjustment technology.
What this study adds
-
Hospital standardised mortality ratios (SMRs) are markers of poor care only to the extent that they correlate with preventable mortality rates.
-
A mathematical model populated by empirical estimates for critical parameters suggests that this correlation is low.
-
If preventable deaths make up less than 15% of all deaths, then SMRs are poor diagnostic tests for suboptimal care.
Acknowledgments
We thank Michael Langman, FRCP, FFPM, FMedSci, Yen-fu Chen, PhD and Semira Manaseki-Holland, PhD (University of Birmingham) for helpful comments.
References
Supplementary materials
Supplementary Data
This web only file has been produced by the BMJ Publishing Group from an electronic file supplied by the author(s) and has not been edited for content.
Files in this Data Supplement:
- Data supplement 1 - Online appendix
Footnotes
-
Contributors RJL conceived the idea for the paper and drafted the initial core manuscript; AJG derived the mathematical argument (with input from JW) and drafted the Methods and Results sections; AJG, TPH, JW, PJC, JPN and MAM contributed text and critically reviewed and commented on the document. RJL is the guarantor.
-
Funding AJG, JW, PJC, RJL acknowledge financial support for the submitted work from the National Institute for Health Research (NIHR) Collaborations for Leadership in Applied Health Research and Care (CLAHRC) for Birmingham and Black Country; the West Midlands Quality Institute; and the EPSRC Multidisciplinary Assessment of Technology Centre for Healthcare (MATCH) programme (EPSRC grant GR/S29874/01).
-
Competing interests All authors have completed the unified competing interest form at http://www.icmje.org/coi_disclosure.pdf (available on request from the corresponding author) and declare: no support from any organisation for the submitted work; no financial relationships with any organisations that might have an interest in the submitted work in the previous 3 years, no other relationships or activities that could appear to have influenced the submitted work.
-
Provenance and peer review The corresponding author (RJL) has been involved in statistical aspects of SMRs and the conduct of individual case note review. This prompted the idea that a mathematical model could be constructed to link preventable deaths revealed through detailed scrutiny of individual cases and overall death rates used to compare hospitals statistically. He discussed this idea with his more algebraically accomplished coauthors, and together the argument was developed.