Article Text

Abstract
Objectives: To assess the impact of a closed-loop electronic prescribing, automated dispensing, barcode patient identification and electronic medication administration record (EMAR) system on prescribing and administration errors, confirmation of patient identity before administration, and staff time.
Design, setting and participants: Before-and-after study in a surgical ward of a teaching hospital, involving patients and staff of that ward.
Intervention: Closed-loop electronic prescribing, automated dispensing, barcode patient identification and EMAR system.
Main outcome measures: Percentage of new medication orders with a prescribing error, percentage of doses with medication administration errors (MAEs) and percentage given without checking patient identity. Time spent prescribing and providing a ward pharmacy service. Nursing time on medication tasks.
Results: Prescribing errors were identified in 3.8% of 2450 medication orders pre-intervention and 2.0% of 2353 orders afterwards (p<0.001; χ2 test). MAEs occurred in 7.0% of 1473 non-intravenous doses pre-intervention and 4.3% of 1139 afterwards (p = 0.005; χ2 test). Patient identity was not checked for 82.6% of 1344 doses pre-intervention and 18.9% of 1291 afterwards (p<0.001; χ2 test). Medical staff required 15 s to prescribe a regular inpatient drug pre-intervention and 39 s afterwards (p = 0.03; t test). Time spent providing a ward pharmacy service increased from 68 min to 98 min each weekday (p = 0.001; t test); 22% of drug charts were unavailable pre-intervention. Time per drug administration round decreased from 50 min to 40 min (p = 0.006; t test); nursing time on medication tasks outside of drug rounds increased from 21.1% to 28.7% (p = 0.006; χ2 test).
Conclusions: A closed-loop electronic prescribing, dispensing and barcode patient identification system reduced prescribing errors and MAEs, and increased confirmation of patient identity before administration. Time spent on medication-related tasks increased.
- EMAR, electronic medication administration record
- IV, intravenous
- MAE, medication administration error
- OE, opportunities for error
Statistics from Altmetric.com
- EMAR, electronic medication administration record
- IV, intravenous
- MAE, medication administration error
- OE, opportunities for error
It is widely believed that information technology will revolutionise prescribing, dispensing and administration of medication for hospital inpatients.1–3 Electronic prescribing is often promoted to reduce prescribing errors, and automated dispensing and barcode scanning are advocated to reduce medication administration errors (MAEs).1,4–7 Such systems are also expected to increase efficiency.3 However, most data demonstrating benefits originate from single-site studies in the USA,8,9,10,11,12 where systems of medication prescribing and supply are very different from the UK.
There have been a small number of UK studies on electronic prescribing, most of which have only one outcome measure13–19 rather than a range of perspectives.20 None have examined the impact of a “closed-loop” system that includes automated dispensing, barcode scanning to confirm patient identity and electronic medication administration records (EMARs). We have piloted such a system on one UK hospital ward. This paper presents key aspects of a comprehensive quantitative evaluation; a companion paper21 presents a qualitative evaluation. Our objectives were to assess the effect of the system on the prevalence, types and clinical significance of prescribing errors and MAEs, confirmation of patient identity before administration and staff time.
METHODS
Setting
The study was conducted in a 28-bed general surgery ward of a London teaching hospital, with a mean patient stay of 7 days and 24 admissions per week, 70% of whom were elective. Scheduled drug rounds took place four times each day with one round serving half of the ward. One nurse carried out most medication-related tasks on each half of the ward. The ward received a pharmacy service typical of that in UK hospitals, with a daily visit from the ward pharmacist on weekdays and a short visit on Saturdays. Before the intervention, medication orders were prescribed on paper drug charts, and medication was stored in two drug trolleys and stock cupboards. This study was approved by the Riverside Research Ethics Committee.
Intervention
The intervention (described in more detail in the appendix) comprised a closed-loop system incorporating electronic prescribing, ward-based automated dispensing, barcode patient identification and EMARs (ServeRx V.1:13: MDG Medical, Israel). The system went live in June 2003. Only intravenous (IV) infusions and oral anticoagulants remained on paper charts.
Study design
We used a before-and-after design, collecting data on all outcome measures 3–6 months before and 6–12 months after the intervention. Pre-intervention data on several outcome measures had to be collected simultaneously to complete data collection before implementation. Post-intervention data were collected for each outcome measure in turn.
Prescribing errors
The same ward pharmacist identified prescribing errors on the study ward during a 4-week period using established definitions,22 classification23 and methods.23 In addition, the principal investigator (BDF) checked for prescribing errors once a week to help identify any error that had not been documented by the ward pharmacist. We recorded whether or not errors were rectified before the patient received any doses, avoiding the first 2 months after a change of junior medical staff. The denominator was the estimated number of medication orders written during each study period. This estimate was based on counting the number of medication orders written for all patients for whom health records could be retrospectively retrieved, and then extrapolating to the total number of patients on the ward during the study period.23 The potential severity of the errors was assessed by five judges on a scale from 0 (no harm) to 10 (death) based on a method validated previously;24 the mean severity score was calculated for each error.
Medication administration errors and checking patient identity
Pharmacists observed a sample of 56 drug rounds (including nights and weekends) during a 2-week period using established methods.25,26 The denominator was the number of opportunities for error (OE), defined as all doses administered plus any doses omitted that we could classify as either correct or incorrect. Each IV dose potentially comprised two OEs, one for preparation and another for administration.26 An MAE was defined as any dose of medication that deviated from the patient’s current medication orders; timing and documentation errors were excluded. The potential severity of the MAEs identified was assessed by four judges.24
For each patient to whom medication was administered, we recorded whether or not their identity was checked.
Staff time
We observed doctors prescribing inpatient medication orders and calculated the mean time per medication order. The ward pharmacist self-reported the time taken to provide a clinical pharmacy service to the study ward each weekday for 4 weeks.
To assess nursing time, the time required to carry out each scheduled non-IV drug round was recorded during the MAE study. We then used activity sampling27 to evaluate the proportion of nursing time spent on medication-related activities in between scheduled drug rounds. Ten data collection periods, each of about 2 h, were selected both pre-intervention and post-intervention, on different days and shifts, during which a research pharmacist shadowed the nurse responsible for medication-related activities on one half of the ward. A signalling device (JD-7, Divilbiss electronics, Chanute, Kansas, USA) was used to identify 32 random time samples each hour when the nurse’s activity was recorded.
Sample size calculation and statistical analysis
The primary outcome measures were the prescribing error rate and MAE rate. To identify a reduction in the prescribing error rate from 2%23 to 1%, we required 2319 newly written medication orders in each phase of the study. To identify a reduction in MAEs from 5%28 to 2.5%, we required 906 OEs in each phase; we estimated that observation of 56 drug rounds would achieve this. Both calculations were based on two-sided tests using α of 0.05 and β of 0.2. Nominal data were compared using the χ2 test and continuous data by the unpaired t test; 95% confidence intervals (CI) were calculated for parametric differences.
RESULTS
Prescribing errors
Table 1 presents the medication orders written and prescribing errors recorded, and table 2 presents the types of error.
The prescribing error rate fell from 93 (3.8%) of 2450 medication orders to 48 (2.0%) of 2353 (95% CI −0.9% to −2.7%), with no change in their mean clinical severity. Table 3 gives examples. More errors were resolved before the patient received any doses (48% pre-intervention; 67% post-intervention), although not statistically significant.
MAEs and checking patient identity
We observed 56 drug rounds (1644 OEs) pre-intervention, and 55 (1178 OE) afterwards. MAEs fell from 141 pre-intervention (8.6%) to 53 afterwards (4.4%), a difference of −4.2% (95% CI −2.4% to −6.0%; p = 0.0003). Table 3 gives examples. MAE rates were highest for IV doses, mainly involving excessively fast administration of IV bolus doses. Fewer IV OE were observed post-intervention (171 pre-intervention and 39 post-intervention), since EMARs allow one nurse to prepare IV medication while another administers oral medication. Since this change in working in practice biased the results, we calculated the MAE rate for non-IV doses. This fell from 7.0% pre-intervention to 4.3% post-intervention (95% CI −0.9% to −4.5%; p = 0.005). Table 4 presents types of MAE; three of five wrong dose MAEs post-intervention involved medication stored outside the automated cabinet such as salbutamol nebules. The post-intervention wrong route errors were paracetamol given orally when the rectal route was prescribed and vice versa. The mean severity score for all MAEs identified pre-intervention was 2.7; post-intervention it was 2.5 (p = 0.39). Patient identity was not checked before administration for 1110 (82.6%) of 1344 doses pre-intervention and 244 (18.9%) of 1291 afterwards (p < 0.001); a difference of 63.7% (95% CI 60.8% to 66.6%).
Staff time
We timed the prescribing of 32 regular inpatient medication orders pre-intervention and 15 afterwards. Prescribing took a mean of 15 s per medication order pre-intervention and 39 s post-intervention (p = 0.03), a difference of 24 s (95% CI 3 to 45).
The time taken to provide a weekday ward pharmacy service to the study ward rose from a mean of 68–98 min each day (p = 0.001); this included additional screening of medication orders from the dispensary-based terminal each afternoon. Pre-intervention, 78% of patients’ drug charts were available each day (mean time per chart 3 min, 7 s). Post-intervention, all records could be accessed (mean time per chart 3 min 30 s).
Table 5 shows the results relating to nursing time. Drug rounds were quicker, but a higher percentage of time was spent on medication-related tasks in between drug rounds (an increase of 7.6%; 95% CI 2.4% to 12.8%). This included scheduling newly prescribed medication for the appropriate drug rounds and administering the medication prescribed when required.
DISCUSSION
The intervention almost halved prescribing and administration errors, dramatically increased the checking of patient identity, and may have resulted in more prescribing errors being corrected before the patient received any doses. However, these gains were achieved at the cost of an increase in staff time on medication-related tasks.
Impact on medication safety
The intervention reduced prescribing errors by 47%, from 3.8% to 2.0%. An absolute reduction of 1.8% is in line with the 1.9% reduction (from 6.7% to 4.8%) in an UK critical care study,19 and supports previous US study9,10,12 data showing that computerisation can reduce prescribing errors. A further reduction may be possible with additional decision support. Our baseline figure of 3.8% was higher than the 1.5% reported previously across a range of wards using the same definitions and similar methods.23 This may be partly accounted for by the additional check by the principal investigator, who recorded more than a third of the errors in the present study.
The intervention reduced non-IV MAEs by 39%, predominantly reducing wrong dose and omission errors. Our baseline non-IV figure of 7.0% is in line with previous UK data.13,28–34 The improvement is likely to be due to the design of the automated dispensing system and trolley; instead of a drug trolley containing many different drugs, strengths and formulations, the system gives nursing staff access only to the product prescribed. EMARs also clearly indicate doses due. Electronic prescribing alone has not been shown to reduce MAEs in the UK.13
The system increased the percentage of doses for which the patient’s identity was checked before administration. However, full compliance was not achieved because of informal practices such as sticking barcodes to patients’ furniture, which were scanned instead of the patient’s wristband.
Impact on staff time
The intervention increased pharmacy and medical staff time. Nursing time spent on drug rounds decreased, which allowed the staff more flexibility in planning their time. This was despite increasing the percentage of patients whose identities were checked. More time was required for other tasks between drug rounds. The increase in pharmacist time may be partly due to more patients’ medication charts being seen each day, as they were no longer unavailable when patients were in theatre or having investigations, and partly due to the time required to move between different screens to approve medication orders or to see a treatment overview. Our sample size for prescribing times was small, but the results show that prescribing using the computer took more time than on a paper chart. The only previous UK study to explore the impact of electronic prescribing on the time taken to prescribe included only one medication order pre-intervention and post-intervention.14 A systematic review has suggested that electronic ordering generally reduces nursing time but increases physician time.35 We believe that software changes could reduce the time spent by all professions.
Strengths and weaknesses of the study
The strengths of our study are that, in contrast with previous work, we collected data on a range of outcome measures within a comprehensive evaluation framework.20 We also used validated methods for identifying and assessing prescribing and administration errors. This is the first study of a closed-loop system incorporating automated dispensing and EMARs. Unlike many US studies,9,10,12 it was a commercial system rather than one developed in-house.
The main weakness of this study is that generalisability from a one-ward study, of one version of a product at one point in time, is limited. There are also practical difficulties in evaluating a system being piloted on only one ward, which could lead to the system appearing less effective than it could be; the associated qualitative study (unpublished data) explores these issues. Our pre-intervention system used traditional drug trolleys rather than individual patient medicine lockers as now used in many UK hospitals. However, we were using other aspects of a one-stop dispensing system;36 a previous study suggests that individual patient lockers do not reduce MAEs,28 so the lack of these is unlikely to have affected our results. Finally, in the prescribing error study, fewer medication orders were written per patient in the post-intervention period. This is likely to be due to a slight increase in patient turnover over the time period of the study; the total number of medication orders written was similar.
Implications
Our study, and a previous UK study of electronic prescribing in intensive care,19 suggest that when electronic prescribing is first implemented in hospitals it will stop two errors in every 100 prescriptions written. However, as our associated paper shows,21 this should not be seen as the effectiveness of electronic prescribing, but as a starting point from which it can be further developed. The methodology used in these two papers means that areas for development have been systematically identified together with reproducible methods with which to measure progress.
It may be that the errors avoided are those that pharmacists usually correct, but electronic prescribing ensures that they are always correct before the first dose is due and has the potential to allow pharmacists to concentrate on other aspects of the usage of medicines. However, electronic prescribing is expensive and economic analyses of this and other types of interventions are needed. It will be important to estimate the harm avoided by such systems, which may be disproportional to their reduction in errors.
The combination of electronic prescribing with automated dispensing, bar coded patient identification and EMARs is workable and would significantly reduce prescribing and administration errors.
APPENDIX A: DESCRIPTION OF THE SYSTEM
The system comprised the following three elements.
Electronic prescribing, scheduling and administration software
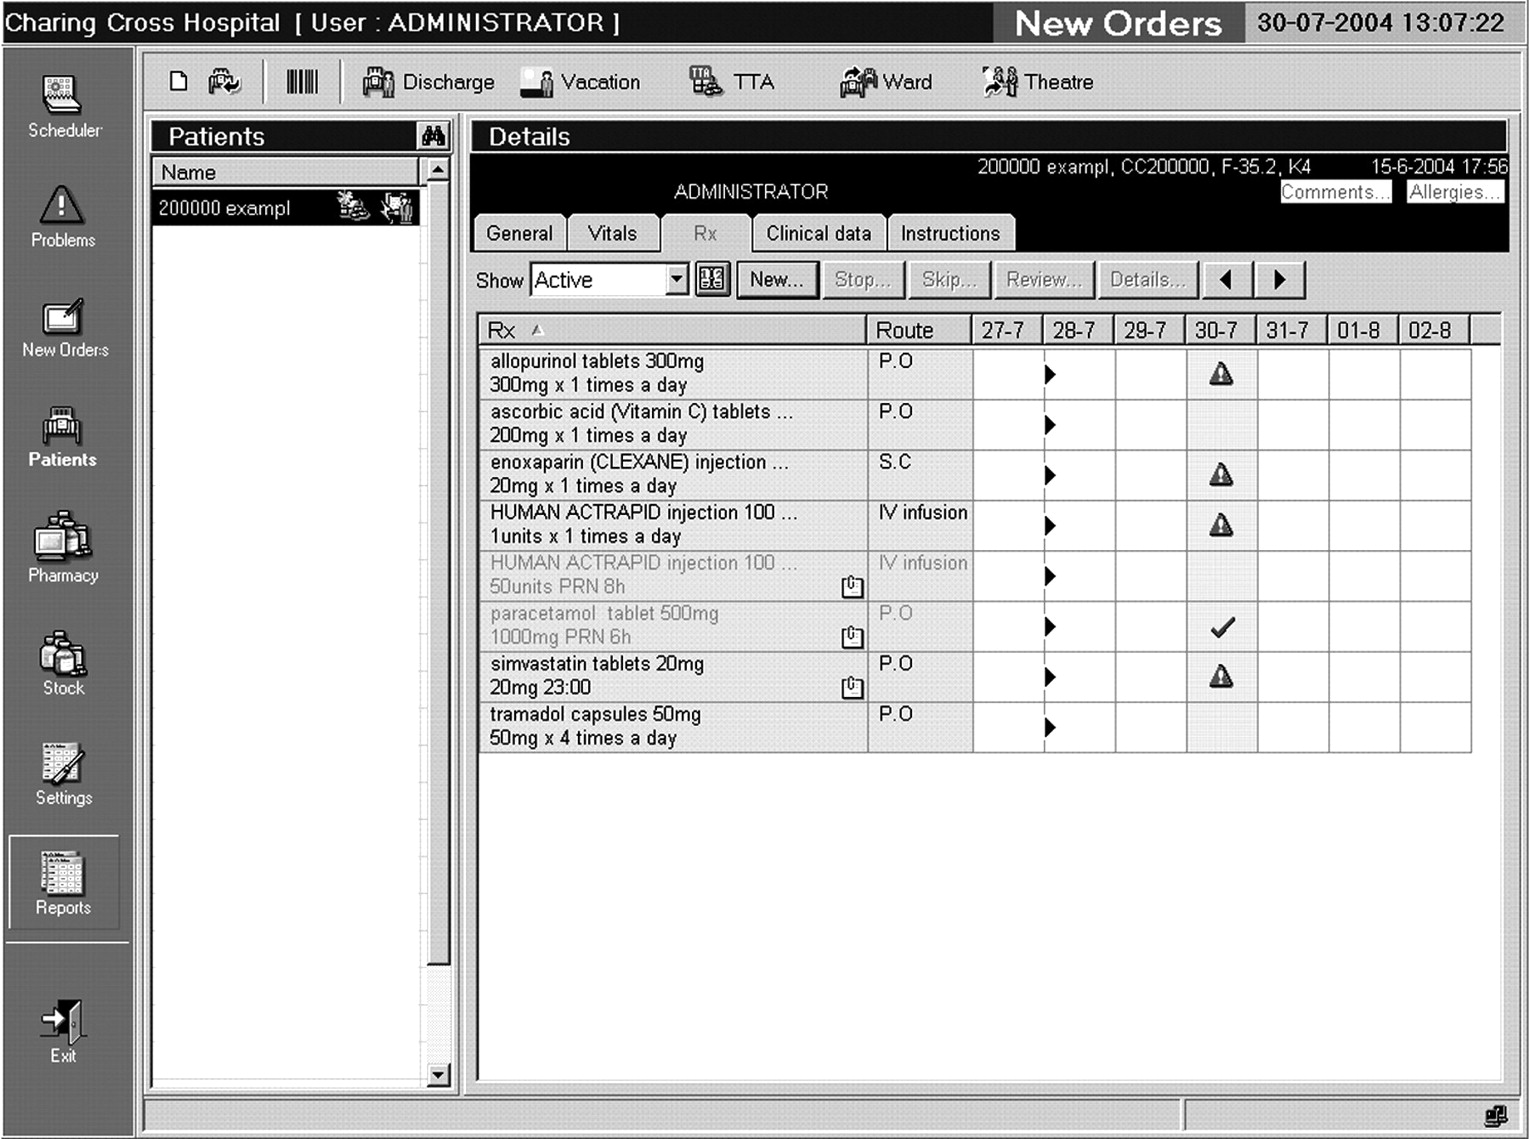
There were two prescribing terminals on the study ward, and one in the pharmacy department. There were also two hand-held tablet computers on the study ward, which could be taken from patient to patient and used to view, prescribe and discontinue medication orders. These had to be synchronised with the ward-based server via a docking station before and after use. The software was Windows based, and the patient medication screen was intended to resemble an inpatient drug chart (fig A1). When prescribing, a doctor could access pull-down lists of all drug products stocked on the ward, all drug products in the trust’s formulary and all products in the drug dictionary. Prescribing was by product (aspirin 75 mg soluble tablets) rather than by drug (aspirin). Default doses were suggested for most products. No other decision support was enabled. If the patient had any allergies entered, these were displayed on the prescribing screen. When patients were transferred from other wards, pharmacists were authorised to transcribe their existing medication orders onto the computer system.

Prescribing screen showing active medication orders. The triangles show doses that have not been administered; regular medication is shown in dark text and medication given when required in light text.
Once drugs had been prescribed, a nurse (or, less often, a pharmacist or doctor) scheduled the doses to specific drug round times and indicated the drug round at which the first dose was to be given.
Pharmacists checked and “approved” medication orders from a separate pharmacy screen, which highlighted unapproved medication orders. Medication orders did not have to be approved before they could be administered by nursing staff. At the approval stage, pharmacists could enter additional instructions relating to administration; further instructions could not be entered after orders had been approved.

Nurse selecting stock medication from drawer in automated cabinet. The patient-specific drawers can be seen below the open drawer, and the screen to the right. Photo published with nurse’s permission.
Ward-based automated dispensing
The majority of medication was stored in large automated cabinets; the doses required were transferred by nursing staff to an electronic drug trolley at each drug round. The automated cabinets, containing computer-controlled drawers and a touch-sensitive computer screen, were situated in the ward’s treatment room. Products that were ward stock were in product-specific drawers containing only that drug, dose and formulation, in original packs. Non-stock medication dispensed for individual patients was stored in patient-specific drawers, which could contain several products dispensed for that patient. The patient’s name was indicated on the drawer using a liquid crystal display. The computer screen indicated the patients for whom doses were due in the next 2 h. To prepare for a drug round, the nurse selected each patient using the touch-sensitive screen and was then presented with a list of the doses due. On selecting each dose, the relevant drawer in the cabinet opened (fig A2) so that the nurse could take the number of dosage forms required and place these in the electronic drug trolley.

One of the two electronic drug trolleys. One drawer is allocated to each patient for whom medication is due and their name shown on the liquid crystal display. The barcode scanner is on the top of the trolley.
To restock the cabinet, a pharmacy technician printed a list of products below the specified reorder level. Barcodes on each drug product were used to confirm the identity of the medication loaded into each drawer. Non-stock medication was ordered by nursing staff via the ward pharmacist.
Electronic drug trolleys
There were two electronic drug trolleys (fig A3), one for each half of the ward. Each contained 20 drawers and could be docked with the automated cabinet. When medication was being prepared for a drug round, only one drawer in the drug trolley opened at a time, and the patient’s name was indicated on the drawer’s liquid crystal display. When all medication for a given patient had been prepared, the system instructed the nurse to close that patient’s drawer in the drug trolley before medication for the next patient could be prepared. Once all medication had been prepared for a given drug round, the trolley could be disconnected and taken around the ward. The barcode on each patient’s wristband was scanned, which triggered the system to open that patient’s drawer in the trolley so that the medication could be administered. The nurse confirmed administration using a touch-sensitive screen on the trolley, and entered the reasons for any doses not given.
On completion of the drug round, details of all doses administered and reasons for any omission were uploaded to the main server once the trolley was docked.
Medication prescribed “to be given when required” was generally given separately outside the main drug rounds.
Medication orders written and prescribing errors identified
Prescribing errors presented according to the stage of the prescribing process
Examples of prescribing and administration errors identified
Medication administration errors identified
Nursing time spent on medication-related tasks each week
REFERENCES
Footnotes
-
Funding: The research was funded by MDG Medical and the Department of Health’s Patient Safety Research Programme.
-
Competing interests: The authors’ work was independent of MDG Medical.
-
The grant from MDG Medical was unrestricted and they did not contribute to study design, data collection, analysis or interpretation of the data, nor to report writing or the decision to submit for publication.