Article Text

Abstract
Objective: To systematically review the literature regarding how statistical process control—with control charts as a core tool—has been applied to healthcare quality improvement, and to examine the benefits, limitations, barriers and facilitating factors related to such application.
Data sources: Original articles found in relevant databases, including Web of Science and Medline, covering the period 1966 to June 2004.
Study selection: From 311 articles, 57 empirical studies, published between 1990 and 2004, met the inclusion criteria.
Methods: A standardised data abstraction form was used for extracting data relevant to the review questions, and the data were analysed thematically.
Results: Statistical process control was applied in a wide range of settings and specialties, at diverse levels of organisation and directly by patients, using 97 different variables. The review revealed 12 categories of benefits, 6 categories of limitations, 10 categories of barriers, and 23 factors that facilitate its application and all are fully referenced in this report. Statistical process control helped different actors manage change and improve healthcare processes. It also enabled patients with, for example asthma or diabetes mellitus, to manage their own health, and thus has therapeutic qualities. Its power hinges on correct and smart application, which is not necessarily a trivial task. This review catalogues 11 approaches to such smart application, including risk adjustment and data stratification.
Conclusion: Statistical process control is a versatile tool which can help diverse stakeholders to manage change in healthcare and improve patients’ health.
- MRSA, methicillin resistant Staphylococcus aureus
- PEFR, peak expiratory flow rate
- QI, quality improvement
- RCT, randomised controlled trial
- SPC, statistical process control
Statistics from Altmetric.com
- MRSA, methicillin resistant Staphylococcus aureus
- PEFR, peak expiratory flow rate
- QI, quality improvement
- RCT, randomised controlled trial
- SPC, statistical process control
Quality improvement (QI) practices represent a leading approach to the essential, and often challenging, task of managing organisational change.1 Statistical process control (SPC) is, in turn, a key approach to QI.2 SPC was developed in the 1920s by the physicist Walter Shewhart to improve industrial manufacturing. It migrated to healthcare, first in laboratory settings (eg, Fisher and Humphries3) and then into direct patient care applications, along with other approaches to QI. Before we report on our systematic review of the literature on how SPC has been applied to QI in healthcare, there is a need to define SPC and its role in QI.
“Statistical process control (SPC) is a philosophy, a strategy, and a set of methods for ongoing improvement of systems, processes, and outcomes. The SPC approach is based on learning through data and has its foundation in the theory of variation (understanding common and special causes). The SPC strategy incorporates the concepts of an analytic study, process thinking, prevention, stratification, stability, capability, and prediction. SPC incorporates measurement, data collection methods, and planned experimentation. Graphical methods, such as Shewhart charts (more commonly called ‘control charts’), run charts, frequency plots, histograms, Pareto analysis, scatter diagrams, and flow diagrams are the primary tools used in SPC.” (Carey4, p xviii)
The terms “statistical process control” and “statistical quality control” are often used interchangeably,5 although sometimes the latter is used to describe a broader organisational approach to quality management that evolved into the concept of total quality management.6
One of the tenets of QI is that to improve healthcare performance we must change our way of working.7 But change does not always mean improvement. To discriminate between changes that yield improvement and those that do not, relevant aspects of performance need to be measured. In addition, measurement guides decisions about where improvement efforts should be focused in the first place. SPC may facilitate such decision making. Control charts, central to SPC, are used to visualise and analyse the performance of a process—including biological processes such as blood pressure homoeostasis or organisational processes such as patient care in a hospital—over time, sometimes in real time. Statistically derived decision rules help users to determine whether the performance of a process is stable and predictable or whether there is variation in the performance that makes the process unstable and unpredictable. One source of such variation can be a successful intervention aimed at improvement that changes performance for the better. If the improvement is maintained, the process will stabilise again at its new level of performance. All of this can be easily determined by using SPC.4
Although there are theoretical propositions that SPC can facilitate decision making and QI in healthcare (eg, Berwick,8 Benneyan et al,9 Plsek10) it is not clear what empirical support there is in the literature for such a position11:
“The techniques of statistical process control, which have proved to be invaluable in other settings, appear not to have realised their potential in health care. ... Is this because they are, as yet, rarely used in this way in health care? Is it because they are unsuccessful when used in this way and thus not published (publication bias)? Or is it that they are being successfully used but not by people who have the inclination to share their experience in academic journals?” (p 200)
The present systematic review aimed to answer these questions. We examined the literature for how and where SPC has been applied in QI of clinical/patient care processes and the benefits, limitations, barriers and facilitating factors related to such application.
MATERIALS AND METHODS
Drawing on the principles and procedures for systematic review of QI interventions12 we searched for articles on the application of SPC in healthcare QI published between 1966 and June 2004 (see appendix A) in the following databases: Web of Science, Ovid Medline(R), EMBASE, CINAHL (Cumulative Index to Nursing and Allied Health Literature), PsycInfo, and the Centre for Reviews and Dissemination databases. We also included articles found by searching reference lists or from elsewhere which we were aware of, if they met our inclusion criteria: original empirical studies of SPC application in improvement of clinical/patient care processes in healthcare organisations, published in English. We excluded articles dealing with application of SPC in laboratory or technical processes (eg, film processing) and in surveillance/monitoring (unless they also contained empirical data about improvement efforts), as well as tutorials (unless they contained empirical case studies), letters, book reviews and dissertations.
We reviewed abstracts, when available, or else other information about the publication provided in the database (eg, publication type such as letters, book reviews or original articles). Articles that did not meet the inclusion criterion were excluded. We retrieved and read the full text of the remaining articles, again excluding the articles that did not meet the inclusion criterion.
We developed, pilot tested and modified a data abstraction form which we then used to consistently capture information of relevance to our review questions on reading the full text articles. The information recorded was: whether and how the article met the inclusion criterion; study objective(s); study design; whether the study empirically compared application of SPC with any other method for process data display and analysis; reported benefits, limitations, barriers and facilitating factors related to SPC; organisational setting; country where study was conducted; clinical specialty; unit of analysis; variables for SPC analysis; and other observations. Some questions in the form required a yes/no or brief response (eg, country where study was conducted) and others required answers in the form of direct quotes from the article or the a summary of the article written by the reviewer. Each article was read and data abstracted by one member of the review team (the coauthors of this review). Following this, all the data abstraction forms were reviewed by the first author, who solicited clarification and checked for any missing or incomplete data to ensure consistency in reporting across all articles reviewed. He also conducted the initial data synthesis, which was then reviewed by the entire team.
We determined the study design for each article and whether the investigators intended to test the utility of SPC application, alone or in combination with other interventions. In several articles, the study design or study objectives were not explicitly stated. Our determination of such intention in such cases was based on our reading of the full text papers.
Simple descriptive statistics—for example, the number of publications per year of publication or per country—were used to characterise the included studies. The qualitative nature of our research questions and of the abstracted data shaped our analysis and synthesis of findings regarding benefits, limitations, SPC variables, etc.13 The abstracted data was reviewed one question at a time and data from each article was classified into one or more thematic categories, each with a descriptive heading. Informed by our present understanding of QI and healthcare, we developed these categories as we reviewed the data, rather than using categories derived a priori from theory. For data that did not fit into an existing category, we developed a new one. Thus the categories emerged as we synthesised the data. We report the categorised data in tabular form, illustrated with examples, and give the references of all the source studies.
To strengthen our review through investigator triangulation,14 we sought feedback on an earlier version of this manuscript from two SPC experts: one was the most frequent coauthor in the included studies and the other was an expert on SPC application also in settings other than healthcare. Their comments helped us refine our data synthesis and distil our findings.
RESULTS
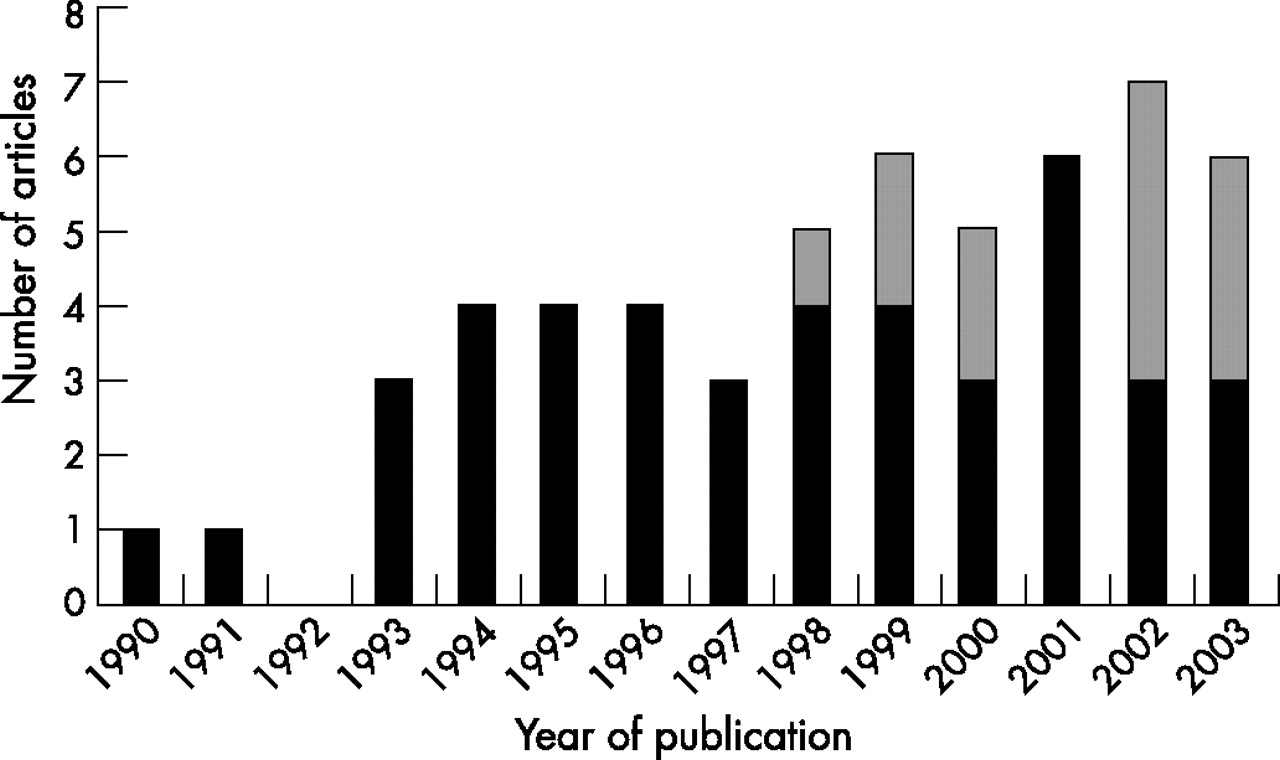
The database searches yielded 311 references. The initial review (abstracts etc.) yielded 100 articles which we read in full text form. Of these, 57 articles met the inclusion criteria and have been included in the review.15–71 To characterise the body of liferature, figure 1 shows the year of publication and whether the studies were conducted in USA or elsewhere (further specified below); table 1 gives the study designs and objectives—whether or not to test SPC utility.
Study design and objectives of the studies included in the systematic review*
The number of included articles by year of publication. (A total of 55 articles were published in 1990–2003; the two articles from 2004 are not included in this graph since the database searches were conducted in June 2004.) Black bars: studies conducted in the USA; grey bars: studies conducted outside the USA.
Most of the articles (45/57) concerned application of SPC in healthcare improvement in the USA.15–35,37–40,42,43,45,47,49–56,59,60,63,67–71 While the first US-based article was published in 1990, the non-US articles were published between 1998 and 2003: three articles were from the UK,61,62,66 three were from Switzerland,36,41,46 and one each were from Australia,58 Finland,65 France,57 Indonesia,44 Norway64 and Spain.48 The intention to test the utility of SPC is exemplified by a study aiming to reduce the rate of acquisition of methicillin-resistant Staphylococcus aureus (MRSA) on wards and units at Glasgow Royal Infirmary hospitals.61 Annotated control charts displaying data on MRSA acquisition were fed back monthly to medical staff, managers and hotel services. Sustained reductions in the rate of acquisition from the baseline, which could not otherwise be accounted for, started 2 months later. In contrast, investigators at a paediatric emergency department used SPC to demonstrate a decline in the rate of contamination following the introduction of a new approach to drawing blood for culture specimens,68 but the study had no intention to test the utility of SPC per se.
To characterise the content of the articles, we first present how and where SPC has been applied to healthcare QI. Tables 2–4 present the study settings (ie, hospital etc. where SPC was applied; table 2), the field of healthcare (ie, specialties or forms of care; table 3), and the units of analysis (table 4). Table 5 enlists the 97 distinct SPC variables that have been reported. Tables 6–9 convey our synthesis of the reported benefits, limitations, barriers and facilitating factors related to SPC application. For each category, we have given explanations or examples and references to the source articles.
How and where SPC was applied: study settings*
How and where SPC was applied: fields of healthcare*
How and where SPC was applied: units of analysis*
SPC variables*
Benefits of using SPC to improve clinical processes*
DISCUSSION
SPC has been applied to healthcare improvement in a wide range of settings and specialties, at diverse levels of organisations and directly by patients, using many types of variables (fig 1, tables 2–5). We found reports of substantial benefits of SPC application, as well as important limitations of, barriers to and factors that facilitate SPC application (tables 6–9). These findings indicate that SPC can indeed be a powerful and versatile tool for managing changes in healthcare through QI. Besides helping diverse stakeholders manage and improve healthcare processes, SPC can also help clinicians and patients understand and improve patients’ health when applied directly to health indicators such as PEFR in asthma or blood sugar concentrations in diabetes. In healthcare, the “study subject” can thus also be an active agent in the process, as when patients apply SPC to their own health. Several studies indicated the empowering effects this may have on patients.35,38,40,50 SPC application thus has therapeutic potential as it can help patients manage their own health. We agree with Alemi and Neuhauser70 that this potential merits further investigation.
Most of the included articles concerned application of SPC in healthcare improvement in the USA. Articles from other countries appeared only towards the end of the study period (fig 1). We have no explanation for this finding, but we speculate that it is related to differences between US and other healthcare systems with regard to QI awareness and implementation.73
Only 22 studies included in the review were intended to test the utility of SPC (table 1). Of the four controlled studies, only one included a control chart in the intervention (as a minor component which did not fully exploit the features of SPC). In 35 articles we did not find an intention to test the utility of SPC application. In those cases, SPC was applied for other reasons (ie, to evaluate the impact of other interventions). Even though many articles thus did not address the utility of SPC, all studies offered information—to varying degrees—relevant to our review’s question of how SPC has been applied to healthcare. The utility of SPC is reflected in benefits reported regarding SPC application (table 6).
SPC has been applied in over 20 specialties or fields of healthcare, at a wide range of levels (tables 3 and 4), suggesting that SPC has broad applicability in healthcare. The dominance of anaesthesia and intensive care can be explained in large part by the fact that many studies included their services in conjunction with other specialties. This reflects the way in which anaesthesia has a vital supporting role in many clinical care processes. The 97 SPC variables reported (table 5) demonstrate a diversity of situations in which SPC has been applied, ranging from process indicators of patients’ health to health outcomes and many aspects of healthcare processes and organisational performance. This indicates that SPC is a versatile QI tool.
The benefits of SPC application (table 6) mirror those given in books and tutorials on SPC (exemplified by the quote in the Introduction to this review). As noted in a report from a top-ranked healthcare system which has applied SPC widely:
“Among the most powerful quality management tools that IHC [Intermountain Health Care, USA] has applied is statistical process control, SPC. Most notable among those tools are control charts. Under optimal conditions, these graphical depictions of process performance allow participants to know what is happening within their processes as ‘real time’ data enable them to make appropriate decisions. The capability of truly understanding processes and variation in a timely manner has resulted in the most dramatic, immediate, and ongoing improvements of any management technique applied at IHC.” (Shaha,26 p 22)
The limitations of SPC application (table 7) identified by this review are important, and yet perhaps less emphasised than the benefits in books and tutorials on SPC. SPC cannot solve all problems and must be applied wisely. There are many opportunities to “go wrong”, as illustrated by the case where incorrect application was highlighted by other authors (limitation number 5 in table 7). In several cases, our own understanding of SPC suggested that investigators had not used it correctly or fully (eg, standard decision rules to detect special causes were not applied to identify process changes). In the worst case scenario, incorrect application of SPC could lead to erroneous conclusions about process performance and waste time, effort and spirit and even contribute to patient harm. In the more authoritative studies we reviewed, co-investigators included experts in industrial engineering or statistics or authors who otherwise had developed considerable expertise in SPC methodology. On the basis of these observations, we conclude that although SPC charts may be easy to use even for patients, clinicians or managers without extensive SPC training, they may not be equally simple to construct correctly. To apply SPC is, paradoxically, both simple and difficult at the same time. Its power hinges on correct and smart application, which is not necessarily a trivial task. The key, then, is to develop or recruit the expertise necessary to use SPC correctly and fully and to make SPC easy for non-experts to use, before using it widely.
Limitations of SPC application in improvement of clinical processes*
Autocorrelation is another limitation of SPC highlighted by this review. Our review, and published books, offer limited advice on how to manage it:
“There is no single acceptable way of dealing with autocorrelation. Some would say simply to ignore it. [Others] would disagree and suggest various measures to deal with the phenomenon. One way is to avoid the autocorrelation by sampling less frequently. ... Others argue against plotting autocorrelated data on control charts and recommend that the data be plotted on a line chart (without any centerline or control limits).” (Carey,4 p 68)
Just over a quarter of the articles reported barriers to SPC application (table 8). The three broad divisions of barriers—people, data and chart construction, and IT—indicate where extra care should be taken when introducing SPC in a healthcare organisation. Ideas on how to manage the limitations of and barriers to SPC application can be found among the factors reported to facilitate SPC application (table 9). They deal with, and go beyond, the areas of barriers we found. We noted the prominence of learning and also of focusing on topics of interest to clinicians and patients. The 11 categories under the heading “Smart application of SPC can be helpful” contain valuable approaches that can be used to improve SPC application. Examples include risk adjustment51,52,71 and stratification30,37,59 to enable correct SPC analysis of data from heterogeneous populations of patients (or organisational units). Basic understanding of SPC must be taught to stakeholders and substantial skill and experience is required to set up successful SPC application. Experts, or facilitators, in healthcare organisations can help, as indicated in table 9, and as we have described for other QI methods.74
Barriers to SPC application*
Factors or conditions facilitating application of SPC*
We found more information on SPC benefits and facilitating factors than on limitations and barriers, and this may represent a form of publication bias, as indicated by the quote in the Introduction.11 We did not find any study that reported failed SPC application. We can speculate that there have been situations when SPC application failed, just as there must be many cases of successful SPC application that have not been reported in the literature. Studies of failed SPC application efforts, as well as studies designed to identify successful ways to apply SPC to manage change, would help inform future SPC application efforts. On the basis of this review, we agree with the argument that “medical quality improvement will not reach its full potential unless accurate and transparent reports of improvement work are published frequently and widely (p 319),”75 and also that the way forward is to strengthen QI research rather than to lower the bar for publication.76
Methodological considerations regarding the included studies
None of the studies we found was designed to evaluate the effectiveness quantitatively—that is, the magnitude of benefits—of SPC application. This would have required other study designs such as cluster randomised trials or quasi-experimental studies.12 Although the “methods of evaluating complex interventions such as quality improvement interventions are less well described [than those to evaluate less complex interventions such as drugs]”, Eccles et al argue that the “general principle underlying the choice of evaluative design is ... simple—those conducting such evaluations should use the most robust design possible to minimise bias and maximise generalisability. [The] design and conduct of quantitative evaluative studies should build upon the findings of other quality improvement research (p 47).”77 This review can provide such a foundation for future evaluative studies.
An important distinction is warranted here: we believe that SPC rests on a solid theoretical, statistical foundation and is a highly robust method for analysing process performance. The designs of the studies included in this systematic review were, however, not particularly robust with regard to evaluating the effectiveness of SPC application, and that was not their objective. This does not mean that SPC is not a useful tool for QI in healthcare, only that the studies reviewed here were more vulnerable to bias than more robust study designs, even if they do indicate many clear benefits of SPC application (table 6). Despite the studies not being designed to evaluate the effectiveness of SPC, many used SPC to effectively show the impact of QI or other change initiatives. In this way, SPC analysis can be just as powerful and robust as study designs often deemed superior, such as randomised controlled trials (RCTs).77 The key to this power is the statistical and practical ability to detect significant changes over time in process performance when applying SPC.9 On the basis of a theoretical comparison between control charts and RCTs, Solodky et al38 argue that control charts can complement RCTs, and sometimes even be preferable to RCTs, since they are so robust and enable replication—“the gold standard” for research quality—at much lower cost than do RCTs. These points have been further elaborated in subsequent work.78,79
A curious methodological wrinkle in our review is: can you evaluate the application of a method (eg, SPC) using that same method for the evaluation? Several of the included studies used SPC both as (part of) an intervention and as a method to evaluate the impact of that intervention. For example, Curran et al used annotated control charts to feed information on MRSA acquisition rates back to stakeholders and used these same control charts to show the effectiveness of the feedback programme.61
Relationship between monitoring and improvement
When SPC is applied for monitoring, rather than for managing change, the aims are different—for example, to detect even small but clinically important deviations in performance—as are the methodological challenges.80,81 This review focused on the latter. Thus although studies on SPC application for monitoring healthcare performance were excluded from this review, we recognise the importance of such monitoring. The demarcation between monitoring and improvement is not absolute. Indeed, there are important connections between measurement, monitoring and improvement, even if improvement does not follow automatically from indications of dissatisfactory performance. “To improve performance, organizations and individuals need the capability to control, improve, and design processes, and then to monitor the effects of this improvement work on the results. Measurement alone will not suffice (pp 1–35).”82
Monitoring performance by way of control charts has been suggested as a better approach to clinical governance in the British National Health Service. Through six case studies, Mohammed et al demonstrate how control chart monitoring of performance can distinguish normal performance from performance that is either substandard or better than usual care. “These case studies illustrate an important role for Shewhart’s approach to understanding and reducing variation. They demonstrate the simplicity and power of control charts at guiding their users towards appropriate action for improvement (p 466).”83
Comments on the review methodology
No search strategy is perfect, and we may well have missed some studies where SPC was applied to healthcare QI. There are no SPC specific keywords (eg, Medical Subject Headings, MeSH) so we had to rely on text words. Studies not containing our search terms in the title or abstract could still be of potential interest although presumably we found most of the articles where SPC application was a central element. We believe the risk that we systematically missed relevant studies to be small. Therefore, our findings would probably not have changed much due to such studies that we might have missed.
The review draws on our reading, interpretation and selection of predominantly qualitative data—in the form of text and figures—in the included articles to answer the questions in our data abstraction form. The questions we addressed, the answers we derived from the studies, and the ways we synthesised the findings are not the only ways to approach this dataset. Furthermore, each member of the review team brought different knowledge and experiences of relevance to the review, potentially challenging the reliability of our analysis. An attempt was made to reduce that risk by having one investigator read all data abstraction forms, and obtain clarifications or additional data from the original articles when needed. That investigator also conducted the initial data synthesis, which was then reviewed by the entire team and the two outside experts. Although other interpretations and syntheses of these data are possible, we believe that ours are plausible and hope they are useful.
The methods for reviewing studies based primarily on qualitative data in healthcare are less well developed than the more established methods for quantitative systematic reviews, and they are in a phase of development and diversification.13,84,85 Among the different methods for synthesising evidence, our approach is best characterised as an interpretive (rather than integrative) review applying thematic analysis—it “involves the identification of prominent or recurrent themes in the literature, and summarising the findings of different studies under thematic headings”.86 There is no gold standard for how to conduct reviews of primarily qualitative studies. Our response to this uncertainty has been to use the best ideas we could find, and to be explicit about our approach to allow readers to assess the findings and their provenance.
The main limitation of this review is the uncertainty regarding the methodological quality of many of the primary studies. Assessment of quality of qualitative studies is still under debate, and there is no consensus on whether at all, or, if so, how to conduct such assessments.84 We reviewed all the studies that satisfied our inclusion criteria and made no further quality assessment. Therefore our findings should be considered as tentative indications of benefits, limitations, etc to be corroborated, or rejected, by future research. The main strength of this review is our systematic and explicit approach to searching and including studies for review, and to data abstraction using a standardised form. It has helped generate an overview of how SPC has been applied to healthcare QI with both breadth and depth—similar to the benefits of thematic analysis reported by investigators reviewing young people’s views on health and health behaviour.87
In conclusion, this review indicates how SPC has been applied to healthcare QI with substantial benefits to diverse stakeholders. Although there are important limitations and barriers regarding its application, when applied correctly SPC is a versatile tool which can enable stakeholders to manage change in healthcare and improve patients’ health.
APPENDIX A
Database search strategy
Web of Science (1986 – 11 June 2004)
TS [topic search] = ((statistical process control or statistical quality control or control chart* or (design of experiment and doe)) and (medical or nurs* or patient* or clinic* or healthcare or health care))
We limited the search to articles in English only which reduced the number of hits from 167 to 159. We saved these 159 titles with abstracts in an EndNote library. Using a similar strategy, we searched the following databases through Ovid:
-
Ovid MEDLINE(R) (1966 to week 1, June 2004)
-
EMBASE (1988 to week 24, 2004)
-
CINAHL (1982 to week 1, June 2004)
-
PsycINFO (1985 to week 5, May 2004)
This yielded 287 hits, including many duplicates, which we saved in the same EndNote library as above.
Centre for Reviews and Dissemination (CRD)
We searched all CRD databases and found two articles which we also added to our EndNote library.
Acknowledgments
We thank Ms Christine Wickman, Information Specialist at the Karolinska Institutet Library, for expert assistance in conducting the database searches. We also acknowledge the pilot work conducted by Ms Miia Maunuaho as a student project at Helsinki University, supervised by Professor Brommels, which provided a starting point for this study. We thank Professor Duncan Neuhauser, Case Western Reserve University, Cleveland, Ohio, USA, and Professor Bo Bergman, Chalmers University of Technology, Gothenburg, Sweden, for their helpful comments on an earlier version of this manuscript. We thank Dr Rebecca Popenoe for her editorial assistance.
REFERENCES
Footnotes
-
Funding: No dedicated funding was received for this study. All coauthors were supported by their respective employers in conducting this research as part of their work.
-
Competing interests: None.
Linked Articles
- Quality Lines