Article Text

Abstract
Background: The Healthcare Commission, the national regulator for the National Health Service in England, has to assess providers (NHS trusts) on compliance with core standards in a way that targets appropriate local inspection resources.
Objectives: To develop and evaluate a system for targeting inspections in 2006 of 44 standards in 567 healthcare organisations.
Methods: A wide range of available information was structured as a series of indicators (called items) that mapped to the standards. Each item was scored on a common scale (a modified Z-score), and these scores were aggregated to indicate risks of undeclared non-compliance for all trusts and standards. In addition, local qualitative intelligence was coded and scored.
Results: The information sets used comprised 463 875 observations structured in 1689 specific items, drawn from 83 different data streams. Follow-up inspections were undertaken on the 10% of trusts with the highest-risk scores (where the trust had declared compliance with a standard) and an additional 10% of trusts randomly selected from the remainder. The success of the targeting was measured by the number of trust declarations that were “qualified” following inspection. In the risk-based sample, the proportion of inspected standards that were qualified (26%) was significantly higher than in the random sample (13%). The success rate for targeting varied between standards and care sectors.
Conclusion: This innovative approach to using information to target inspection activity achieved its overall aims. The method worked better for some standards and in some settings than for others, and is being improved in the light of experience gained. Such applications are increasingly important as modern regulators strive to be targeted and proportionate in their activities.
Statistics from Altmetric.com
In 2005, the Department of Health published a set of standards for NHS trusts,1 grouped into seven “domains” and covering almost all aspects of care. As the national regulator, the Healthcare Commission had responsibility for annually assessing each trust’s compliance with these standards in a way that did not create unnecessary regulatory burdens.2 The solution was to develop an approach that built on trusts’ own governance systems, and ask boards to sign a public self-declaration about whether there was compliance with each of the 44 part-standards3 that comprise the 24 “core” standards.
It is important for public accountability that there is a mechanism to test the accuracy of declarations. Inspecting all trusts within an annual cycle is not feasible, and so a process of risk-based inspection has been developed. The broad concept of targeted inspection was developed in industrial settings4 but has now been adopted by the Financial Services Authority,5 the Housing Corporation6 and other agencies.
The selection of the trusts and standards to be inspected had to be systematic and not impose additional burdens in terms of data collection. This paper describes the design and results of the subsequent NHS inspection process carried out in 2006. The Core Standards Assessment is part of the Commission’s Annual Health Check performance rating programme, which in 2005/2006 replaced the previous systems of a comprehensive 3-year rolling programme of Clinical Governance Reviews and Star Ratings, a remote judgement derived solely from a limited number of performance measures.
The success measure for this information-led system is that it identifies more undeclared non-compliance than randomly selecting trusts for inspection.
METHODS
Cross-checking the trust declarations
The assessment of the accuracy of self-declaration was based on cross-checking those declarations against relevant available data. In most cases, the standards cover broad issues, and it is not possible to assemble a set of focussed and high-quality indicators for direct measurement of each standard. The quantitative measures to assess compliance that do exist tend to be very imperfect. The approach was therefore to map imperfect information drawing on many different sources of centrally available intelligence so as to avoid any additional burden on healthcare organisations in terms of data collection.
In all, quantitative information from 83 data streams and 25 source bodies was used, with a total of 1689 specific items (single data sets). Qualitative intelligence was also included. As part of the declaration process, commentaries were invited from some key local stakeholders (including Patient and Public Involvement Fora, Overview and Scrutiny Committees, and Strategic Health Authorities) and information arising from other work of the Healthcare Commission such as investigations and local operational staff. The magnitude of this information-handling task is outlined in fig 1 (also demonstrating structure) and table 1 (also showing coverage). In fig 1, the background shows an abridged version of the whole domain, and in the foreground there is an expanded section of just the top-left corner of the domain (and again, even this is abridged), showing the wide range of sources of information available for cross-checking this domain. The shaded cells to the right of the items represent our risk estimation, expressed on a continuous red-to-green colour scale.

Abridged excerpt from just one of the seven domains (safety), showing the range of information available for cross-checking.
For some standards, the information available was limited, and the number of relevant items for each standard varied from none to nearly 300. Those standards for which we have no national data items tend to cover very specific areas (eg, adherence to professional codes of conduct, and using the Annual Report of the local Director of Public Health), in which case cross-checking information is limited to any qualitative intelligence we have received. Table 1 summarises the range of information available for each of the seven domains. Some items contributed to more than one standard where appropriate.
Overall, the cross-checking process assembled 463 875 individual observations and 13 742 pieces of coded qualitative intelligence. This was used to cross-check the 23 495 declarations of compliance in 567 NHS trusts (learning disabilities trusts were subject to random selection only).
Scoring and summarising data items
With such a broad spread of information of varying quality, it was considered inappropriate to place undue reliance on any one item. Instead, the aim was to identify consistent patterns within standards that were suggestive of increased risk of undeclared non-compliance. It is important to emphasise that this process was not intended to give a definitive judgement on performance against the standards, but to allow prioritisation of concerns: this is the literal idea of a performance indicator.
The data items were very heterogeneous and yet needed to be placed on a common risk-scale in order to be aggregated into an assessment of potential non-compliance. Each item was therefore transformed into a Z score7 (Zd), essentially comprising the difference between a trust’s observed values and an expected value (such as a national average), relative to the variability in that item across all trusts. The calculation of this variability was robust to outliers and allowed for the standard error of measurement if available.8 This methodology is also used when scoring items that contributed to previous star ratings system and as part of the current Annual Health Check,9 although here we are interested in the continuous score rather than imposing thresholds to create a banding.
By ensuring the analysis of each item was defined so that “high Z is bad,” Z-scores form a standardised measure of “unusualness”: roughly, Z scores of 2 or more can be considered fairly unusual, while a score of 3 or more indicates a very unusual result. Qualitative data were mapped onto a scale between –4.5 and +4.5.
Where appropriate, the trusts’ observations were compared with the average for groups of similar trusts rather than the national average, to minimise the effect of confounding factors for a particular item that are beyond the control of trusts (eg, local levels of deprivation, specialist trust status, etc). Healthcare Commission analysts and policy leads determined the analysis settings for each item.
Scoring standards by aggregating evidence
For each trust, all available item level results for a standard were aggregated to form a standard level risk estimate, comprising a “risk score” and a “confidence score.” The reliability and relevance of items will vary, and our aggregation method needed to take this into account while being robust to variation of group composition. Our approach was to score each item on a three-point scale (low (0.5), medium (1.0) and high (1.5)) for the following attributes: data quality (including age of data), contributing to confidence; impact on experience of the patient, contributing to risk; and relevance to the standard, contributing to both and weighted double in each case.
The composite standard-level Z score (Zc) was formed by taking an adjusted mean of the continuous item-level Z scores (the Zds) mapped to each standard. First, where necessary, the Zds were “capped” at ±3 to avoid any single extreme result unduly distorting the group level estimate, and then weighted as described above. The mean value of these Zds was then adjusted by its standard error to ensure that the Zc behaved like a regular Z score (ie, expected to have a mean of 0 and a standard deviation of 1). The adjustment takes into account the interitem correlation present among the Zds, which should self-correct where two different items measure the same underlying factor and allows us to include a wide range of items without employing complex weighting systems. The Zc value is our standard-level “risk score.”
The aggregation method was intended to produce comparable risk scores (in terms of scale) regardless of the number of items included. However, our confidence in the reliability of the result may vary based on the items that have been used; aggregating the item weights across a group allowed us to express the confidence we had in each risk score in the form of a continuous “confidence score.”
Selecting trusts and standards for inspection
Where trusts had declared compliance, the risk and confidence scores were inspected. Thresholds were set for risk and confidence measures to categorise each score into “low,” “medium” or “high,” and “potential undeclared non-compliance” was estimated if the risk score was high, and there was a reasonable confidence score (specifically, if Zc was above 2 with “medium” confidence, or above 1.25 with “high” confidence). These limits produced sufficient discrimination between trusts to allow us to select a subset of trusts for risk-based inspection.
The Core Standards Assessment programme was allocated sufficient inspection resource to visit 20% of trusts per sector (agreed prior to declaration and cross-checking). This resource was split into 10% risk-based inspections (selected by a descending count of the number of standards within each trust with potential undeclared non-compliance, all standards having equal weight), and an additional 10% were selected randomly from the remaining trusts, stratified by sector and Healthcare Commission area. The trusts’ evidence of assurance for a sample of five standards was considered at each inspection, those standards being chosen either by highest risk estimates (risk based visits) or at random (randomly selected visits). Risk-based trusts were selected before the random to ensure that the estimated high-risk standards were followed up.
Inspections of both groups of trusts were undertaken during June to August 2006 by Operational staff of the Healthcare Commission, using guidance specific to each standard.10 It is important to note that the inspections were focused on assessing board assurance on compliance with a standard, and the information used to select the organisation for inspection was not directly analogous to that question. A trust’s declaration was “qualified” on a specific standard where inspectors found insufficient local evidence to endorse the claimed compliance. The relative level of qualifications from risk and random inspections provides some assessment of the accuracy of risk targeting.
RESULTS
Results of cross-checking
In 2006, 94% of the 24 912 declarations asserted compliance, and only 6% signalled non-compliance. Thirty-four per cent of trusts declared themselves compliant with all standards, while only 1% declared they were compliant with less than half of the 44 standards. The declaration pattern varied both by trust and by standard.
The highest rates of declared compliance by standard were:
C10b (professional codes of practice): 99.5%;
C08a (whistle blowing): 99.1%;
seven other standards declared 98% compliance.
The lowest rates were:
C11b (participation in mandatory training programmes): 80.2%;
C09 (records management): 81.4%;
C05a (NICE technology appraisals): 84.6%;
C04c (decontamination): 87.4%;
C04b (use of medical devices): 87.9%.
The levels of qualification arising from inspections are summarised in table 3.
Our critical measure of success for the cross-checking system was to achieve more qualifications in risk-targeted standards than in those selected at random. The overall level of qualifications in the “risk-based” sample was twice that in the random sample, which was a significant difference (p = 0.008, using a logistic regression model fitted to test whether the outcome of inspection was significantly affected by inspection type, taking into account clustering of qualifications within trusts; a crude χ2 test also showed significance, p<0.001). Our objective was achieved at trust and standard level.
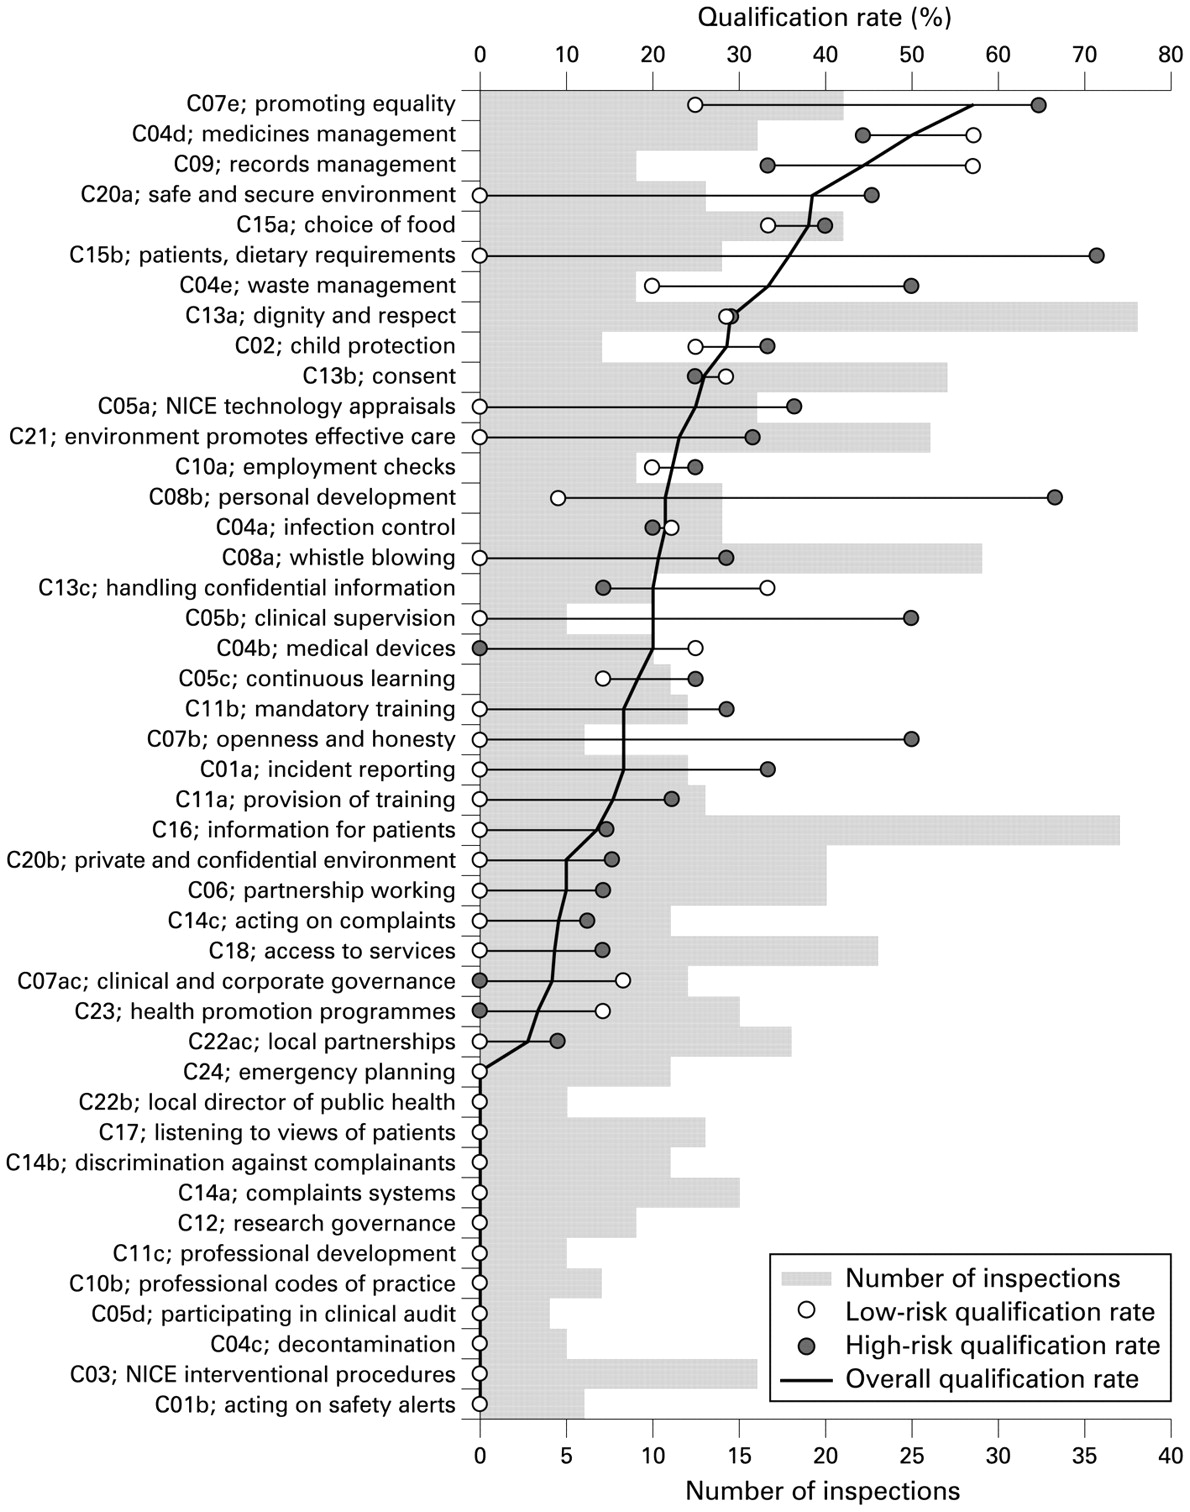
Table 3 shows that qualification rates varied by both trust type and domain, while fig 2 shows qualification rates for individual standards. Note that “risk-based” or “random” is a trust classification, and although it broadly translates to standards, there are six high-risk standards that were selected by chance in the random sample (out of 285). This has a noticeable effect on the qualification rates of certain standards, so we quote them by our prediction of risk (“high” or “low”) rather than inspection type.

Qualification rate for standards identified as “high-risk” compared with those not identified as “high-risk.”
It was found that cross-checking worked better for some standards than others, with particularly good agreement on C15b (meeting patients dietary requirements), C08b (personal development programmes), C07b (openness and honesty) and C05b (clinical supervision), which are all characterised by an increased level of high-risk qualifications and a reduced level of low-risk qualification. Similar tendencies (ie, more than 20% difference between the qualification yields for high-risk and low-risk) are displayed in nine other standards. C04b (safety in relation to medical devices) is the only standard that has a difference in yields greater than 20% in favour of low-risk. These results will have been influenced by the fact that some standards have better information available than others, and that some standards may be easier for inspectors to judge than others. This is demonstrated by the fact that 12 standards had no qualifications on either high- or low-risk standards, while others were qualified on nearly two-thirds of inspected standards.
It is possible that judgements were influenced by the fact that inspectors knew the risk status prior to inspection. We cannot completely discount this without a blinded trial, but it is worth repeating that the basis of inspection is different from the information used for risk selection. In addition, randomly selected standards with higher-risk estimates were more likely to be qualified than those with lower-risk estimates (although the numbers were too small to allow definitive conclusions). There is no evidence that the type of trust influences the system, as despite the overall level of qualification varying between sectors, the difference in risk and random qualification rates is remarkably consistent. Differences in overall qualification and risk/random split do exist by region. Again, numbers at this level were too small to form any conclusion.
Contribution to the annual health check
The trusts’ declarations (and results of the inspection, if applicable) were used to derive a final overall score for the core standards assessment, based on the number and status of significant lapses declared; lapses uncovered by the Commission on inspection counted double.11 This final CSA score has a significant impact on the Quality of Service rating in the Commission’s Annual Health Check.12
DISCUSSION
The approach to assessing core standards reflected recognition that traditional approaches to performance assessment, using either a limited number of indicators or a comprehensive inspection programme, would not be feasible. The breadth of requirements and services to be covered was simply too large.
Instead, our approach represents a novel way of using information with an emphasis on pattern recognition and “triangulation” in order to guide inspection, rather than precise specification aiming to judge institutions directly. This draws on earlier work such as that of Yates13 and others to look at organisational performance using multiple process measures, and the common scoring approach (modified Z scores) has parallels to earlier work looking at combining multiple metrics.71415 The idea that information can be used to prompt further queries in a staged process was described by Lilford et al.16 The integration of quantitative and qualitative intelligence (albeit in a simplified coded form) represents an important innovation. We believe the range of information sources brought together in this process, and subsequently structured in a common way towards a single goal, is unprecedented in the field of healthcare information handling.
The parallel use of randomly selected inspections is partly recognition of the developmental nature of the methods but also has been proposed as a general approach in the regulatory armoury by Bevan and Hood.17
In evaluating the success of the system, we have assumed that it can be approached as a purely statistical exercise. This involves further assumptions such as the three results sets (declaration, cross-checking and inspection outcome) are equivalent in that they measure the same thing, and that the inspection outcomes represent a gold standard. While they are put through rigorous quality-assurance processes, they are fundamentally judgements made by individuals on specific and variable situations.
As described previously, cross-checking and inspection answer different, though related, questions, and the declaration itself is a matter of judgement for trusts on the interpretation of a “significant” lapse, for which there is no common national definition, particularly in the first year of assessment.18 However, we would expect this to add a constant level of “noise” to both risk and random outcomes. Also, we assume that we can treat our random sample of trusts as a control group, despite having selected risk-based trusts first for policy reasons and applied stratification to the remainder.
In its first year, the cross-checking system has produced more qualifications in the targeted trusts than those randomly selected. However, as with all risk assessments, the results clearly show that there is scope to improve further the sensitivity and specificity. In particular, we would like to examine the variability between standards and make better use of the qualitative intelligence, which tended to increase the likelihood of generating a false-positive result.
This approach to targeting inspection activity has achieved its primary aim of focussing the regulatory efforts where there appears to be greatest risk. There is general support for making regulation more targeted and proportionate, with a range of approaches being adopted by different regulators. Within the context of the NHS, where there is a need to ensure that we make the most of available intelligence and summarise information about complex processes of care, the approach described looks promising.
The Healthcare Commission will continue to use this approach for the 2006/2007 assessment and beyond, and is adopting similar techniques in other assessment streams.
Acknowledgments
We would like to acknowledge the contributions from many teams within the Healthcare Commission but in particular members, past and present, of the Screening Development Team, Standards Based Assessment Team, the Area Support Analysis Team and our Operations colleagues.
Footnotes
Competing interests: None.