Article Text

Abstract
Objective There is a growing focus on quality and safety in healthcare. Outcome indicators are increasingly used to compare hospital performance and to rank hospitals, but the reliability of ranking (rankability) is under debate. This study aims to quantify the rankability of several outcome indicators of hospital performance currently used by the Dutch government.
Methods From 52 indicators used by the Netherlands Inspectorate, the authors selected nine outcome indicators presenting a fraction and absolute numbers. Of these indicators, four were combined into two, resulting in seven indicators for analysis. The official data of 97 Dutch hospitals for the year 2007 were used. Uncertainty in the observed outcomes within the hospitals (within hospital variance, σ2) was estimated using fixed effect logistic regression models. Heterogeneity (between hospital variance, τ2) was measured with random effect logistic regression models. Subsequently, the rankability was calculated by relating heterogeneity to uncertainty within and between hospitals (τ2/(τ2 +median σ2)).
Results Sample sizes varied but were typically around 200 per hospital (range of median 90–277) with a median of 2–21 cases, causing a substantial uncertainty in outcomes per hospital. Although fourfold to eightfold differences between hospitals were noted, the uncertainty within hospitals caused a poor (<50%) rankability in three indicators and moderate rankability (50–75%) in the other four indicators.
Conclusion The currently used Dutch outcome indicators are not suitable for ranking hospitals. When judging hospital quality the influence of random variation must be accounted for to avoid overinterpretation of the numbers in the quest for more transparency in healthcare. Adequate sample size is a prerequisite in attempting reliable ranking.
- Health care quality
- patient outcomes
- quality of care
- reliability
Statistics from Altmetric.com
Introduction
There is a growing focus on quality and safety in healthcare. Increasingly, indicators are used to assess hospital performance. In different countries nationwide systems have been set up to monitor the performance of healthcare institutions using a framework of structure, process and outcome indicators.1 2
Public disclosure of the results of hospital performance leads to several inconsistent comparisons and rankings and there is concern among professionals about the value and reliability of such rankings.3–10 Although rankings seem to be simple, they ignore the chance variability in differences between hospitals and the magnitude of differences.11 In this research the authors focus on the suitability of indicators, specifically outcome indicators, to provide reliable hospital comparisons.
Two core components determine the reliability of hospital comparisons: within-hospital uncertainty (how reliable the estimates are for each hospital) and between-hospital heterogeneity (how large the differences are between hospitals).
The amount of uncertainty in the analysis of hospital performance is higher than intuition might suggest.12 For low-incidence outcome and for smaller subgroups in the population, uncertainty can be large.13 The smallest hospitals would likely experience five to seven times more uncertainty about their true performance.14
The second component is heterogeneity between hospitals.15 Heterogeneity relates to the true differences beyond chance between hospitals and can be estimated with random effect models.
Both components determine the reliability of ranking with an indicator, the ‘rankability’. The term rankability, which was first used by van Houwelingen et al (web-published research16), measures what part of the variation between the crude hospital effects is due to unexplained differences as opposed to uncertainty. The authors loosely interpret rankability as the signal to (statistical) noise ratio.
Because there are no minimal sample size requirements for the indicators used by the Dutch government, the numbers may be small, making ranking attempts less reliable. This study aims to quantify the rankability of several outcome indicators of hospital performance in the Netherlands.
Methods
Data
Data were obtained from the Netherlands Inspectorate's indicator set. The inspectorate uses this set to assess possible flaws in the quality of care in Dutch hospitals. This obligatory set includes 21 areas with 52 performance indicators, of which 14 are outcome indicators presenting both fraction and absolute numbers. Five indicators were excluded because of clear evidence of registration bias, such as extrapolation of a limited sample in time or patient groups, leaving nine outcome indicators (table 1). Data from 2007 were used, which are publicly available (http://www.ziekenhuizentransparant.nl/). For acute myocardial infarction (AMI), the majority of hospitals reported in-hospital mortality instead of 30-day mortality. Several hospitals reported both. Using these data, the 30-day mortality was multiplied by 0.74 to give data for the five hospitals that only reported 30-day mortality.
Outcome indicators and their description
Uncertainty
Numerator and denominator data were used for each hospital to create a patient level dataset. A coefficient for unfavourable outcome was estimated for each hospital and was compared to the overall average using a fixed effect logistic regression model with an offset variable and hospital as a categorical variable. The SE of the estimated coefficient (σ2) indicates the uncertainty of the estimate, or the within-hospital variance. The median σ2 over all hospitals was taken to represent the within-hospital variance. The median was used because of the skewed distribution of the σ2.
Heterogeneity
A random effect logistic regression model was used to estimate unexplained heterogeneity, indicated by τ2 (the between-hospital variance). Unlike the fixed effect model, the random effect model accounts for the fact that the observed outcomes for smaller hospitals can take on extreme values because of random variation. The variance indicates the differences between hospitals beyond chance.17
For the interpretation of τ2, a 95% range of ORs was calculated for the hospitals compared with the average as follows: exp(−1.96*τ2); exp(1.96*τ2).18
Rankability
To estimate rankability, the following formula was used:
Rankability relates the heterogeneity τ2 from the random effect logistic regression model (differences between the hospitals) to the SE σ2 of the individual hospitals from the fixed effect logistic regression model. Rankability can be interpreted as the part of heterogeneity between hospitals that is due to unexplained differences, and the rest is due to natural variation or chance. Therefore, rankability describes the reliability of ranking.
Case-mix adjustment
The data on performance indicators did not include patient characteristics, except for two outcomes: AMI mortality and heart failure readmission. The original indicators were stratified by age. The indicators AMI <65 years plus ≥65 years; and heart failure <75 years plus ≥75 years were combined in two datasets and a limited age adjustment was applied by putting age group in the fixed part of the random effect model.
The statistical analysis was performed with R statistical software (version 2.7.1, R Foundation for Statistical Computing, Vienna, Austria), using the lme4 library to fit random effect logistic regression models.
Results
Nine outcome indicators (table 1) were studied, of which four indicators were combined into two.
Within-hospital uncertainty
The number of cases and the total number of patients per hospital varied widely for the different indicators (table 2). For instance, pressure ulcer prevalence varied from 0 to 39 cases, while the number of patients ranged from 59 to 548. For cholecystectomy, the number of cases with bile duct leakage was very small (median 2). A considerable number of hospitals reported 0 cases (29 out of 97), resulting in a median incidence of leakage of the bile duct of 0.5%. The within-hospital uncertainty was largest for cholecystectomy (σ 1.01), and pressure ulcer incidence (σ 0.85) because of the small number of cases (table 3).
Descriptive statistics
Rankability
Between-hospital heterogeneity
Heterogeneity between hospitals varied from none (τ2 0) for cholecystectomy to τ2 0.29 for colorectal surgery. The corresponding 95% range of the ORs was 0.35 and 2.86 for colorectal surgery, meaning that hospitals at the higher end of the distribution had a 2.86 higher chance of reoperation than in the average hospital. Similarly, at the lower end of the distribution, patients had a 0.35 lower chance of reoperation. This was equivalent to an eightfold difference between the hospitals for this indicator.
Rankability
Because of the large between-hospital differences, rankability was the highest (71%) for colorectal surgery and the lowest (<50%) for the indicators pressure ulcer prevalence, pressure ulcer incidence, and cholecystectomy. For pressure ulcer the rankability was relatively low despite a σ2 of 0.19 related to the small between-hospital differences (τ2). Rankability was moderate (50–75%) for the indicators colorectal surgery, AMI, heart failure readmission, and breast-saving lumpectomy.
Adjustment for case mix revealed that a part of the heterogeneity in the AMI indicator was by age. For heart failure readmission, age was borderline significant. Rankability for the combined indicator AMI was 58% and for heart failure 51%.
Discussion
Several outcome indicators were tested to assess their reliability for ranking hospitals using the concept of rankability. Rankability indicates what extent the variation between crude hospital effects is due to true differences (as opposed to measurement error). Combining fixed effect logistic regression models and random effect logistic regression models, the uncertainty within individual hospitals and the unexplained heterogeneity between hospitals could be estimated. Considerable variability was found to be due to chance alone within hospitals. However, the unexplained differences between hospitals were small for some indicators. Both lead to low rankability.
It should be noted that ranking is a specific form of hospital comparison. Although the amount of uncertainty is an important factor in all hospital comparisons, ranking also ignores the magnitude of the differences. For example, when the random effect estimates of 10 hospitals show that they all have very similar outcomes, ranking them from 1 to 10 ignores the similarity. Therefore, reporting rankability is even more relevant for rankings.
The indicators in this research showed substantial uncertainty that influenced rankability. For cholecystectomy, there were no differences other than those by chance alone between the hospitals. Using this indicator for ranking hospitals is therefore ineffective. This adds to the criticism by de Reuver and Gouma about this indicator.19 Substantial heterogeneity led to larger rankability in the colorectal surgery indicator (71%). Nevertheless, for this indicator it remains unclear how much of these differences are caused by case mix. It is plausible that a different indication for surgery, such as traumatic injury or colorectal cancer, may play a role in reoperation rate. Case-mix correction should be performed before using this indicator to rank hospitals on their performance. The lack of heterogeneity influences the rankability of the pressure ulcer prevalence. For AMI and heart failure, a simple stratification was performed for two age groups. Combining both age groups resulted in a larger number of cases and total numbers. While rankability of the group of patients younger than 65 was low due to the limited number of cases, the pooled data stratified for age had a moderate rankability (51%).
In order for rankability to be large, the between variance needs to dominate the within variance. Therefore measuring performance should be precise and with adequate sample size if we want to distinguish between hospitals. Rankability combines both the within variance and the between variance. If the between-variance (heterogeneity) is large, we can accept more within-variance to still be able to distinguish between hospitals.
The measurement of rankability provides a way of assessing reliability of ranking. We might compare rankability with the signal-to-noise ratio that is used for electrical signals and is defined as the power ratio between a signal (meaningful information) and the background noise (unwanted signal). So, an indicator provides a signal on quality of care, which is corrupted by random variation. The problem with ranking on crude hospital performance occurs when a rare event is chosen for the indicator, like mortality. Some hospitals have small sample sizes that make the statistics for the performance unstable and the rank order unlikely to replicate. One might also argue that ranking should be avoided. Furthermore, if for ‘pay for performance’ or ‘quality bonus’ initiatives are attempted, the signal to noise ratio should be large not to falsely accuse hospitals or individuals.
Lingsma et al used rankability to assess the ranking of a small number of in-vitro fertilisation (IVF) clinics.20 They found considerable heterogeneity, while uncertainty per clinic was small because of large numbers (median 654 cycles). This resulted in a substantial rankability with only 10% of the observed differences between the clinics attributed to chance.20 Compared with this research, rankability in our data was much lower. In the Dutch outcome indicators, not only were the total numbers of patients sometimes small (median between 90 and 277) but also the outcome was frequently low. Simple rankings based on fixed effects of hospital performance disregard both the magnitude and the uncertainty of the differences between hospitals.21 An illustrative example is the cholecystectomy indicator, where the number of cases was too low to detect any differences between hospitals.
Small samples and low event rates limit the statistical power of the comparison between hospitals.22
This raises questions about minimal power calculations or combining indicators to provide sufficient sample size to decrease measurement error. Classical power calculation or estimating minimal cases and total numbers might be performed using Cohen's d, where d is defined as the difference between two means divided by the SD. Effect sizes are commonly defined as small, d=0.2, medium, d=0.5, and large, d=0.8. A variant of Cohen's d may be used for event rate. The population size for d=0.5 then is at least 200, and at least 800 for d=0.2 for indicators with sufficient event rates.23 These numbers can be used as ‘a rule of thumb’ to assess the reliability of ranking hospitals. Actual calculations of required sample sizes for random effect models are much more complex and theoretical work on this topic is needed. Looking at the sample sizes for the pressure ulcer indicator (59–548) in the Dutch hospitals, it is questionable if this indicator will ever be suitable for ranking hospitals. The maximal sample size is limited by the number of beds in a hospital. In case of inadequate numbers, presentation of the results for a specific indicator could be done using funnel plots because this would show the differences between hospitals in relation to random variation.24 In addition, crude random effect estimates including a measure for rankability might be informative for stakeholders who are able to interpret them, for example, hospitals or the government. Realistic presentation is important to avoid gaming and truly encourage actions to improve the quality of care.25
A categorisation for rankability is still arbitrary. Lingsma et al suggested that over 70% rankability should be fair to rank hospitals.20 Higgins et al assigned adjectives of low, moderate and high to the I2 values of 25%, 50% and 75%.26 I2 is used to measure heterogeneity in meta-analyses27 and is similar in nature to our rankability measure. I2 can be interpreted as the percentage of the total variability in a set of effect sizes due to heterogeneity, that is, between-study variability. Adopting this categorisation, the authors found that none of the outcome indicators had a high rankability. It could be argued that in case of moderate rankability, ‘expected ranks’ should be used that take into account random variability.13–15 This requires statistical knowledge and access to advanced statistical programs. No ranking attempt should be made when rankability is low. It would also be interesting to identify subsets of hospitals that meet or exceed a standard, fall below a standard, and a subset that cannot be classified due to sample size limitations. The random effect estimates with CIs shows if a hospital significantly differs from the mean beyond statistical uncertainty. Therefore, random effect estimates can be used to identify subsets, and funnel plots used as a graphical display of these subsets.
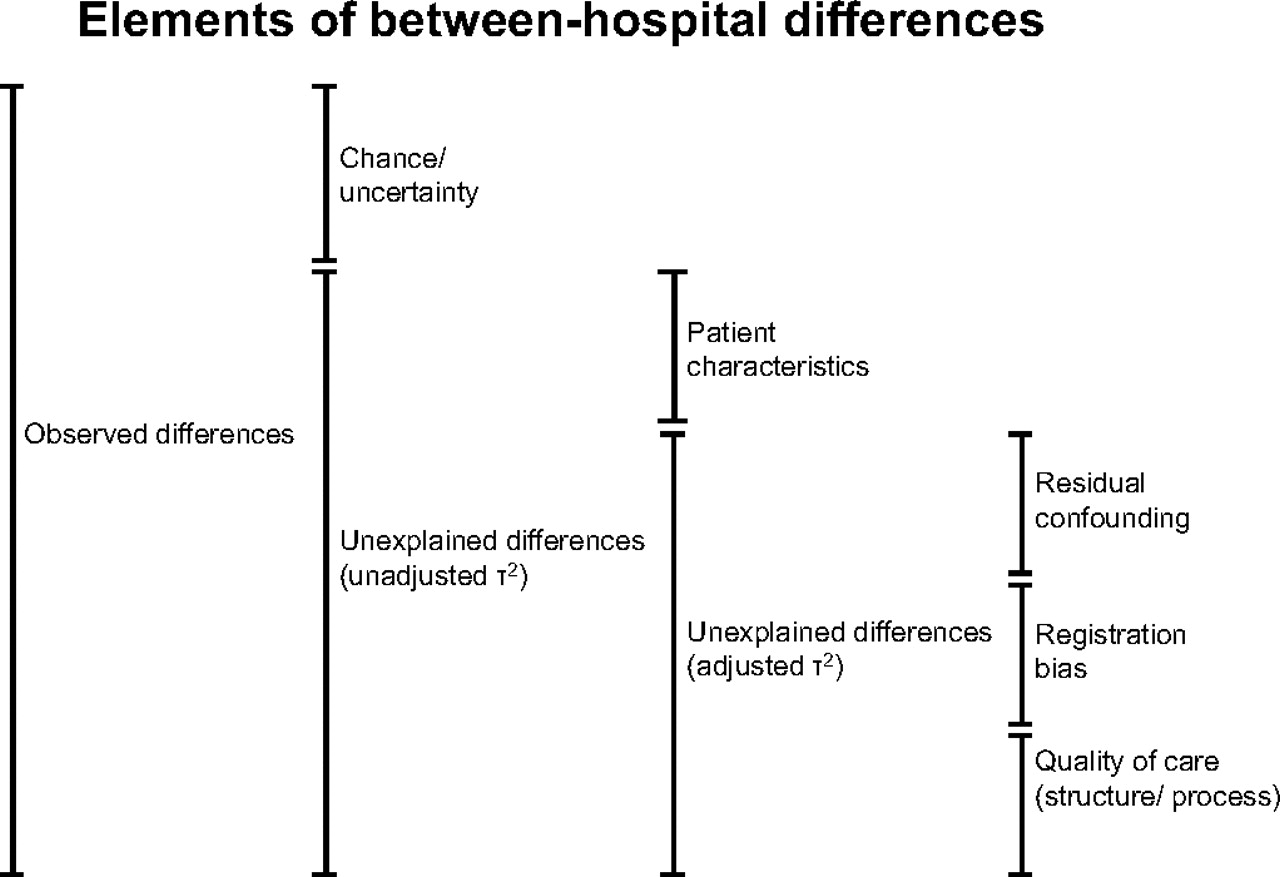
Reliability of ratings depends on sample size and heterogeneity, but also on biases. A conceptual framework can be drawn to summarise the elements of between-hospital differences (figure 1).20 The observed differences can be divided into unexplained differences and chance. By using random effect models, chance can be corrected for, leaving patients characteristics, registration bias, quality of care and residual confounding as elements of the unexplained differences. Consequently, ranking reflects the total of unexplained differences between hospitals and not true differences in the quality of care. This is a limitation of this study, but the publicly reported data do not provide any additional information.
Conceptual framework of between-hospital differences. Observed differences can be divided into random variation and unexplained differences, which can be further attributed to patient characteristics that were not adjusted for, residual confounding because of imperfect case-mix correction, registration bias. Differences in quality of care remain the explanation for the final part of between-hospital differences.
The authors conclude that none of the currently used Dutch outcome indicators are suitable for ranking hospitals. When judging hospital quality the influence of random variation must be accounted for to avoid overinterpretation of the numbers in the quest for more transparency in healthcare. Adequate sample size is a prerequisite when attempting reliable ranking.
References
Footnotes
Funding Internal Erasmus MC grant for healthcare research (Mrace).
Competing interests None to declare.
Provenance and peer review Not commissioned; externally peer reviewed.