Article Text

Abstract
Background The Hawthorne effect, or behaviour change due to awareness of being observed, is assumed to inflate hand hygiene compliance rates as measured by direct observation but there are limited data to support this.
Objective To determine whether the presence of hand hygiene auditors was associated with an increase in hand hygiene events as measured by a real-time location system (RTLS).
Methods The RTLS recorded all uses of alcohol-based hand rub and soap for 8 months in two units in an academic acute care hospital. The RTLS also tracked the movement of hospital hand hygiene auditors. Rates of hand hygiene events per dispenser per hour as measured by the RTLS were compared for dispensers within sight of auditors and those not exposed to auditors.
Results The hand hygiene event rate in dispensers visible to auditors (3.75/dispenser/h) was significantly higher than in dispensers not visible to the auditors at the same time (1.48; p=0.001) and in the same dispensers during the week prior (1.07; p<0.001). The rate increased significantly when auditors were present compared with 1–5 min prior to the auditors’ arrival (1.50; p=0.009). There were no significant changes inside patient rooms.
Conclusions Hand hygiene event rates were approximately threefold higher in hallways within eyesight of an auditor compared with when no auditor was visible and the increase occurred after the auditors’ arrival. This is consistent with the existence of a Hawthorne effect localised to areas where the auditor is visible and calls into question the accuracy of publicly reported hospital hand hygiene compliance rates.
- Infection control
- Compliance
- Nosocomial infections
This is an Open Access article distributed in accordance with the Creative Commons Attribution Non Commercial (CC BY-NC 4.0) license, which permits others to distribute, remix, adapt, build upon this work non-commercially, and license their derivative works on different terms, provided the original work is properly cited and the use is non-commercial. See: http://creativecommons.org/licenses/by-nc/4.0/
Statistics from Altmetric.com
Background
Healthcare worker (HCW) hand hygiene is an important strategy to prevent healthcare-associated infections (HAIs), which are the most common adverse event experienced by patients during medical care.1 HCW hand hygiene is known to be suboptimal2 and multifaceted improvement programmes are recommended, including measurement and feedback of compliance rates.3 Direct observation, in which human auditors monitor the hand hygiene compliance of HCWs as they carry out clinical tasks, is the most commonly used method of measurement. However, this method is subject to biases, including observer bias, selection bias and possibly the Hawthorne effect.3 ,4 If the resulting data are publicly reported, as is the case in many jurisdictions around the world, the potential for bias may be even greater.5
The Hawthorne effect, also called observation bias, refers to the tendency of people to change their behaviour when they are aware of an observer.3 ,4 It is widely assumed that the Hawthorne effect transiently increases HCW hand hygiene compliance rates when auditors are present, despite the fact that the existence of the Hawthorne effect has been extensively debated in the psychological literature6 and studies that examine the Hawthorne effect specifically in hand hygiene behaviour have significant methodological limitations. Much of the evidence in hospital hand hygiene compliance monitoring comes from studies demonstrating that compliance rates are higher when audits are announced in advance or the auditors are known to the units.7–11 However, the potential for observer and selection bias is high, particularly since it was not stated in any of these studies whether the observers were blinded to the study hypothesis.
The recent development of electronic systems for hand hygiene monitoring offers an alternative approach to direct observation.12 These systems monitor HCW hand hygiene on a constant, real-time basis, making them a promising tool for determining whether the Hawthorne effect exists and characterising the nature of the effect. Furthermore, electronic systems apply consistent algorithms to measure hand hygiene events and compliance rates, eliminating many of the biases inherent to direct observation. The objective of this retrospective cohort study was to use a real-time location system (RTLS) to determine whether the presence of human auditors on inpatient units was associated with an increase in hand hygiene events.
Methods
Setting and participants
An RTLS was installed on two multi-organ transplant units at an academic acute care hospital as part of a larger research study and was operational between 18 July 2012 and 11 March 2013. The RTLS used small battery-operated tags that could be worn by people or attached to equipment. Tags emitted ultrasound signals at regular intervals, which were picked up by a network of 618 wireless receivers situated in patient rooms, hallways, and above all 257 alcohol-based hand rub (ABHR) and 148 soap dispensers. Signals from the receivers were processed by a geographical information systems engine, which computed movement, location and proximity of tags to each other.
All HCWs on the study units, including physicians, nurses and allied health professionals, were invited to participate in the overall study of the RTLS through presentations by study personnel. Posters describing the RTLS and the study were also displayed on the participating units. HCWs who volunteered to wear tags contacted the research assistant to provide written informed consent. There were 60 tags available for HCWs, which represented approximately a quarter of the staff who routinely worked on these units. The tags were a component of the overall study but did not contribute data to the current study. The objective of the overall study was to determine the effect of the RTLS in combination with a behaviour change approach called ‘positive deviance’ on HAIs. Data from the RTLS, including movement of equipment and trends in hand hygiene (but not specific compliance rates as measured by the RTLS), were presented to front line HCWs, who were then empowered to make changes on the units to address the identified issues. HCWs were aware that the RTLS was used to monitor hand hygiene but were not informed that the Hawthorne effect would be studied and were blinded to this study's hypothesis. Institutional research ethics board (REB) approval was obtained for the overall study, and administrative REB approval was obtained from the University of Toronto specifically for this component of the study on the Hawthorne effect.
Measures
The RTLS measured hand hygiene events by counting all times that ABHR and soap dispensers were used. Tags installed on the dispensers transmitted a signal to a nearby receiver each time the levers were pushed, and a time-stamped hand hygiene event was recorded in a centralised database. If multiple dispenses occurred at a single dispenser within 4 s of each other, only one dispense event was counted. Prior to the start of this study, the RTLS was tested in a simulated clinical environment and 100% of dispenses were detected. The hand hygiene event rate was defined as the total number of ABHR and soap dispenses measured by the RTLS per dispenser per hour.
Auditors also measured directly observed hand hygiene compliance rates on the study units as part of the overall hospital hand hygiene programme. Auditors wore white lab coats as per usual hospital practice and were not specifically identified as auditors but may have been recognisable to some HCWs. Auditors were blinded to the study hypothesis and conducted audits in accordance with the Ontario Just Clean Your Hands programme,13 once or twice monthly on each unit from 29 November 2012 to 11 March 2013. No more than two audits were conducted per unit per month so as to prevent HCWs from noticing an increased frequency of auditing and changing their behaviour as a result. The duration of each audit was variable due to the requirement for auditors to remain on the unit until they had observed 60 hand hygiene opportunities. Auditors were instructed not to enter patient rooms in order to maintain privacy.
Study design
The Hawthorne effect was conceptualised as an exposure–outcome relationship, in which the exposure was the presence of a hand hygiene auditor and the outcome was hand hygiene events. This study used a retrospective cohort design, defining the exposed cohort as the ABHR and soap dispensers on the two multi-organ transplant units that were within eyesight of an auditor.
The auditors who rotated through the study units wore staff RTLS tags to track the exact time and location of auditing. After audits, a list of receivers that had detected the tag and the time period during which the tag was within that zone was obtained. The auditor's location was then assessed by sequentially locating on a unit map each of those receivers that had detected the auditor tag. Figure 1 shows a section of the unit map with receivers represented by circles. When the tag was localised within a straight section of the hallway (ie, where all dispensers would be within eyesight) for at least 5 min, the number of dispenses in that area was determined during that time period. The time period started when the auditor tag was first detected in that area, and ended when the auditor turned a corner or left the unit. The outer boundaries of the area were defined as the two receivers furthest from each other that had picked up a signal from the auditor's tag in that time period and were within eyesight of each other. The number of dispenses were counted for all dispensers inside the patient rooms within those boundaries and in the hallways outside those rooms during the defined time period. The count was then converted into an event rate per dispenser per hour. This procedure was repeated for the duration of each audit, dividing each audit into a variable number of time periods in which the auditor was visible within a defined location. The dispensers within these time-location blocks made up the exposed group.
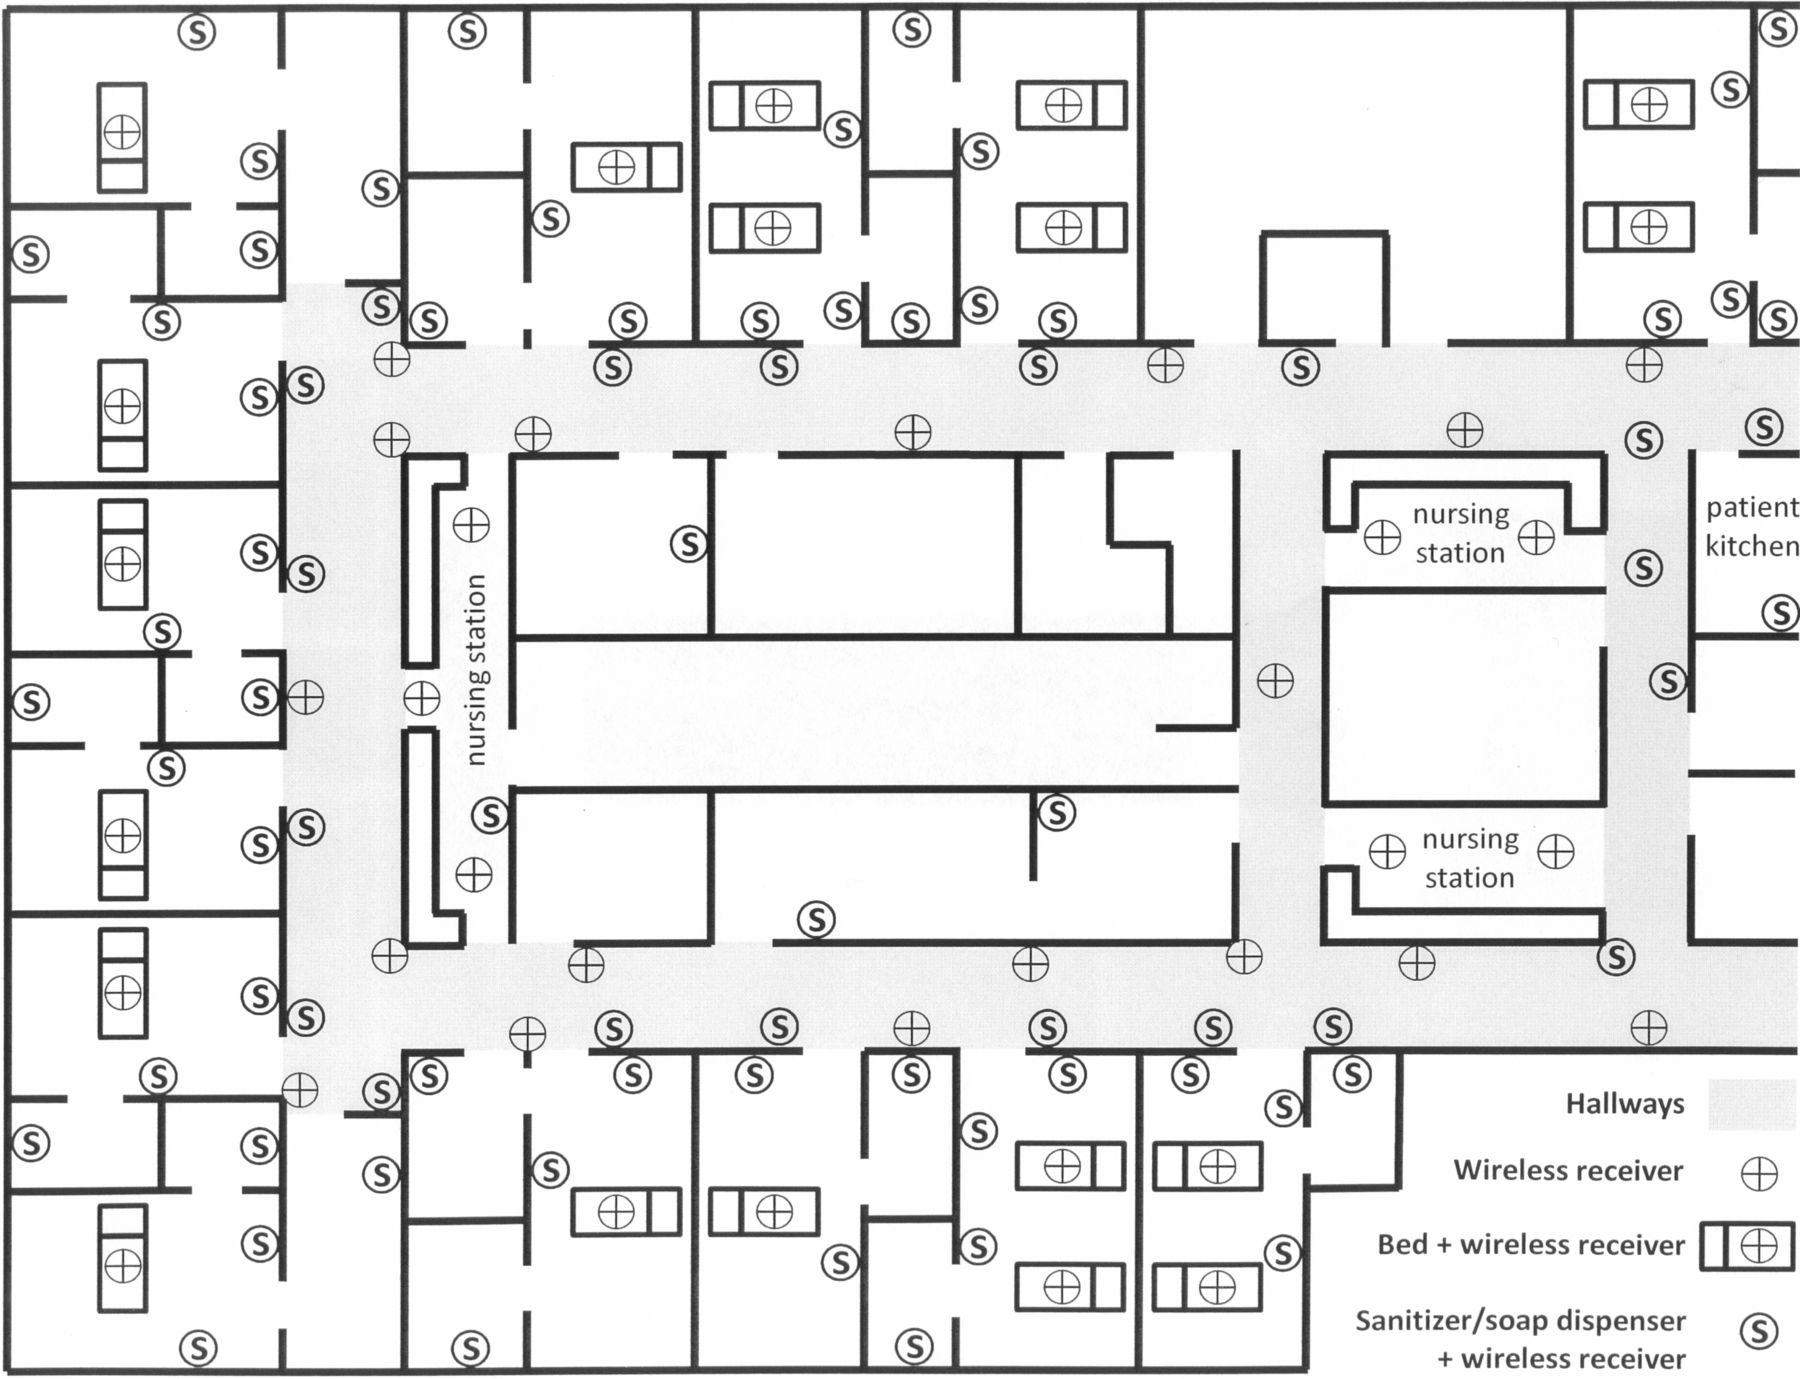
Unit floor plan and location of real-time location system components.
Event rates in the exposed dispensers were compared with three separate unexposed groups in order to address the potential for confounding. The first comparison group was another area of the unit that would not have been visible to the auditors at the same time period during the audit. Since the day and time were the same, this comparison controlled for any differences in hand hygiene patterns that might be attributable to temporal factors.3 ,14
The second group was the same area where the auditors were located at the same time of day, but at 1, 2 and 3 weeks prior to the audit. This accounted for the fact that workload and thus hand hygiene events may be variable depending on location on the ward; for example, patients who are more severely ill and therefore require more hands-on care may be located closer to nursing stations.
The final comparison group was the same area where the auditors were located in the 1–5 min prior to their arrival on the day of the audit. The 1 min immediately prior to the auditors’ arrival was excluded because they may have been coming into view during that time. This group addressed the potential for reverse causation bias, in which the outcome could cause the exposure since auditors typically move to locations where more activities are taking place. This would be the opposite causal direction to the Hawthorne effect, in which the presence of the auditor results in an increase in hand hygiene event rate.
The primary outcome was the hand hygiene event rate, defined as the combined number of ABHR and soap dispenses per dispenser per hour. Separate event rates were calculated for dispensers in the hallways, which would be within eyesight of auditors, and dispensers inside patient rooms, which are typically not seen by auditors.
Data analysis
Hand hygiene event rates in the exposed group were compared with each of the other three groups using the Wilcoxon signed rank test. The samples were assumed to be related since they were taken from a fixed group of dispensers on the two study units that were used by the same group of HCWs. Data were analysed using SPSS Statistics, V.20 software (IBM Corp). A two-sided p value of 0.05 was considered to be statistically significant.
Findings
Summary of audits
There were 12 audits conducted between 29 November 2012 and 11 March 2013. Seven audits took place on one unit (designated ‘A’) and five on the other (‘B’). The audits were divided into 37 time periods when the auditor was in a fixed location for at least 5 min. The median duration of these time periods was 9 min, with a range from 5 to 39 min. The median duration of the time periods was 9 min on unit A and 12 min on unit B. The median number of dispensers included in each location was 20 (range 8–34), with a median of six in hallways and 13 inside patient rooms.
Exposed group
During the entire data collection period, a total of 562 304 ABHR dispenses and 218 473 soap dispenses were recorded. Of these, there were 230 hand hygiene events that occurred in the exposed group during audits, with 31 occurring inside patient rooms and 199 in hallways. Because there were few events inside patient rooms and more dispensers in rooms compared with hallways, the modal event rate in rooms was zero. The median event rates per dispenser per hour were zero in patient rooms, 3.75 in halls and 1.43 overall. Table 1 shows the median event rates in the exposed and unexposed groups, with the Wilcoxon signed rank test results where applicable.
Event rates in exposed and unexposed groups
Unexposed groups
In the unexposed group consisting of areas of the ward not visible to the auditors during the time of the audits, the median event rates per dispenser per hour were zero inside rooms and 1.48 in hallways. The total median event rate was 0.67. A Wilcoxon signed rank test showed that the exposed group had significantly higher event rates in hallways (Z=−3.39, p=0.001) and overall (Z=−2.65, p=0.008) compared with the unexposed group in a different location. There was no significant difference between the exposed and unexposed groups inside patient rooms (Z=−0.13, p=0.90).
The second unexposed group consisted of the same areas of the ward where the auditors were visible at the same time of day measured at 1, 2 and 3 weeks prior to the audit. One week prior to the audits, the median event rates per dispenser per hour were zero inside rooms and 1.07 in hallways, with a total rate of 0.58. The exposed group had significantly higher event rates in hallways (Z=−4.53, p<0.001) and overall (Z=−3.70, p<0.001) compared with the unexposed group 1 week prior to the audit, but there was no significant difference inside patient rooms (Z=−0.04, p=0.97). This pattern of findings was identical for the unexposed groups 2 and 3 weeks prior to the audits, with the exposed group having significantly higher rates in hallways and overall but no difference inside rooms. The event rates at 1, 2, and 3 weeks prior to the audits were not significantly different from each other.
The final unexposed group was made up of the locations where the auditors were located but in the time period 1–5 min prior to the auditors’ arrival. The median event rates per dispenser per hour in this group were zero inside rooms, 1.50 in hallways and 0.60 overall. The event rates in the exposed group were significantly higher after the auditors’ arrival in hallways (Z=−2.60, p=0.009) and overall (Z=−3.00, p=0.003), but there was no significant difference inside patient rooms (Z=−1.76, p=0.08).
Discussion
This study demonstrated that the hand hygiene event rate in soap and ABHR dispensers visible to auditors was significantly higher than in dispensers not visible to the auditors during the same time period and the same dispensers at the same time in prior weeks. This effect was seen only in hallways, where the auditors were located, and not inside patient rooms. The hand hygiene event rate increased significantly when auditors were present compared with 1–5 min prior to the auditors’ arrival, suggesting that the arrival of the auditor preceded the increase in hand hygiene. These results are consistent with the existence of a Hawthorne effect that is localised to areas where the auditor is visible to HCWs.
The Hawthorne effect is widely assumed to exist in hospital hand hygiene compliance monitoring, but the existing studies have significant methodological weaknesses. Most studies used direct observation to show that compliance rates were lower during covert audits than during audits that were announced in advance or conducted by auditors known to HCWs.7–10 This methodology is subject to selection and observer bias, particularly if the observers were not blinded to the hypothesis as may have been the case in these studies. Two other studies retrospectively assessed whether HCWs were aware of being observed, eliminating the need for observer blinding. However, one made an unsubstantiated assumption that awareness of the observer increases as the audit progresses,15 and the other used a survey to determine self-reported awareness of being observed.16 Another study avoided the biases of direct observation by demonstrating that soap and paper towel consumption tended to be higher during audit periods,17 which provides supporting evidence but may not correlate with compliance rates.12
A pilot study using an electronic monitoring system found that hand hygiene compliance was 88.9% during audits, compared with an overall compliance of 31.5% for the days when the audits took place.18 However, it was limited by a small sample size and the lack of controlling for potential confounders such as time of day; hand hygiene compliance has been shown to be higher during the day compared with night.14 Our study adds strong confirmatory evidence using a novel methodology that addresses the potential for confounding through the use of three unexposed comparison groups. Furthermore, it suggests that the Hawthorne effect occurs only in hallways that are within eyesight of the auditor, whereas previous studies were not able to localise the effect.
HCW hand hygiene compliance has long been a primary focus of infection prevention and control programmes, and more recently has captured the attention of governments and patient safety organisations. Several jurisdictions around the world now mandate public reporting of HCW hand hygiene compliance rates in hospitals as a quality improvement initiative. However, the magnitude of the Hawthorne effect seen in this study calls into question the accuracy of directly observed hand hygiene rates and the utility of measuring and reporting them.
Electronic monitoring systems have been promoted as an alternative to direct observation and the potential for bias appears to be lower, but they are not a panacea. A systematic review found limited and conflicting evidence regarding the accuracy of electronic systems.19 Furthermore, there may be substantial costs associated with installation and maintenance of such a system, as well as issues with the acceptability of this type of monitoring to HCWs.12 In addition, direct observation has some benefits not found in electronic monitoring systems, such as providing the opportunity for education of HCWs and currently being the only method that can assess technique and all indicated moments for hand hygiene.3 At present, each facility must weigh the relative costs and benefits to determine if and how to measure hand hygiene compliance rates, with the magnitude of the Hawthorne effect being only one factor to consider.
This study has several limitations, one being that it was not feasible to determine hand hygiene compliance rates. All HCWs and patients would have had to wear RTLS tags in order to calculate the number of hand hygiene opportunities as the denominator, but only enough staff tags were available for approximately a quarter of staff on the units. Instead, the RTLS measured soap and ABHR dispenses, but it is not possible to know who used the dispensers, whether the dispensed product was used for hand hygiene or whether hand hygiene was performed at an indicated moment. The event rate in the exposed group increased by between 250% and 350% when compared with unexposed times and locations, but it is not known whether the denominator also changed and thus whether there was a difference in compliance. However, in order for there to have been no change in compliance, the number of hand hygiene opportunities would have had to increase by a similar magnitude. It might be plausible to see a consistent increase in opportunities if the auditors were moving to areas where more activity was taking place, but the lack of increased event rate in the unexposed group prior to the auditors’ arrival shows that this is not the case.
A second limitation is the fact that the RTLS itself may have resulted in a Hawthorne effect and inflated hand hygiene event rates compared with baseline. However, the Hawthorne effect is believed to wane over time,20 and the RTLS had been operational for approximately 4 months prior to the start of this study.
Finally, this study was conducted on solid organ transplant units in an academic acute care hospital, and it is not known whether the findings would be generalisable to other healthcare settings involving different patient and HCW populations.
In conclusion, we used an RTLS to demonstrate that there is a significant Hawthorne effect in hand hygiene compliance monitoring. Further research is needed to clarify the magnitude and duration of the Hawthorne effect in different settings, and to determine characteristics of HCWs and auditors that may modify the effect. Ongoing quality improvement efforts will be necessary to improve hand hygiene compliance and reduce HAIs given that true hand hygiene compliance rates appear to be significantly lower than currently reported.
Acknowledgments
We thank Geoff Anderson for his contribution to study design, Laura Rosella and Monique Herbert for their advice on statistical analysis, and Gerald Evans and Whitney Berta for their editorial comments.
References
Footnotes
-
Contributors JAS, CDF, GRB and MG: conception, design of the study and article revision; JAS and CDF: data collection and analysis; JAS: writing the article.
-
Funding This work was supported by grants from Canada Health Infoway and the Health Technology Exchange, Infonaut Inc, and GOJO Industries.
-
Competing interests CDF reports personal fees from Infonaut Inc (the manufacturer of the RTLS used in this study) during the conduct of the study; personal fees from GOJO Industries Inc (the manufacturer of the soap and ABHR used in this study) outside the submitted work; and he has a patent PCT/CA2009/001776 ‘Disease mapping and infection control system and method‘ pending. JAS received salary support from the AMMI Canada/Astellas Post-Residency Fellowship.
-
Ethics approval University Health Network and University of Toronto Research Ethics Boards.
-
Provenance and peer review Not commissioned; externally peer reviewed.