Article Text

Abstract
Background Cardiothoracic surgical programmes face increasingly more complex procedures performed on evermore challenging patients. Public and private stakeholders are demanding these programmes report process-level and clinical outcomes as a mechanism for enabling quality assurance and informed clinical decision-making. Increasingly these measures are being tied to reimbursement and institutional accreditation. The authors developed a system for linking administrative and clinical registries, in real-time, to track performance in satisfying the needs of the patients and stakeholders, as well as helping to drive continuous quality improvement.
Methods A relational surgical database was developed to link prospectively collected clinical data to administrative data sources at Dartmouth-Hitchcock Medical Center. Institutional performance was displayed over time using process control charts, and compared with both internal and regional benchmarks.
Results Quarterly reports have been generated and automated for five surgical cohorts. Data are displayed externally on our dedicated website, and internally in the cardiothoracic surgical office suites, operating room theatre and nursing units. Monthly discussions are held with the clinical staff and have resulted in the development of quality-improvement projects.
Conclusions The delivery of clinical care in isolation of data and information is no longer prudent or acceptable. The present study suggests that an automated and real-time computer system may provide rich sources of data that may be used to drive improvements in the quality of care. Current and future work will be focused on identifying opportunities to integrate these data into the fabric of the delivery of care to drive process improvement.
- Cardiopulmonary bypass grafting
- outcomes
- quality improvement
- continuous quality improvement
- healthcare quality improvement
- microsystem
- statistical process control
- surgery
Statistics from Altmetric.com
- Cardiopulmonary bypass grafting
- outcomes
- quality improvement
- continuous quality improvement
- healthcare quality improvement
- microsystem
- statistical process control
- surgery
Introduction
Cardiothoracic surgical programmes are facing increasingly challenging patient demographic profiles. At the same time, external regulatory and third-party payers are driving institutions to report clinical performance from these procedures, as well as to identify efforts under way within programmes to improve continuously the quality of care delivered to patients.
Since 1987, staff and faculty at both Dartmouth Medical School and Dartmouth-Hitchcock Medical Center (DHMC), in conjunction with colleagues at the Northern New England Cardiovascular Disease Study Group (NNECDSG, http://www.nnecdsg.org/), have involved themselves in the measurement, organisation and improvement of the care provided to patients undergoing cardiac procedures.1–3 This work has resulted in a frameshift of the culture for providing care from data collection to active engagement. Increasingly, patients and clinicians are joint partners in the decision-making process for identifying the treatment that most appropriately meets the patient's preferences (http://www.dhmc.org/shared_decision_making.cfm).
The challenge being confronted within the context of care at DHMC was to turn the data provided by the NNECDSG and other internal data streams into actionable information that could be dispersed internally and externally not only to meet patient demands but more importantly to help drive quality-improvement initiatives. The context of care was such that providers were willing and engaged in the change initiative, but did not feel as if they had the information to support current and future initiatives. Last, the team wanted to know the results of their practice in ‘real time,’ in order to address unexpected deviations from desired performance.
We sought to provide both our internal and external customers with a complete package of information concerning our institution's performance for the conduct of coronary and valvular surgery. We report herein a method for linking administrative and registry data concerning cardiothoracic surgery to assist patients in making informed decisions and providers in driving continuous quality improvement.
Material and methods
In the spring of 2005, the cardiothoracic surgery section at Dartmouth-Hitchcock Medical Center (DHMC) streamlined its process for data collection and display. Previously, we had a complex, inefficient and labour-intensive system for collecting data within our cardiac surgical programme, and reporting it to our regional quality improvement collaborative, the Northern New England Cardiovascular Disease Study Group (NNECDSG).3 Although this system provided useful information, it was labour-intensive, requiring a full-time database manager and the utilisation of several disparate software tools.6 7 It lacked automation and failed to yield information in an expeditious manner.
Periodic reports were generated to track sectional performance by manually outputting the dataset to Microsoft Excel for graphic display and analysis. Case validation against administrative billing codes was conducted once every 2 years as required by the NNECDSG. Routine data processing through the system was user-intensive rather than automated, and its output was not always contemporaneous with the care provided to our patients.
The inefficiencies realised from the traditional manually driven system served as an impetus for redesigning it from the ground up. The section requested the development of a more robust system for tracking and reporting its performance. Key features of the programme included: (1) the ability to track performance measures in real time, (2) displaying results using Statistical Process Control charts, (3) validating procedural count in real time using administrative linkages, and (4) comparing DHMC performance with regional benchmarks.
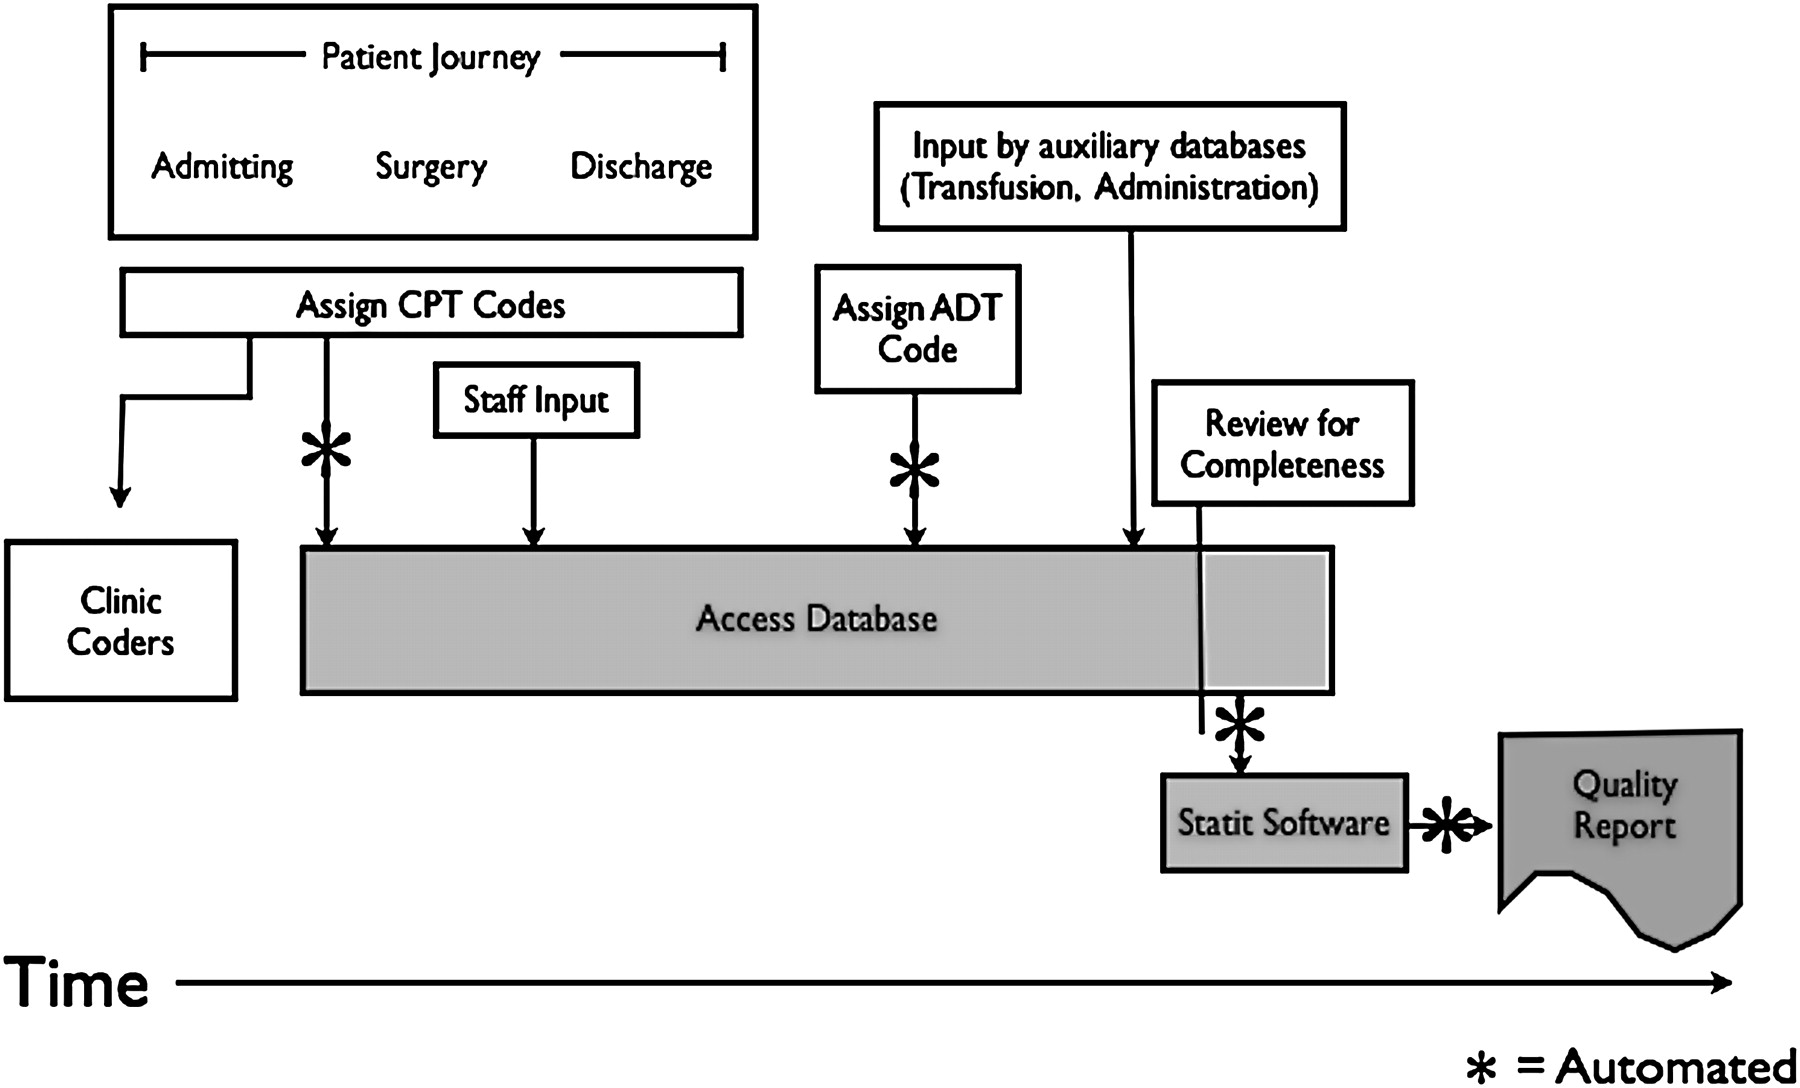
The design and implementation of the new system required a database programmer to dedicate 1 FTE for a period of 9 months. The entire system came at a cost of about $10 000 to the Cardiothoracic surgical section. The newer registry system utilises a relational database management tool (Microsoft SQL Server). All procedures of interest (CABG and/or valve repair or replacement) are entered into the clinical registry by a senior cardiovascular perfusionist. New cases are validated to the clinical registry within 24 h using Current Procedural Terminology (CPT) codes utilising a link to our institution's operating room schedule and database (figure 1). This linkage forces procedural count validity on the front end of the clinical registry to ensure a comprehensive and accurate accounting of all procedures. Patient satisfaction and financial charges for each procedure are captured subsequently through linkage with the administrative record based on a combination of the following: patient name and medical record number, date of admission and type of procedure. Data integrity is guaranteed through built-in data validation of each variable. Furthermore, graphs are built and automated from the registry itself using SPC theory (Statit, MIDAS+ Statit Solutions Group, Corvallis, OR). By automating this function, performance feedback is generated in less than 24 h, and provided in real time to our clinicians and external stakeholders. Patient confidentiality is maintained at all times, and only deidentified datasets are distributed to authorised personnel.

Flow of data into and out of cardiothoracic surgical registry, showing the inputs and outputs of current surgical registry, and the individuals responsible for each aspect of this process. ADT, admit discharge transfer; CPT, common procedural terminology.
The choice of display for each parameter is based on the type of data using established guidelines.4 Run charts, p-charts, CuSum charts and U-charts are used to monitor variation in parameters.4 The clinical team chooses the parameters to display in consultation with a cardiovascular epidemiologist, and a quality improvement expert facilitates performance improvement initiatives. Control limits are calculated at both two and three standard deviations. Rare outcomes are displayed using cumulative sum charts (CuSum) for surveillance. Regional rates for each outcome and cohort serve as the expected comparison value.
Results
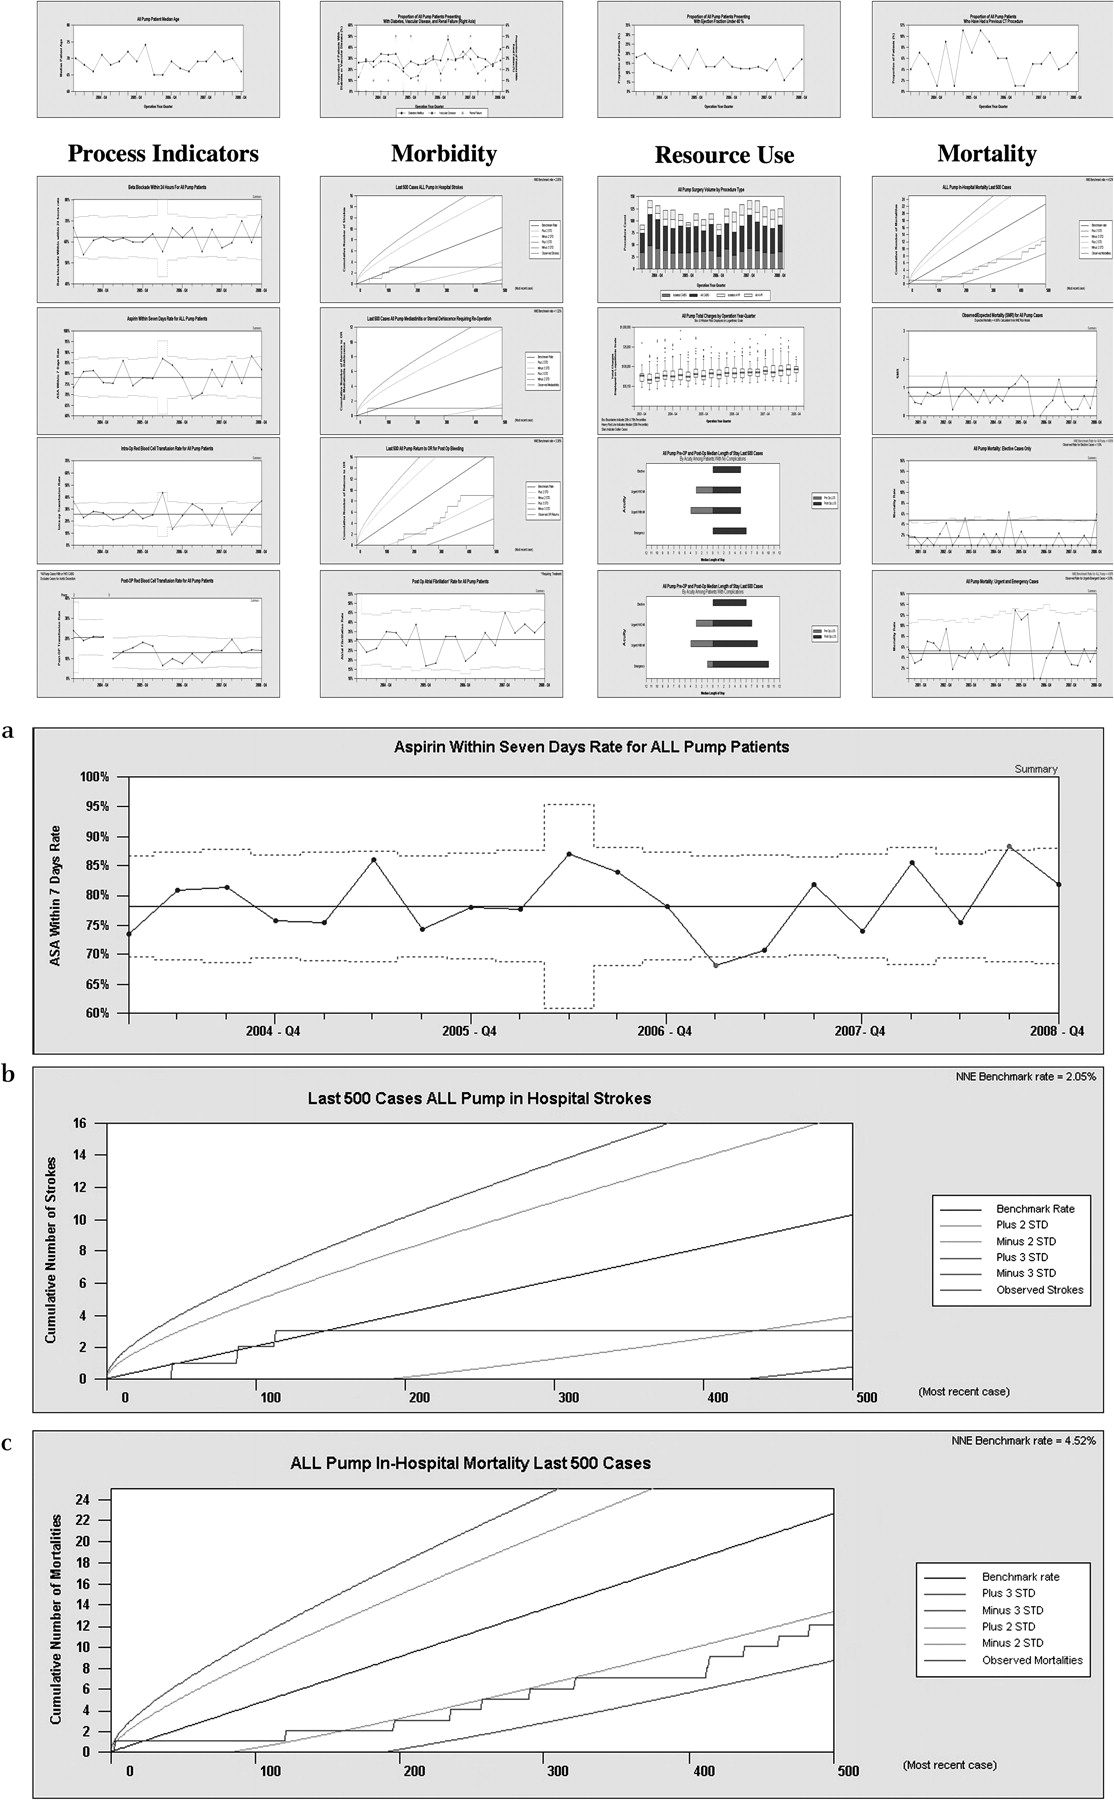
The current system aggregates and displays data over time concerning: process indicators, morbidity, resource utilisation, patient satisfaction and mortality (figure 2). Process control data are displayed graphically using Statit to distinguish between common and special cause variation. We have dedicated a wall in the cardiothoracic surgery offices for display of each surgical cohort (all CABG operations, all cases using a cardiopulmonary bypass machine, all valve operations, isolated aortic valve operations and isolated CABG operations) and have provided time during the monthly sectional meetings to discuss the section's performance. The data are also displayed in the operating room theatre on 50-inch plasma screen televisions as a continuous stream of images. This same method is used to display data in the postoperative nursing units to assist these team members in understanding our current performance, and affording this clinical microsystem with an opportunity to make informed choices for improving postsurgical care.

All cardiac surgery using a cardiopulmonary bypass at a glance from the second quarter 2002 to the fourth quarter 2008. The figure shows one surgical cohort's performance for the time period of the first quarter 2002 through the fourth quarter 2008. Information is divided into four parts: processes of delivering care, morbidity, resource use and mortality. In (A), in the third quarter of 2008, the cardiothoracic surgical team increased their adherence to aspirin protocols by more than 3 standard deviations (STDs). In (B), no strokes were detected in almost 400 cases. In (C), the rate of death is nearly 2 STDs below the expected rate.
Data displays
For each surgical cohort, we display information concerning processes of clinical care, morbidity, resource utilisation and mortality. An example of the CABG cohort is displayed in figure 2. These displays provide clinicians with information concerning system processes and outputs. All quality improvement initiatives are tracked using the displays, and clinicians are able to monitor their performance over time. Space is provided on the display for each process indicator that we measure, all factors relating to morbidity and mortality, and any specific resource utilisation that the team is interested in tracking (figure 2A–C).
The display shown in figure 2 is printed and hung on the wall quarterly, projected digitally in the operating room computers, and accessible any time via personal computer. Data and information are thus readily available during an initial patient work-up, in the OR suite, on the floor or in a follow-up visit.
Providing information to frontline teams
Providers and patients benefit from the availability of accurate reliable data during the process of care. We recently reported our experience aimed at rationalising the management and treatment of anaemia during cardiac surgery.5 Using the new system to monitor and measure the team's performance, while providing immediate feedback, our team reduced its transfusion rate by more than three standard deviations in the operative setting. This result was achieved by providing continuous feedback of the team's performance related to the indications for each red blood cell transfusion. Our new database system enabled our team to receive accurate, reliable and timely information back to the frontline providers. These results are to the benefit of both the clinician who is providing the highest level of care possible, and the patient who is avoiding unneeded blood transfusions.
While early on in this process, we targeted our stream of data displays to the surgical team (in the operating room and section offices), we soon recognised that many of our providers did not have convenient access to this information. For instance, our nursing staff, while regular attendees to our monthly section meetings, did not frequently transit the sectional offices. However, the care they provided in the postoperative setting had a direct impact on the transfusion rates and other morbid events. We have recently targeted this constituency with a second set of dashboards, containing all of the same information as provided to the other clinical staff members. The data displays are housed within the nursing conference rooms, which are used both formally and informally by all of the postoperative care givers.
Satisfaction
Additionally, while not shown on figure 2, a random subset of patients were queried regarding their satisfaction (table 1). The results of those queries are posted alongside the data displays to supplement the information being fed back to staff members.
Quality data reported on the Dartmouth-Hitchcock Medical Center quality reports website
Sharing data with external stakeholders
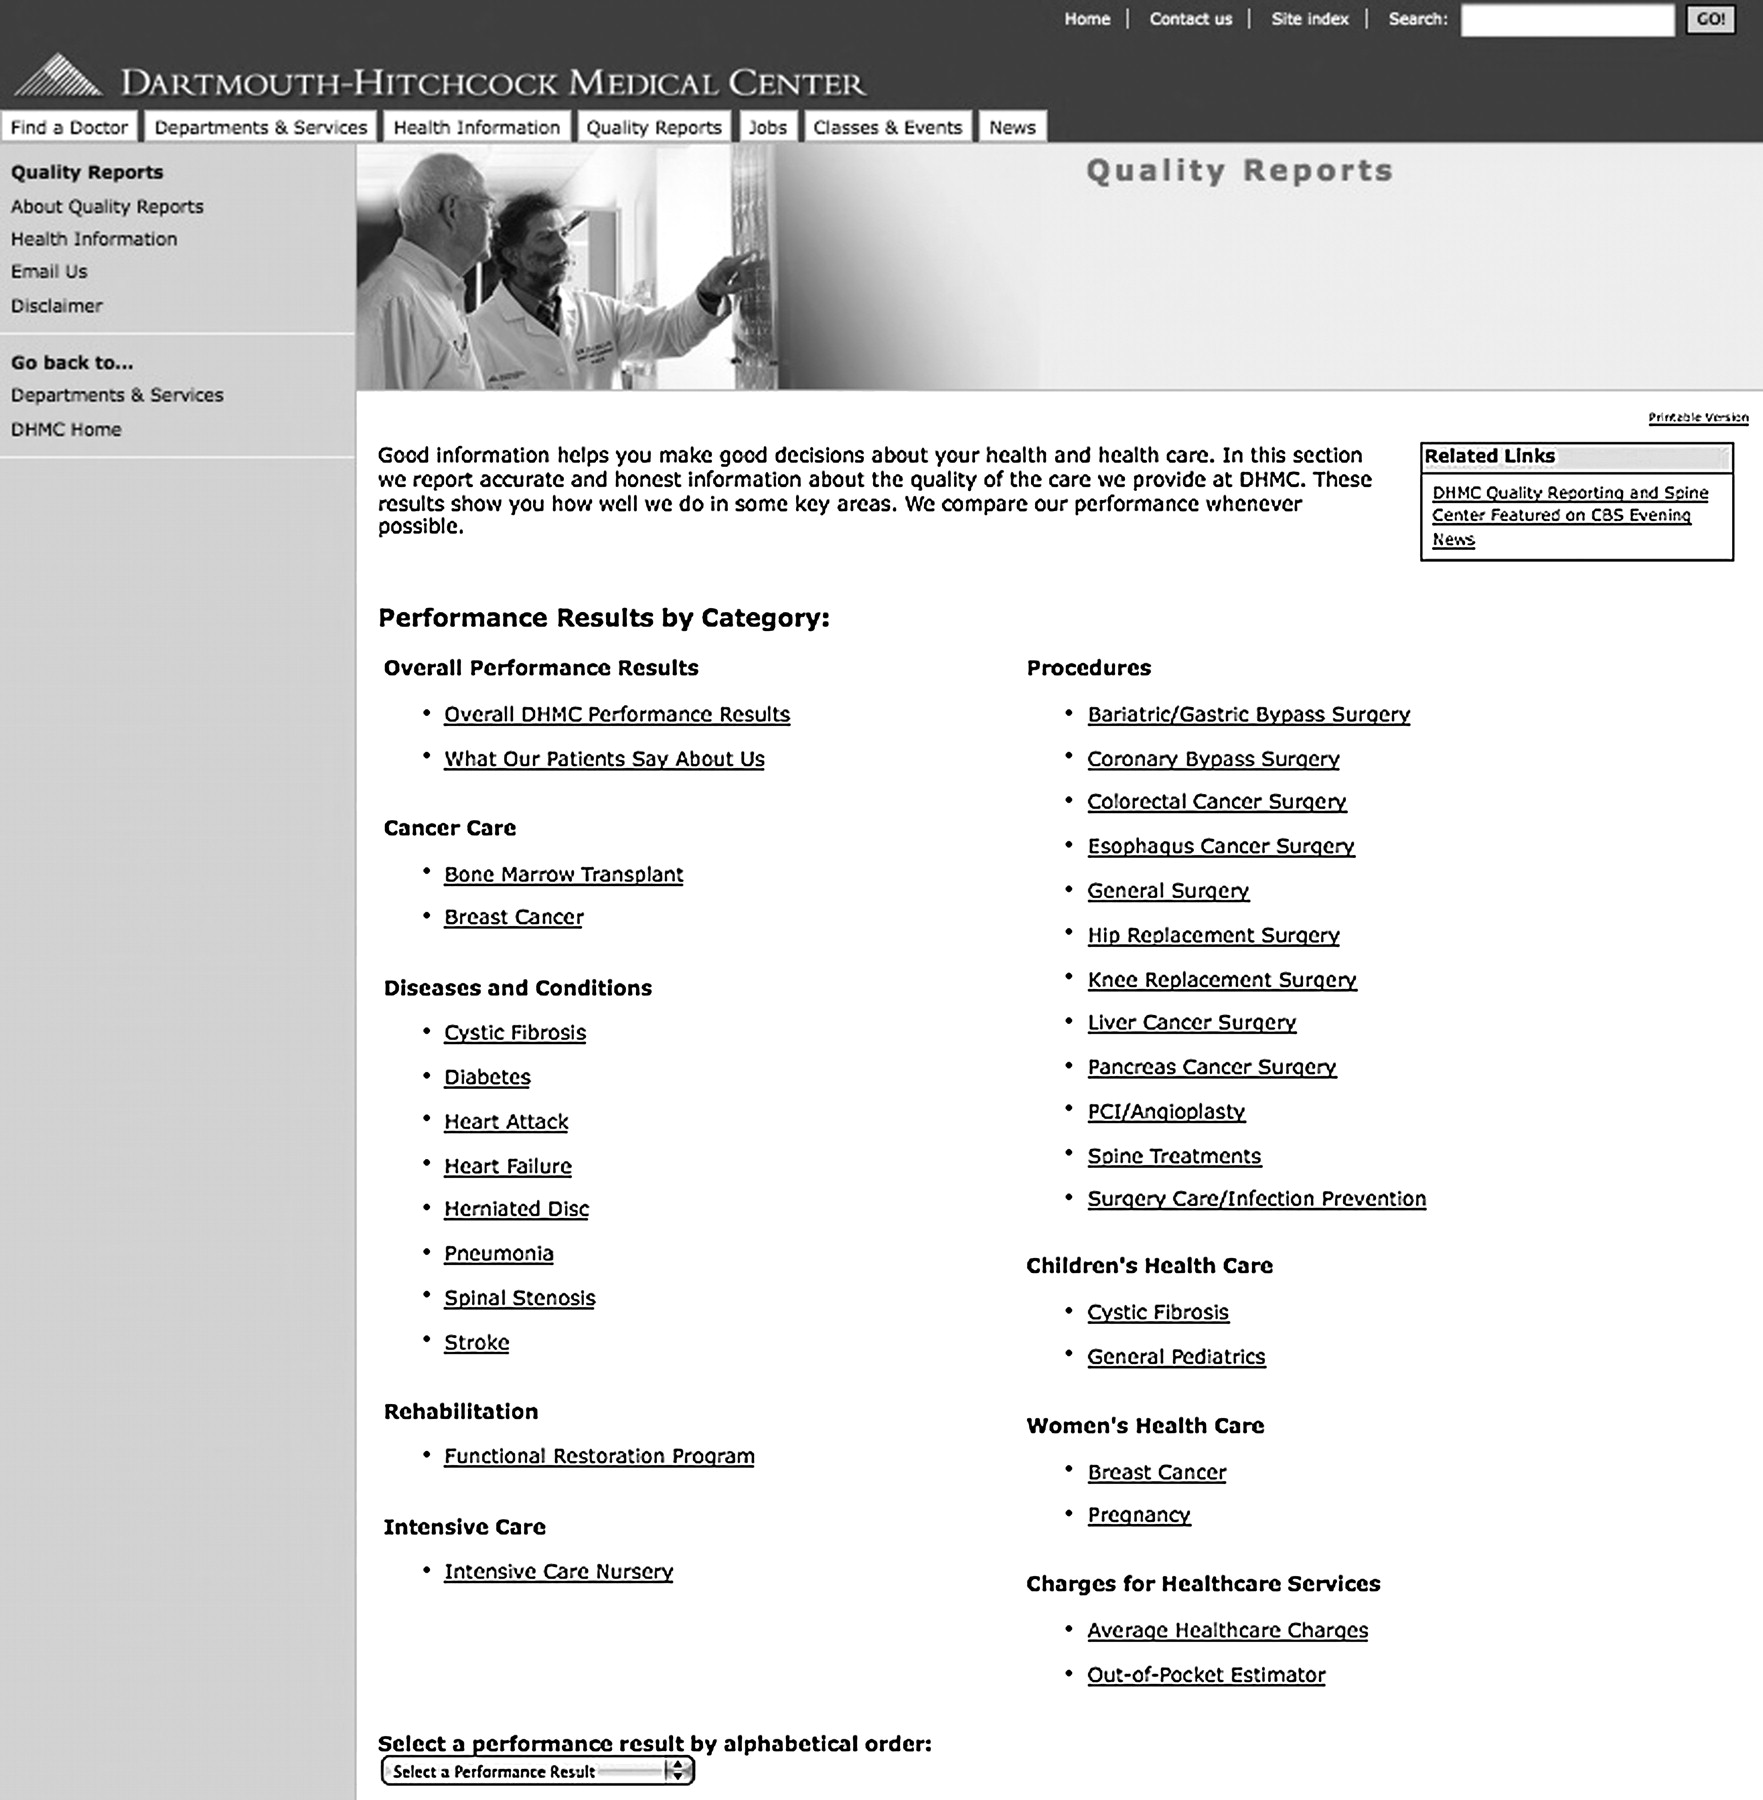
This registry also affords the ability to share information openly with our patients and key stakeholders via our institution's internet site, http://www.dhmc.org/QualityReports (figure 3). Information placed on this website is audited by the institution's auditing department and updated annually. This website empowers patients by providing reliable information regarding their disease condition, and allowing them to make more informed decisions about their health and healthcare.2 Methods for developing this quality reports website have been published previously.6
Dartmouth-Hitchcock Medical Center quality reports website main page, showing the main webpage of our quality reports website. Heart surgery is one of many groups represented on this site.
Discussion
Summary
In the future, we believe a method for real-time tracking and reporting of a cardiothoracic surgery programme's performance will be required. Our system merges administrative and primary data collection to service the needs of all stakeholders, including the clinical staff, administration and patients concerning the major cardiac surgical cohorts at our institution.
Relation to other evidence and limitations
We sought to use real-time information to frontline providers to drive quality-improvement initiatives and give patients information for making informed choices. There is a variety of literature concerning the effectiveness of publicly reporting quality data to drive improvement initiatives.2 3 9 10 Our cardiothoracic section and institution have embraced internal and external transparency as a means for driving performance improvement. A potential limitation in our methodology is our staff's ability to understand and digest statistical process control displays. While our clinical staff have been exposed to the theory and interpretation of SPC charts for some time, we are cognisant that we should not assume uniformity of this skill set across all practitioners. To this end, we use dedicated time during our sectional meetings to afford these stakeholders the opportunity to ask any questions they might have regarding our performance results. For our external stakeholders, we have a dedicated email address on the website where visitors may post questions regarding our performance results.
Interpretation
Healthcare institutions have traditionally had two primary roles: (1) provide evidence-based care and (2) receive reasonable reimbursement for services rendered. In the relatively new environment of transparency and pay-for-performance, healthcare organisations are being ‘asked’ by regulatory and financial stakeholders additionally to measure the quality of care provided to patients to identify unwanted variation in performance, and to enable shared decision-making. This transparency environment is now beginning to impact an organisation's ability to receive reimbursement for services. While still hotly debated, the spirit of this additional responsibility is to stimulate introspection on the part of the clinical team, and to promote quality improvement activities and thereby maximise the value (quality/cost) of the healthcare system.7–9 However, transparency is only as effective if it is seated within an accurate and reliable data-collection system.
We have seated these data-rich environments within the clinical microsystem in which care is provided (http://cms.dartmouth.edu/).10 Data to enrich this microsystem may come from a variety of sources, and may reflect any number of facets (both clinical and non-clinical). The importance lies within the clinical team identifying a variety of outcome and process metrics that could be used for quality-improvement initiatives. These data when appropriate is benchmarked to our NNECDSG regional cohort.1 3 The clinical microsystem chooses how to redesign the care it provides to improve its performance, and uses its data reports to ascertain the benefit of its redesign efforts.
Through this quality-improvement initiative, we have learnt that transforming data into information relies on two key processes. First, systems must be in place to allow timely data collection and analysis. Second, there must be a process in place to feedback that data in a useful way to the point of care. Metrics must be important to the members of the staff doing the work and actionable from the microsystem's standpoint. Unreliable and inaccurate data are counterproductive and undermine the staff's ability to invoke change in the systems within which they work.
Conclusion
DHMC's cardiothoracic surgery programme has developed and implemented a two-pronged approach for collecting and distributing data to our internal and external stakeholders. This information is timely, accurate and reliable due to the automated relational database design, and its integration with our administrative data sets. Through the integration of this system into our Department of Surgery, we have seen improvements in the quality of care being delivered, are able to sustain and support quality-improvement projects with real-time information about the system and are able to generate reports that are available to clinicians and other key stakeholders.
We have provided evidence demonstrating the feasibility and results of providing front-line clinical staff with reliable, accurate and real-time data that are necessary for improving the quality of care. This new system has been successfully applied to vascular surgery in an attempt to test its feasibility outside cardiac surgery. We believe this system can be implemented in any surgical or medical section that desires a method for accessing their data in a real-time functional manner.
Footnotes
Competing interests None.
Provenance and peer review Not commissioned; externally peer reviewed.
Linked Articles
- Quality lines