Article Text

Abstract
Background This paper presents the findings of a 13-month lean implementation in National Health Service (NHS) primary care health visiting services from May 2008 to June 2009.
Method Lean was chosen for this study because of its reported success in other healthcare organisations. Value-stream mapping was utilised to map out essential tasks for the participating health visiting service. Stakeholder mapping was conducted to determine the links between all relevant stakeholders. Waste processes were then identified through discussions with these stakeholders, and a redesigned future state process map was produced. Quantitative data were provided through a 10-day time-and-motion study of a selected number of staff within the service. This was analysed to provide an indication of waste activity that could be removed from the system following planned improvements.
Results The value-stream map demonstrated that there were 67 processes in the original health visiting service studied. Analysis revealed that 65% of these processes were waste and could be removed in the redesigned process map. The baseline time-and-motion data demonstrate that clinical staff performed on average 15% waste activities, and the administrative support staff performed 46% waste activities.
Conclusion Opportunities for significant waste reduction have been identified during the study using the lean tools of value-stream mapping and a time-and-motion study. These opportunities include simplification of standard tasks, reduction in paperwork and standardisation of processes. Successful implementation of these improvements will free up resources within the organisation which can be redirected towards providing better direct care to patients.
- Primary care
- process mapping
- healthcare quality improvement
- family medicine
Statistics from Altmetric.com
Introduction
Health visiting services in the NHS
Health visitors (HV) are public health nurses working with children up to 5 years old and their families. They are responsible for delivering early intervention, prevention and health promotion for young children and families.1 In recent years, the demand for health visiting services has increased due to the greater social, cultural, racial and geographical diversity in the UK.2 Services are under pressure to deliver care to more patients with constrained resources.3 There is now a need to improve healthcare by transferring the philosophies, tools and methods from other industry sectors.4 These methods include Total Quality Management (TQM),5 the Toyota Production System (TPS),6 six sigma7 and lean.8 ,9 This study focuses on the applicability of lean within NHS primary care HV services.
Background to lean
The origins of lean date back to the 1900s in the manufacturing industry; an overview of lean development is presented in figure 1. Lean is a quality improvement philosophy which aims to create more value with less resource. It seeks to identify and eliminate waste (muda) through use of selected tools such as the value-stream map.10 The Toyota approach differs slightly; it aims to highlight areas of waste by eliminating unevenness (mura) and overburden (muri). Methods to improve flow for example production smoothing (heijunka) and use of pull production, where customer demand pulls work through the system rather than targets pushing, aid in the elimination of waste. The success of lean in the manufacturing and service sectors has led to its gradual introduction into US and Canadian healthcare as a means to improve productivity.11–14 However, in 1999 a report by the Institute of Medicine (IOM) highlighted that 98 000 people die unnecessarily every year in US hospitals. This focused improvement methods on patient satisfaction rather than productivity.15 Thus, schemes such as ‘perfecting patient care’ developed by the Pittsburgh Regional Healthcare Initiative have developed into the benchmark for healthcare operations.6
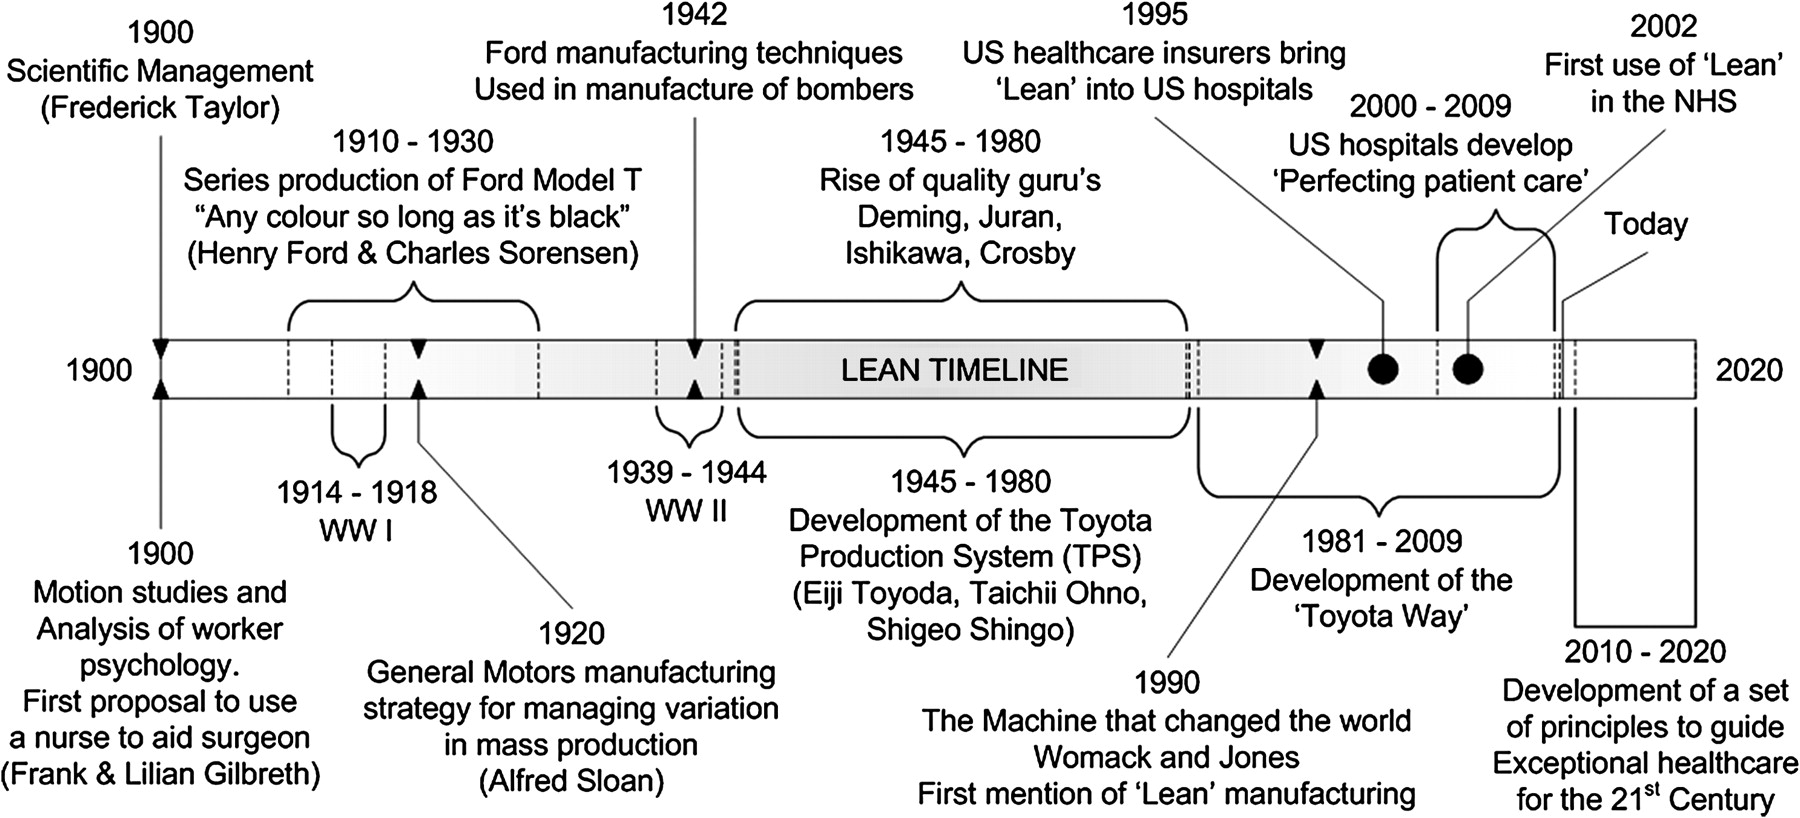
Overview of lean development.
The NHS began its own lean initiative in 2002, which resulted in a number of successes in hospital trusts across the East of England3 and in Bolton where they reduced their paper work by 42%, reduced length of stay by 33% and achieved improved multidisciplinary working.9 These initiatives used techniques introduced by the NHS Modernisation Agency11 ,12 and subsequently developed by the NHS Institute for Innovation and Improvement16 into The Productive Ward series.13 There is now a body of evidence to suggest that quality-improvement methods are beneficial in healthcare, although there is no consensus on the ideal method.5–10 This study reports the findings from a lean project within a HV service in the UK.
Methodology
This study was conducted over a 13-month period between May 2008 and June 2009 within a health visiting (HV) service in a large Primary Care Trust (PCT) in the UK. The PCT employs approximately 2400 staff and serves a population of 217 000. The head of service wished to increase ‘time to care’ and reduce waste in order to meet increasing future demand with less resource. Lean was selected as the method for improvement based on its reported success in other healthcare organisations.3 ,9 ,14
A ‘Lean Thinking’ project team was established within the HV service. The staff were selected from a range of roles across the service, including eight clinical, two managerial and three administrative staff. There were no formalised roles or allocated project champions within the team. They took part in eight workshops at regular intervals throughout the project to bring the team together so they can learn from each other and share ideas. The team were assisted by external ‘lean’ consultants who provided 25 days of support inclusive of workshops, board meetings and feasibility sessions. During the early workshops the team determined that the greatest opportunity for improvement lay in the process steps within the patient pathway between new birth notification from the midwife through to the first patient visit 10–14 days post birth. This was perceived as a crucial aspect of the service that could potentially add the most value to their patients.
A value-stream map of this process was created across three workshops through team discussion and placement of notes on a swim lane diagram. The sessions were led by a consultant. The map was used as a baseline so that future improvements could be highlighted. The eight workshops provided the opportunity for group discussions to identify tasks and activities that they perceived did not add value to the patient. This was essential in demonstrating the complexity and scope for improvement to senior management.
Further quantitative analysis was performed using data collected over a 10-day ‘time-and-motion’ study of seven clinical staff days and three administrative support staff (ASS) days within two health visiting departments. Daily tasks were recorded based on type and time spent to produce a baseline waste metric. Value-added (VA) tasks were defined as those that were valuable to the patient. The non-value added (NVA) but business essential tasks were those that were required to keep the service functioning. Waste tasks were those that did not add value to the patient or contribute to efficient running of the service. The activities carried out by HVs are broken down into VA, NVA and waste, and displayed in figure 2. The breakdown of activities for ASS is presented in table A1.

Diagram characterising the activities undertaken by health visitors (HV) into value added, non-value added but business essential and waste. DNA, do not attend.
ASS activities divided into three categories
These distinctions were made through team discussions during the workshops. All tasks carried out by the staff were categorised using open participant discussion. It is recognised that the distinction of value for patients was as perceived by the project team, not the patients, who primarily value face-to-face contact with health professionals. However, there are many tasks which must be carried out in order to deliver a safe and effective service that are likely to go unrecognised by patients—for example, contact with social care services and other clinical departments. For this exercise, these tasks were considered to be VA, since they are of direct benefit to the patient.
Results
Value steam mapping and stakeholder mapping
Value-stream mapping (VSM) and stakeholder mapping exercises were carried out by the project team over 3 months. The stakeholder map is presented in figure 3; it demonstrates the complex communication links between all stakeholders providing care to the family.

Stakeholder map demonstrating the communication links between all stakeholders providing care to the family. HV, health visitor.
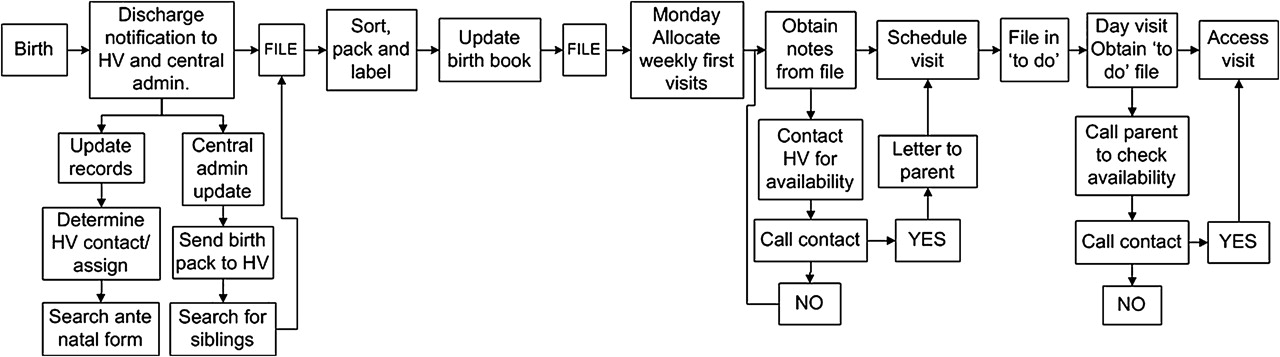
The results obtained from VSM are presented in figure 4 and demonstrate the patient pathway in the health visiting service from notification of a new birth through to the first patient visit. It elucidates the large number of processes that are required to carry out this task and the complexity involved. Table 1 presents the total number of process steps and the number that were identified as waste for each task. In each case, 86% of the processes were categorised as waste.

Value steam map of the health visiting service patient pathway from receipt of new birth notification to first patient visit. HV, health visitor.
Process steps identified during a value-stream-mapping exercise
One of the aims for the lean thinking project team was to redesign the selected patient pathway to eliminate the waste process steps. The decisions on which steps and activities to remove were made through workshop discussions with clinical, managerial and administrative staff. The redesigned process map is presented in figure 5. It contains 23 steps versus the original 67. This represents a 65% decrease in the number of processes required to carry out the birth notification and arrange first visit tasks.

Redesigned process map of the health visiting service patient pathway from receipt of new birth notification to first patient visit. HV, health visitor.
Time-and-motion study
Results from the analysis of the 10-day time-and-motion study are presented in figure 6. It demonstrates the percentage of time that clinical staff and ASS spent on VA, NVA, and waste activities.

Graph of value added, non-value added (NVA) and waste for clinical and administrative support staff over 10 working days.
Clinical staff
Figure 6 indicates that clinical staff spent a mean of 56% (range 12–70%) of their time on VA activity, 29% (range 15–65%) on NVA activities and 15% (range 24–63%) on wasteful activities. Examples of waste activities were completing multiple statistics forms and searching for patient paperwork. In addition, they wasted time travelling unnecessarily, attempting to contact people by telephone and waiting for electronic resources to perform a task.
Administrative support staff (ASS)
ASS spent 0% of their time on VA work. A mean of 53% (range 37–76%) of their time was spent on NVA tasks. The remaining 47% (range 24–63%) was categorised as waste, which included tasks such as searching for patient records and information for example names and addresses, and duplication of statistical data entry. Other miscellaneous activities included opening secure doors, tidying offices and dealing with external contractors.
Discussion
Lean is currently the main focus of attention for process improvement in the NHS.17 The literature available on lean healthcare is continually growing both within the UK3 ,9 ,14 and internationally.16 ,18 ,19 However, lean implementation to date has been limited to hospital care, which is surprising considering 80% of NHS spending is in primary care.20 The lean tools utilised during this study into primary care included stakeholder mapping, VSM and time-and-motion studies. Identification of waste processes was relatively straightforward; the challenging aspect was how to remove the waste and sustain the identified improvements in the future. The complexity of the organisation meant that a large number of stakeholders had to be involved to implement even the simplest change. It became clear that meaningful change would require input from management across many departments.
Nevertheless, the VSM exercise demonstrated opportunities for improvement, as it highlighted high levels of waste present in the analysed tasks. Figure 4 demonstrates the original 67 process steps from the point of birth notification to the initial patient visit. Of these, 58 were identified as waste and were removed. This enabled the project team to redesign the services and develop a new process map, which contained only 23 process steps. In order to achieve this, it was necessary to involve other stakeholders, who included social care and central administration.
It was essential for the project team to remain motivated during the lean exercise, and so a number of small areas of waste were highlighted for immediate attention. One notable example was the process local ASS followed to contact central administration. Initially, the ASS would wait until they had large quantities of documents before despatching them in weekly batches to central administration. This resulted in document processing delays, which gave rise to extended waits to book and rebook patient appointments. It also led to high levels of staff stress through uneven workload. The solution presented by the team was to introduce more document envelopes that could be despatched daily. This example of a ‘quick win’ eliminated batching of documents and shortened the average wait for a new appointment from 1 week to 2 days.
It is important not to get too carried away with these small victories. The team identified high levels of ‘do not attend’ (DNA) appointments, which are wasteful in terms of HV time and associated administration of rebooking appointments. The solution that was implemented was to establish a short message service (SMS) to remind patients of their appointments. This has been implemented successfully in other services.21–23 In this instance, the service had a problem with obtaining and retaining patient mobile telephone numbers, so in many cases an SMS could not be sent, and the additional administrative burden was actually wasteful. It is vital to ensure that the root cause of any waste is identified prior to a solution being implemented.
A time-and-motion study was conducted to quantify the waste identified during VSM. The results indicated that ASS performed 0% VA work since value was defined as work that is directly valuable to the patient. ASS do not come into contact with patients. Their role is to ensure the smooth and effective running of the service, as indicated by the average 53% (range 37–76%) NVA business essential work conducted; this enables clinical staff to deliver value to their patients. It was evident from the analysis that certain centres operate more efficiently than others. In particular, centres with fulltime ASS had standardised processes to which the teams adhered. Centres with a number of school term or flexi-working ASS had greater levels of staff confusion and stress. Hence, there are excellent opportunities for process standardisation using lean tools such as 5S. This tool contains five steps that help to create an ideal workplace by organising, cleaning and reducing waste.16
The clinical staff performed an average of 56% (range 12–70%) VA work. The significant spread on these results is due to the variation in day-to-day activities performed. On high-value days, the clinical staff spent the majority of their time with patients. Low-value days were spent primarily on management activities or searching for patient information and notes.
The future aims for the HV service determined by the project team during the VSM exercise suggest that clinical staff including health visitors, nursery and community nurses should perform 0% waste activity. ASS should focus on decreasing their waste and work towards 100% NVA work. It must be noted that the findings of this case study are based on one PCT within one region of the UK. Therefore, the results generated from this study may not be comparable with other PCTs. However, the lean process followed, and the tools implemented during this case study can be applied to other HV services operating in the UK.
This study had several limitations, which were principally a team that varied over time and a lack of organisational and managerial support. Throughout the lean project, core staff were often unavailable to participate in the workshops, project board meetings and presentations due to other commitments, absence, holidays and role changeovers. Every stage of the transformation to lean was faced with multiple barriers which slowed or inhibited progress. In addition, the project was put on hold for 4 months, as the service experienced changes in the managerial roles and responsibilities. This had a disruptive influence on the initial aims and goals of the lean exercise and the overall sustainability and implementation of the improvements identified.
Conclusion
The current state value-stream map for birth notification in the health visiting service at a large UK Primary Care Trust (PCT) identified a total of 67 processes, of which 58 were identified as waste. The redesigned process map had 23 processes demonstrating a potential saving of 65% in the number of processes required for birth notification and arrangement of the initial visit.
The time-and-motion study defined a benchmark level of performance for future improvement activity. Results indicated that clinical staff in a health visiting service in a large UK PCT spent 56% (range 12–70%) of their time on work which directly benefits their patients. The remainder is spent on non-value added but business essential work (29% range 15–65%) and 15% (range 24–63%) on waste. Administrative support staff performed 0% VA work, since value is defined as being of direct benefit to the patient. They performed 53% (range 37–76%) of NVA business essential work, and the remainder is spent on waste activities. It is important to note the administrative support staff role is essential to free up clinical staff for VA work.
This study has demonstrated the opportunities for significant waste reduction in a HV service in the UK. A large amount of waste could be eliminated through simplification and standardisation of day-to-day tasks and without the need for any expensive or time-consuming organisational changes. Members of the lean thinking team continue to make small improvements in their respective areas, but changes in organisational culture and management practice will be required to provide a supportive environment for change in the future. Management support that spans the entire organisation will be required to implement future lean initiatives and ensure that they are sustained.
Acknowledgments
S Bestwick at Alexander, P Almond at University of Southampton and C Bourne at University of Warwick.
Appendix A
In this study, VA work was defined as tasks that are valuable to the patient. The NVA, but business-essential, tasks were those that must occur to keep the service functioning, the patients may be unaware of these ‘back office’ activities. Waste tasks were those that could be eliminated from the processes, as they do not add value to the patient or contribute to efficient running of the service.
References
Footnotes
Funding Warwick Innovative Manufacturing Research Centre International Manufacturing Centre, University of Warwick, Coventry, CV4 7ALUK.
Competing interests None.
Provenance and peer review Not commissioned; externally peer reviewed.