Article Text

Abstract
Background Diagnostic errors in primary care are harmful but difficult to detect. The authors tested an electronic health record (EHR)-based method to detect diagnostic errors in routine primary care practice.
Methods The authors conducted a retrospective study of primary care visit records ‘triggered’ through electronic queries for possible evidence of diagnostic errors: Trigger 1: A primary care index visit followed by unplanned hospitalisation within 14 days and Trigger 2: A primary care index visit followed by ≥1 unscheduled visit(s) within 14 days. Control visits met neither criterion. Electronic trigger queries were applied to EHR repositories at two large healthcare systems between 1 October 2006 and 30 September 2007. Blinded physician–reviewers independently determined presence or absence of diagnostic errors in selected triggered and control visits. An error was defined as a missed opportunity to make or pursue the correct diagnosis when adequate data were available at the index visit. Disagreements were resolved by an independent third reviewer.
Results Queries were applied to 212 165 visits. On record review, the authors found diagnostic errors in 141 of 674 Trigger 1-positive records (positive predictive value (PPV)=20.9%, 95% CI 17.9% to 24.0%) and 36 of 669 Trigger 2-positive records (PPV=5.4%, 95% CI 3.7% to 7.1%). The control PPV of 2.1% (95% CI 0.1% to 3.3%) was significantly lower than that of both triggers (p≤0.002). Inter-reviewer reliability was modest, though higher than in comparable previous studies (к=0.37 (95% CI 0.31 to 0.44)).
Conclusions While physician agreement on diagnostic error remains low, an EHR-facilitated surveillance methodology could be useful for gaining insight into the origin of these errors.
- Diagnostic errors
- primary care
- patient safety
- electronic health records
- triggers
- automated surveillance
- error detection
- information technology
- trigger tools
- diagnostic errors
- health services research
- diabetes mellitus
- statistical process control
- statistics
- simulation
- quality improvement methodologies
- healthcare quality improvement
- teamwork
- safety culture
Statistics from Altmetric.com
- Diagnostic errors
- primary care
- patient safety
- electronic health records
- triggers
- automated surveillance
- error detection
- information technology
- trigger tools
- diagnostic errors
- health services research
- diabetes mellitus
- statistical process control
- statistics
- simulation
- quality improvement methodologies
- healthcare quality improvement
- teamwork
- safety culture
Background
Although certain types of medical errors (such as diagnostic errors) are likely to be prevalent in primary care, medical errors in this setting are generally understudied.1–7 Data from outpatient malpractice claims2 8–10 consistently rank missed, delayed and wrong diagnoses as the most common identifiable errors. Other types of studies have also documented the magnitude and significance of diagnostic errors in outpatient settings.11–17 Although these data point to an important problem, diagnostic errors have not been studied as well as other types of errors.18–20 These errors are difficult to detect and define9 and physicians might not always agree on the occurrence of error. Methods to improve detection and learning from diagnostic errors are key to advancing their understanding and prevention.19 21 22
Existing methods for diagnostic error detection (eg, random chart reviews, voluntary reporting, claims file review) are inefficient, biased or unreliable.23 In our preliminary work, we developed two computerised triggers to identify primary care patient records that may contain evidence of trainee-related diagnostic errors.24 Triggers are signals that can alert providers to review the record to determine whether a patient safety event occurred.25–29 Our triggers were based on the rationale that an unexpected hospitalisation or return clinic visit after an initial primary care visit may indicate that a diagnosis was missed during the first visit. Although the positive predictive value (PPV) was modest (16.1% and 9.7% for the two triggers, respectively), it was comparable with that of previously designed electronic triggers to detect potential ambulatory medication errors.30 31 Our previous findings were limited by a lack of generalisability outside of the study setting (a Veterans Affairs internal medicine trainee clinic), poor agreement between reviewers on presence of diagnostic error and a high proportion of false positive cases that led to unnecessary record reviews.
In this study, we refined our prior approach and evaluated a methodology to improve systems-based detection of diagnostic errors in routine primary care. Our ultimate goal was to create a surveillance method that primary care practices could adopt in the future in order to start addressing the burden of diagnostic errors.
Methods
Design and settings
We designed electronic queries (triggers) to detect patterns of visits that could have been precipitated by diagnostic errors and applied these queries to all primary care visits at two large health systems over a 1-year time period. We performed chart reviews on samples of ‘triggered’ visits (ie, those that met trigger criteria) and control visits (those that did not meet trigger criteria) to determine the presence or absence of diagnostic errors.
Both study sites provided longitudinal care in a relatively closed system and had integrated and well-established electronic health records (EHRs). Each site's electronic data repository contained updated administrative and clinical data extracted from the EHR. At Site A, a large Veterans Affairs facility, 35 full-time primary care providers (PCPs) saw approximately 50 000 unique patients annually in scheduled primary care follow-up visits and ‘drop-in’ unscheduled or urgent care visits. PCPs included 25 staff physician–internists, about half of whom supervised residents assigned to them half-day twice a week; the remaining PCPs were allied health providers. Emergency room (ER) staff provided care after hours and on weekends. At Site B, a large private integrated healthcare system, 34 PCPs (family medicine physicians) provided care to nearly 50 000 unique patients in four community-based clinics, and about two-thirds supervised family practice residents part time. Clinic patients sought care at the ER of the parent hospital after-hours. To minimise after-hours attrition to hospitals outside our study settings, we did not apply the trigger to patients assigned to remote satellite clinics of the parent facilities. Both settings included ethnically and socioeconomically diverse patients from rural and urban areas. Local Institutional Review Board approval was obtained at both sites.
Trigger application
Using a Structured Query Language-based program, we applied three queries to electronic repositories at the two sites to identify primary care index visits (defined as scheduled or unscheduled visits to physicians, physician–trainees and allied health professionals that did not lead to immediate hospitalisations) between 1 October 2006 and 30 September 2007 that met the following criteria:
Trigger 1: A primary care visit followed by an unplanned hospitalisation that occurred between 24 h and 14 days after the visit.
Trigger 2: A primary care visit followed by one or more unscheduled primary care visits, an urgent care visit, or an ER visit that occurred within 14 days (excluding Trigger 1-positive index visits).
Controls: All primary care visits from the study period that did not meet either trigger criterion.
The triggers above were based on our previous work and refined to improve their performance (table 1). Our pilot reviews suggested that when a 3- or 4-week interval between index and return visits was used, reasons for return visits were less clearly linked to index visit and less attributable to error. Thus, a 14-day cut-off was chosen. In addition, we attempted to electronically remove records with false positive index visits, such as those associated with planned hospitalisations.
Rationale of trigger modifications from previous work24
Data collection and error assessment
We performed detailed chart reviews on selected triggered and control visits. If patients met a trigger criterion more than once, only one (earliest) index visit was included (unique patient record). Some records did not meet the criteria for detailed review because the probability of us being able to identify an error at the index visit using this methodology would be nil for one of the following reasons: absence of any clinical documentation at index visit; patient left the clinic without being seen at the index visit; patient only saw a nurse, dietician or social worker; or patient was advised hospitalisation at index visit for further evaluation but refused. For the purposes of our analysis, these records were categorised as false positives, even though some of these could contain diagnostic errors.
Eligible unique records were randomly assigned to trained physician–reviewers from outside institutions. Reviewers were chief residents and clinical fellows (medicine subspecialties) and were selected based on faculty recommendations and interviews by the research team. They were blinded to the goals of the study and to the presence or absence of triggers. All reviewers underwent stringent quality control and pilot testing procedures and reviewed 25–30 records each before they started collecting study data. Through several sessions, we trained the reviewers to determine errors at the index visit through a detailed review of the EHR about care processes involving the index visit and subsequent visits. Reviewers were also instructed to review EHR data from subsequent months after the index visit to help verify whether a diagnostic error was made. Although we used an explicit definition of diagnostic error from the literature32 and a structured training process based upon our previous record review studies, assessment of the diagnostic process involves implicit judgements. To improve reliability and operationalise the definition of diagnostic error, we asked reviewers to judge diagnostic performance based strictly on data either already available or easily available to the treating provider at the time of the index clinic visit (ie, adequate ‘specific’ data must have been available at the time to either make or pursue the correct diagnosis). Thus, reviewers were asked to judge errors when missed opportunities to make an earlier diagnosis occurred. A typical example of a missed opportunity is when adequate data to suggest the final, correct diagnosis were already present at the index visit (eg, constellation of certain findings such as dyspnoea, elevated venous pressures, pedal oedema, chest crackles or pulmonary oedema on to chest x-ray. should suggest heart failure). Another common example of a missed opportunity is when certain documented abnormal findings (eg, cough, fever and dyspnoea) should have prompted additional evaluation (eg, chest x-ray).
If the correct diagnosis was documented, and the patient was advised outpatient treatment (vs hospitalisation) but returned within 14 days and got hospitalised anyway, reviewers did not attribute such provider management decisions to diagnostic error. Each record was initially reviewed by two independent reviewers. Because we expected a number of ambiguous situations, when two reviewers disagreed on presence of diagnostic error, a third, blinded review was used to make the final determination.33 Charts were randomly assigned to available reviewers, about 50 charts at a time. Not all reviewers were always available due to clinical and personal commitments.
A structured data collection form, adapted from our previous work,24 was used to record documented signs and symptoms, clinician assessment and diagnostic decisions. Both sites have well-structured procedures to scan reports and records from physicians external to the system into the EHR and thus information about patient care outside our study settings was also reviewed when available. To reduce hindsight bias,34 35 we did not ask reviewers to assess patient harm. We computed Cohen's kappa (κ) to assess inter-reviewer agreement prior to tiebreaker decisions.
Sampling strategy
To determine our sample size, we focused exclusively on determining the number of Trigger 1 records because of its higher PPV and potential for wider use. We initially calculated the sample size based on our anticipation that by refining trigger criteria we could lower the proportion of false positive cases for Trigger 1 to 20% compared with the false positive proportion of 34.1% in our previous work.24 We estimated a minimum sample size of 310 to demonstrate a significant difference (p<0.05) in the false positive proportion between the new and previous Trigger 1 with 80% power. We further refined the sample size in order to detect an adequate number of errors to allow future subclassification of error type and contributory factors, consistent with the sample size of 100 error cases used in a landmark study on diagnostic error.32 Anticipating that we would still be able to obtain a PPV of at least 16.1% for Trigger 1 (as in our previous study), we estimated that at least 630 patient visits meeting Trigger 1 criteria would be needed to discover 100 error cases. However, on initial test queries of the data repository at Site B, we found only 220 unique records positive for Trigger 1 in the study period, whereas at Site A it was much higher. We thus used all 220 Trigger 1-positive records from Site B and randomly selected the remaining charts from Site A to achieve an adequate sample size for Trigger 1, oversampling by about 10% to allow for any unusable records.24 We randomly selected comparable numbers of Trigger 2-positive records but selected slightly fewer unique records for controls because we expected fewer manual exclusions related to situations when patients were advised hospitalisation but refused and elected to return a few days later (trigger false positives). For both Trigger 2-positive records and controls, we maintained the sampling ratio of Trigger 1; thus, about two-thirds of the records were from Site A.
Data analysis
We calculated PPVs for both triggers and compared these with PPVs for controls. We also calculated the proportion of false positive cases for each trigger and compared them with our previously used methods. The z test was used to test the equality of proportions (for PPV or false positives) when comparing between sites and prior study results. When lower CIs were negative due to small sample size, we calculated exact CIs.
Results
We applied the triggers to 212 165 primary care visits (106 143 at Site A and 106 022 at Site B) that contained 81 483 unique patient records. Our sampling strategy resulted in 674 positive unique patient records for Trigger 1, 669 positive unique patient records for Trigger 2 and 614 unique control patient records for review (figure 1). On detailed review, diagnostic errors were found in 141 Trigger 1 positive records and 36 Trigger 2 positive records, yielding a PPV of 20.9% for Trigger 1 (95% CI 17.9% to 24.0%) and 5.4% for Trigger 2 (95% CI 3.7% to 7.1%). Errors were found in 13 control records. The control PPV of 2.1% (95% CI 0.1% to 3.3%) was significantly lower than that of both Trigger 1 (p<0.001) and Trigger 2 (p=0.002). Trigger PPVs were equivalent between sites (p=0.9 for both triggers).
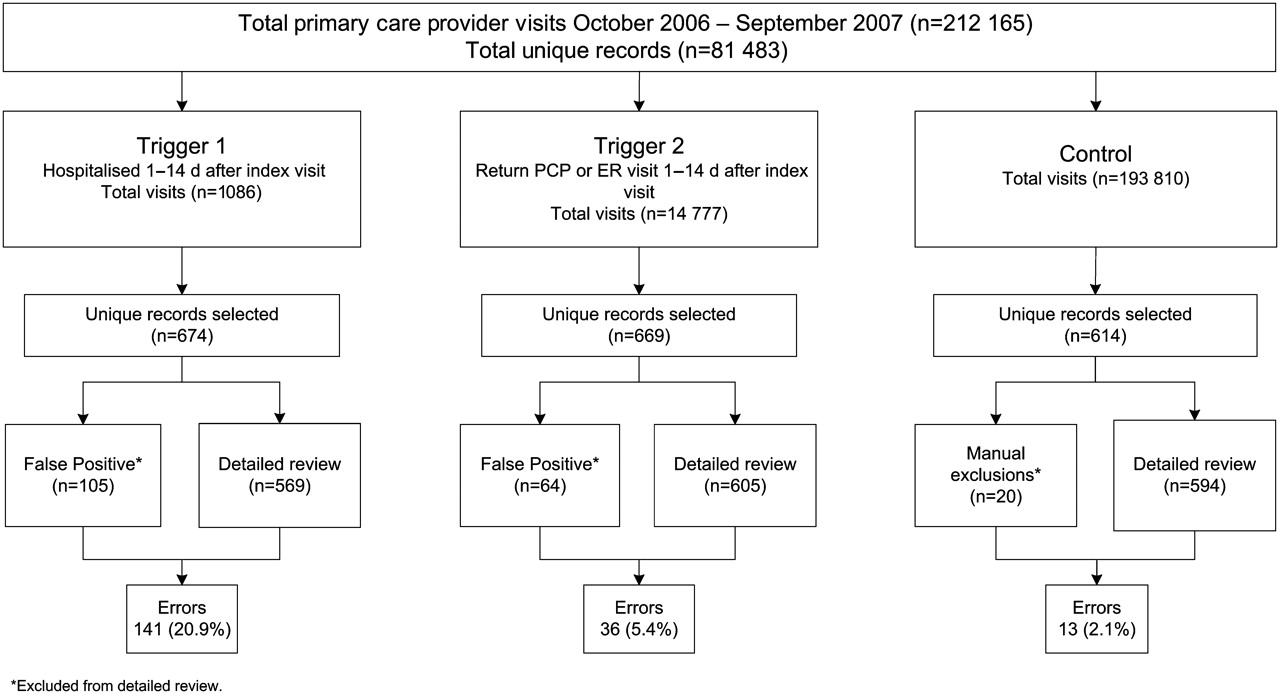
Study flowchart. ER, emergency room; PCP, primary care provider.
Prior to the tiebreaker, κ agreement in triggered charts was 0.37 (95% CI 0.31 to 0.44). Of 285 charts with disagreement, the third reviewer detected a diagnostic error in 29.8%. In 96% of triggered error cases, the reviewers established a relationship between the admission or second outpatient visit and the index visit. Figure 2 shows the distribution of diagnostic errors in the inclusion sample over time interval between index and return dates for both Trigger 1 and Trigger 2 records.

Number of errors per day post-index visit in the triggered subset.
The proportion of false positive cases was not statistically different between the two sites (table 2). The overall proportion of false positives was 15.6% for Trigger 1 and 9.6% for Trigger 2 (figure 1), significantly lower than those in our previous study (34.1% and 25.0%, respectively, p<0.001 for both comparisons). Because many false positives (no documentation, telephone or non-PCP encounters, etc.) could potentially be coded accurately and identified electronically through information systems, we estimated the highest PPV potentially achievable by an ideal system that screened out those encounters. Our estimates suggest that Trigger 1 PPV would increase from 20.9% (CI 17.9% to 24.2%) to 24.8% (CI 21.3% to 28.5%) if electronic exclusion of false positives was possible.
Site-specific positive predictive values (PPVs) and false positive proportions
Three types of scenarios occurred as a result of review procedures: (1) both initial reviewers agreed that it was an error, (2) the independent third reviewer judged it to be an error after initial disagreement and (3) the independent third reviewer judged it not to be an error. The examples in table 3 illustrate several reasons why reviewers initially disagreed and support why using more than one reviewer (and as many as three at times) is essential for making diagnostic error assessment more reliable.
Brief vignettes to illustrate three types of reviewer agreement
Discussion
We evaluated a trigger methodology to rigorously improve surveillance of diagnostic errors in routine primary care practice. One of our computerised triggers had a higher PPV to detect diagnostic error, and lower proportion of false positives, than any other known method. Additionally, the reliability of diagnostic error detection in our triggered population was higher than previous studies on diagnostic error.36 These methods can be used to identify and learn from diagnostic errors in primary care so that preventive strategies can be developed.
Our study has several unique strengths. We leveraged the EHR infrastructure of two large healthcare systems that involved several types of practice settings (internal medicine and family medicine, academic and non-academic). The increasing use of EHRs facilitates creation of health data repositories that contain longitudinal patient information in a far more integrated fashion than in previous record systems.
Because of the heterogeneous causes and outcomes of diagnostic errors, several types of methods are needed to capture the full range of these events.2 20 37 Our trigger methodology thus could have broad applicability especially because our queries contained information available in almost all EHRs.
The study has key implications for future primary care reform. Given high patient volumes, rushed office visits and multiple competing demands for PCPs' attention, our findings are not surprising and call for a multi-pronged intervention effort for error prevention.21 38 39 Primary care quality improvement initiatives should consider using active surveillance methods such as Trigger 1, an approach that could be equated to initiatives related to electronic surveillance for medication errors and nosocomial infections.25 26 40 41 For instance, these techniques can be used for oversight and monitoring of diagnostic performance with feedback to frontline practitioners about errors and missed opportunities. A review of triggered cases by primary care teams to ensure that all contributing factors are identified—not just those related to provider performance—will foster interdisciplinary quality improvement. This strategy could complement and strengthen other provider-focused interventions, which in isolation are unlikely to effect significant change.
Underdeveloped detection methods have been a major impediment to progress in understanding and preventing diagnostic errors. By refining our triggers and reducing false positives, we created detection methods that are far more efficient than conducting random record reviews or relying on incident reporting systems.42 Previously used methods to study diagnostic errors have notable limitations: autopsies are now infrequent,43 self-report methods (eg, surveys and voluntary reporting) are prone to reporting bias and malpractice claims, although useful, shed light on a narrow and non-representative spectrum of medical error.2 15 20 23 44 Medical record review is often considered the gold standard for studying diagnostic errors, but it is time consuming and costly. Moreover, random record review has a relatively low yield if used non-selectively, as shown in our non-triggered (control) group.45 While our methodology can be useful to ‘trigger’ additional investigation, there are challenges to reliable diagnostic error assessment such as low agreement rates and uncertainty about how best to statistically evaluate agreement in the case of low error rates.46 47 Thus, although our methods improve detection of diagnostic errors, their ultimate usefulness will depend on continued efforts to improve their reliability.
Our findings have several limitations. Our methods may not be generalisable to primary care practices that do not belong to an integrated health system or which lack access to staff necessary for record reviews. Although chart review may be the best available method for detecting diagnostic errors, it is not perfect because written documentation might not accurately represent all aspects of a patient encounter. The κ agreement between our reviewers was only fair. However, judgement for diagnostic errors is more difficult than other types of errors,20 and our κ was higher than in other comparable studies of diagnostic error.36 This methodology might not be able to detect many types of serious diagnostic errors that would not result in another medical encounter within 14 days.48 We also likely underestimated the number of errors because we were unable to access admissions or outpatient visits at other institutions, and because some misdiagnosed patients, unknown to us, might have recovered without further care (ie, false negative situations). Finally, we did not assess severity of errors or associated harm. However, the fact that these errors led to further contact with the healthcare system suggests they were not inconsequential and would have been defined as adverse events in most studies.
In summary, an EHR-facilitated trigger and review methodology can be used for improving detection of diagnostic errors in routine primary care practice. Primary care reform initiatives should consider these methods for error surveillance, which is a key first step towards error prevention.
Acknowledgments
We thank Annie Bradford, PhD, for assistance with medical editing.
References
Footnotes
The views expressed in this article are those of the authors and do not necessarily represent the views of the Department of Veterans Affairs or any other funding agency.
Funding The study was supported by an NIH K23 career development award (K23CA125585) to HS, Agency for Health Care Research and Quality Health Services Research Demonstration and Dissemination Grant (R18HS17244-02) to EJT and in part by the Houston VA HSR&D Center of Excellence (HFP90-020). These sources had no role in the design and conduct of the study; collection, management, analysis and interpretation of the data; and preparation, review or approval of the manuscript.
Competing interests None.
Ethics approval Baylor College of Medicine IRB.
Provenance and peer review Not commissioned; externally peer reviewed.