Article Text

Abstract
Background Despite considerable efforts to improve healthcare quality and patient safety, broad measures of patient outcomes show little improvement. Many factors, including limited programme evaluations and understanding of whether quality improvement (QI) efforts are sustained, potentially contribute to the lack of widespread improvements in quality. This study examines whether hospitals participating in a Veterans Health Affairs QI collaborative have made and then sustained improvements.
Methods Separate patient-level risk-adjusted time-series models for two primary outcomes (hospital length of stay (LOS) and rate of discharges before noon) as well as three secondary outcomes (30-day all-cause hospital readmission, in-hospital mortality and 30-day mortality). The models considered 2 years of pre-intervention data, 1 year of data to measure improvements and then 2 years of post-intervention data to see whether improvements were sustained.
Results Among 130 Veterans Affairs hospitals, 35% and 46% exhibited improvements beyond baseline trends on LOS and discharges before noon, respectively. 60% of improving LOS hospitals exhibited sustained improvements, but only 32% for discharges by noon. Additional subgroup analyses by hospital size and region found a similar performance across most groups.
Conclusions This quasi-experimental evaluation found lower rates of improvements than normally reported in studies of QI collaboratives. The most striking observation was that a majority of hospitals increased their rates of discharges before noon, but after completing the collaborative their performance declined. Future work needs to qualitatively and quantitatively assess what organisational features distinguish those hospitals that can improve and sustain quality.
- Quality improvement
- time-series analysis
- veterans affairs
- collaborative
- breakthrough groups
- quality measurement
- human factors
- six sigma
Statistics from Altmetric.com
- Quality improvement
- time-series analysis
- veterans affairs
- collaborative
- breakthrough groups
- quality measurement
- human factors
- six sigma
Background
Since the Institute of Medicine initially publicised quality and safety problems facing the US healthcare system,1 hospitals have focused on improving a variety of patient outcomes. However, broad measures of quality such as the National Healthcare Quality Report, as well as in-depth chart reviews conducted by the Center for Medicare and Medicaid Services, suggest that quality is only slowly improving and preventable adverse events still occur too frequently.2 ,3 A series of recent systematic reviews of quality improvement (QI) initiatives generally conclude that slow improvement rates may reflect that QI efforts are not as successful as reports suggest.4–10 Further, there is concern that initial improvements diminish over time.7
The Veterans Health Affairs (VHA) system is tackling the quality issue by working to create a culture of continuous improvement that encourages sites to conduct regular QI projects. The approach also involves the use of national QI collaboratives based on the Institute for Healthcare Improvement (IHI) Breakthrough Series (BTS) model.11 These collaboratives have shown some success in VHA with 57% of the 134 teams participating in five different collaboratives self-reporting success in meeting project goals.12 Although collaboratives in the broader healthcare system are believed to improve outcomes and facilitate sustained improvements,13 such assessments are generally observational and only discuss sustainability from a theoretical standpoint.14 While the Michigan Keystone ICU collaborative has shown that 60% of intensive care units sustain rates of zero central line infections for 12 months,15 it has not yet been broadly established whether collaboratives lead to sustained improvements.
This study examines VHA hospital performance in relation to their participation in the Flow Improvement Inpatient Initiative (FIX) undertaken during fiscal year 2007 (FY07) which ran from 1 October 2006 to 30 September 2007. The goal of this collaborative was to improve and optimise inpatient hospital flow through the continuum of inpatient care.16 ,17 This study makes three key contributions to the current literature. First, this study will examine 5 years of data using an interrupted time-series design that includes a novel classification approach for evaluating hospital performance. This approach provides a stronger methodological quality compared with prior observational studies and provides insight as to whether hospitals were able to sustain their improvements. Second, the evaluated measures will be objectively assessed from patient records, avoiding any bias introduced by the use of self-reported measures. Third, the study will employ not only primary measures related to FIX but will also evaluate several secondary quality check measures that ensure improvements on some measures are not offset by declines on other measures.
Methods
Setting
This report covers the experience of 130 VHA hospitals that provide acute medical care services as part of an integrated system with central and regional administration and federal (public) funding.18 VHA is the largest healthcare system in USA and provides care for more than 7 million enrolled veterans involving more than 50 million outpatient visits and 500 000 inpatient admissions.19 The patient population is about 8% female, 20% minority and, generally, have a medical condition related to their military service or no other source of healthcare. VHA also has a long history of electronic medical records, which frequently influences their approaches to QI.
FIX collaborative
Working from the IHI BTS model, the VHA Systems Redesign group developed the FIX collaborative to aid hospitals in recognising and responding to natural and artificial demand variation in inpatient flow. The two outcomes hospitals were encouraged to focus on were shortening hospital length of stay (LOS) and increasing the percentage of patients discharged before noon. The intention of the latter goal was to ensure that patients are admitted to an appropriate level of care and do not have to wait in emergency departments or recovery rooms for extended periods of time. Participation in the collaborative was mandatory, with the 130 participating hospitals organised into five geographic regions (Northeast, Southeast, Central, Midwest and West) consisting of approximately 26 hospitals each.20
Each region had a leadership team that consisted of two co-directors (responsible for overall leadership, recruiting and serving as core faculty) and two co-coordinators (responsible for day-to-day management including communication, agenda logistics, facilitating phone call sessions and troubleshooting). These individuals were selected to provide an optimal mix of positional authority, teaching skills, knowledge, internal veterans affairs (VA) experience and the ability to work effectively in a high-performing team. QI coaches were recruited based on their expertise in improvement methods and experience with inpatient flow and were responsible for working with the QI teams and for providing verbal and written feedback throughout the change journey. A close connection was maintained between the QI teams and their regional leadership team as well as the national steering committee, ensuring alignment to the core messages, content and strategies.
Each hospital ensured that two to three individuals from the improvement team (one of whom had to be a hospital executive) participated in each learning session, although some individuals varied across learning sessions. The improvement teams participated in a telephonic ‘pre-work’ session as well as three face-to-face 1.5–2-day long learning sessions that focused on teaching key flow principles for measuring and addressing demand variation as well as change management tools. Teams were encouraged to follow the VA–TAMMCS improvement framework which calls for first selecting a topic and focus (vision, analysis), identifying a team (T), adopting clear aims (A), flow-mapping and measuring the process (MM), running plan, do, study, act change cycles (C), and lastly working to sustain and spread improvements (S). Each team worked to translate the FIX principles into solutions addressing their unique flow concerns, as such solutions varied across sites.
Analyses
Data for this study came from VHA administrative discharge records and covered five fiscal years beginning with FY05 (1 October 2004) to FY09 (30 September 2009).21 The eligible patient cohort represented all patients admitted to the medical service at the participating hospital. The primary study outcomes were LOS and the percentage of patients discharged before noon. Additionally, the study evaluated three secondary outcomes: 30-day all-cause readmission to any VA facility, 30-day mortality and in-hospital mortality. These served to examine whether improvements in patient flow, a predominately business driven outcome measure, were associated with any unintended consequences. Outcomes were modelled individually for each participating hospital, with appropriate risk adjustment based on patient demographic characteristics, primary diagnoses, co-morbidities, sources of admission, direct admission to the intensive care unit and location of discharge.
The outcomes were modelled using a 5-year interrupted time series with appropriate correction for autocorrelation and heteroscedasticity.22 Time-series modelling was completed using SAS V.9.2 Proc Autoreg.23 Tests of significance were set at p≤0.05. Individual data points in the outcome models represent 14-day averages (leading to 26 data points per year). This aggregation level provided a power of 0.88 to detect a change in the outcome >1SD in a moderately autocorrelated series.24 ,25
The final form of each outcome model was:
In the above model β1–β5 represent the slope over time for each year (FY05–FY09), respectively. The time component t is parameterised in order to create a continuous linear regression, with t05 counting from 0 to 129, t06 is 0 for the first 27 time points and then begins counting, etc. The β6 term represents a quadratic component to the overall trend. This parameter was only included in models where it was significant. The final component of this model, vt represents the error term with appropriate corrections for autocorrelation and heteroscedasticity.23
The authors had full access to and take full responsibility for the integrity of the data. All analyses were conducted using SAS statistical software V.9.2. The study was approved by the University of Iowa Institutional Review Board and the Iowa City VA Healthcare System Research and Development Committee (ID# 200901749).
Improvement and sustainability
In order to understand and compare hospital performance over this 5-year period, this study developed a novel classification scheme. This classification scheme included a total of four categories, briefly listed below:
NO TREND: Hospitals with no statistical changes during the study
IMPROVE: Hospitals with initial improvements that were not sustained
SUSTAIN: Hospitals with sustained improvements over the study
NO BENEFIT: Hospitals with a decline in performance or no signs of improvement.
Classification of No Trend represented the case where the outcome model exhibited no statistical change over the first 4 years of the study (β1–β4). The fifth year is not considered in this classification as after 4 years of no statistical changes anything observed during the fifth year may simply represent chance variation, and if it represents a real change in the outcome, this change would in no way be associated with FIX. Hospitals classified as No Trend generally exhibit high variability on the outcomes, which is in direct contrast to those classified as No Benefit. Classification of No Benefit represented performance on an outcome where the time-series model identified a statistical change in one of β1–β4; however, the β3 parameter which measures improvements potentially associated with FIX was either non-significant or signed in the undesirable direction. In these cases, the outcome measure had low levels of variance but the outcome did not show any changes that were potentially associated with FIX.
The final two classification categories, Improve and Sustain, represented situations where the models indicated improvements potentially associated with FIX. If performance returned to baseline levels in FY08 or FY09, the performance was classified as Improve. If improved levels of outcome performance were maintained after completion of FIX, then the classification was Sustain. Figure 1 contains three decision trees that outline how the β parameters were interpreted to determine appropriate classification. In this figure, the statement of increased or decreased performance signifies a statistically significant change, while flat performance signifies a non-significant finding. Decreased performance implies the sign on the β parameter is in the wrong direction (positive for LOS, readmission rate, mortality rates and negative for discharges before noon). Hospital performance was evaluated separately for each individual outcome.

Decision tree for determining hospital performance.* (A) Hospitals showing initial improvement during fiscal year 2007 (FY07). (B) Hospitals with decreased performance in FY07. (C) Hospitals with non-statistical (p>0.05) performance in FY07. *Increased performance=statistically significant (p<0.05) and signed in the desired direction (negative for LOS, readmission rate, mortality rates; positive for discharges before noon); decreased performance=statistically significant (p<0.05) and signed in the undesired direction; flat performance=non-significant (p>0.05).
Subgroup analyses
To understand how hospital performance varies as part of participation in the collaborative, there were three planned subgroup comparisons. First, a comparison comparing hospitals based on size. Hospitals were classified as either large (≥200 beds), medium (100–199) or small (<100) based on the number of approved medical/surgical beds. The second comparison was to compare hospital classification by the five regions of the collaborative. The final comparison examines how hospitals classified as Sustain for LOS performed on the other outcomes, particularly the secondary outcomes. This comparison checked whether these hospitals had higher than expected rates of decline on the secondary outcomes. All these comparisons were done using Pearson χ2 tests comparing the distribution of facilities within the relevant subgroup with that of the overall group.
Results
Enterprise-level analysis
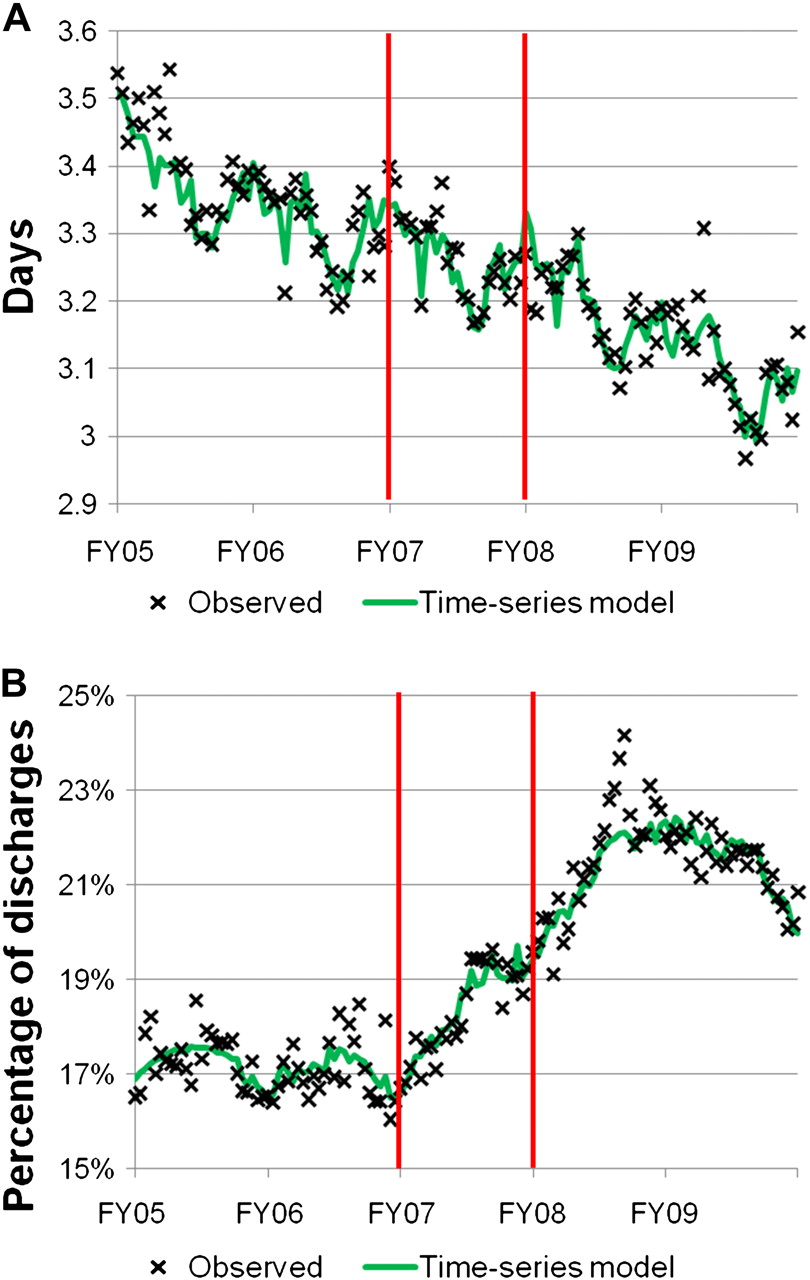
The 5 years of data in this study included 1 690 191 discharges from 130 VHA hospitals. When aggregating and analysing all facilities together, three of the outcome measures, LOS, in-hospital mortality, and 30-day mortality exhibited a 3–4% rate of improvement prior to FIX. The other two outcomes—discharges before noon and 30-day readmissions—were statistically flat. During FIX, the LOS model (figure 2A) exhibited only a subtle improvement that does not suggest broad enterprise-wide improvements. By contrast, the other primary outcome, discharges before noon (figure 2B), exhibited a clear initial improvement, jumping to over 23% of discharges from a baseline of 17%. However, partway through FY08 the percentage of patients discharged before noon began to decline and reached a rate around 20% at the end of the study. The three secondary outcomes, 30-day readmissions, in-hospital mortality and 30-day mortality were not impacted by FIX.

Individual risk-adjusted time points and the fitted time-series model. (A) Length of stay (LOS) for all patients discharged from 130 VA Hospitals (FY05–FY09). β Parameters (p value) from the enterprise-wide LOS model, all parameters represent the ln(LOS): β0=0.56 (0.013), β1=0.02 (0.006), β2=−0.008 (0.008), β3=−0.009 (0.002), β4=−0.009 (0.001), β5=−0.009 (0.002), β6=0.0002 (0.002). (B) Percentage of patients discharged before noon from 130 VA hospitals (FY05–FY09). β Parameters (p value) from the enterprise-wide discharges before noon model β0=0.38 (<0.001), β1=−0.005 (<0.001), β2=0.003 (<0.001), β3=0.004 (<0.001), β4=0.003 (<0.001), β5=−0.001 (0.42), β6=−0.0001 (<0.001).
Hospital-level analysis
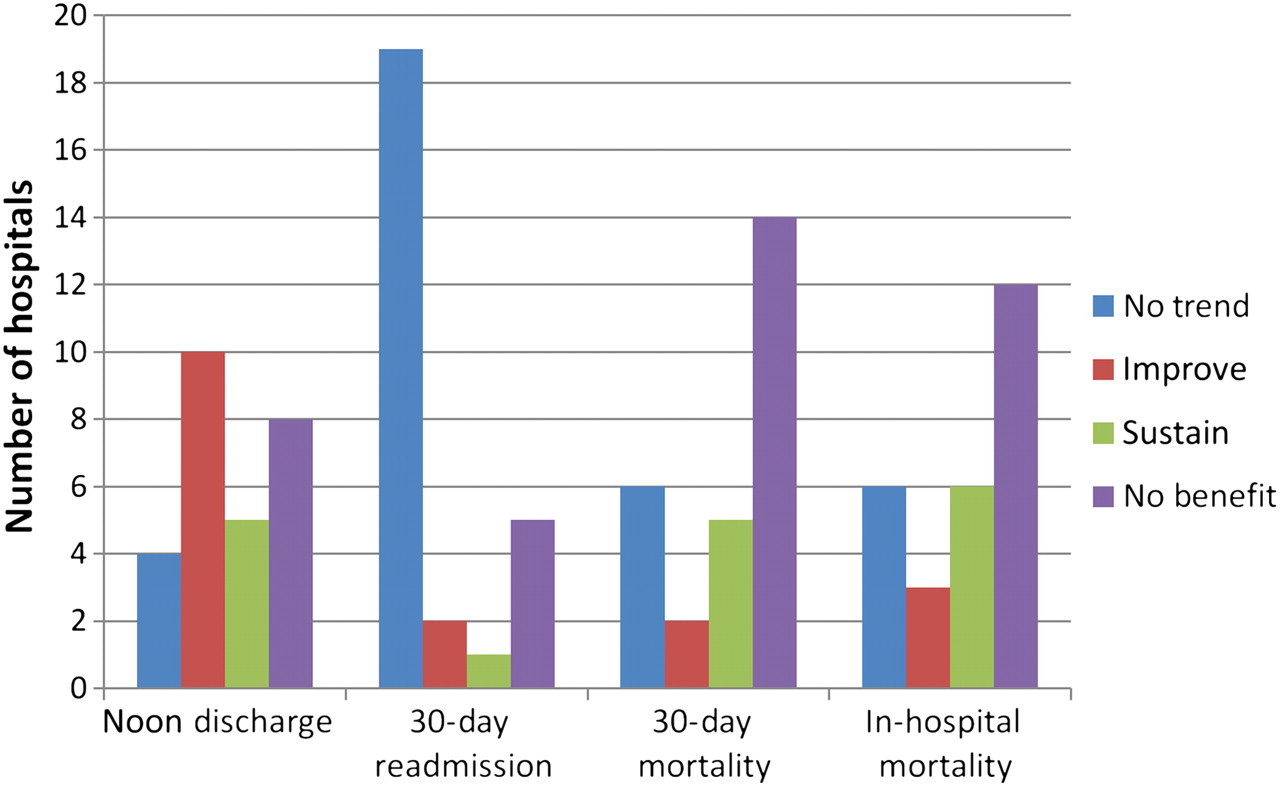
Figure 3 presents a collection of bar charts indicating the number of hospitals classified into each of the four performance categories across the five outcomes. Focusing on the two primary outcomes, 35% (45 out of 130) made initial improvements in LOS with 60% of that sample (27 out of 45) sustaining those improvements. By contrast, 46% (60 out of 130) improved on discharges before noon, but only 32% of this sample (19 out of 60) showed sustained improvements.

Overall classification of hospital performance (N=130 hospitals). LOS, length of stay.
The subgroup analyses generally showed that performance did not vary by hospital size or region. For the hospital size comparisons, there was one significant comparison with large hospitals having a greater than expected number of hospitals classified as No Trend on LOS (χ2, df=3, p=0.04). Comparisons by region found no statistical differences (χ2, df=3, all p>0.09).
The last comparison, figure 4, examines how the 27 hospitals classified as Sustain on LOS performed on the other outcome measures. This revealed that only five hospitals were sustainers on both LOS and discharges before noon. Comparisons of this distribution to the overall distribution indicated that LOS Sustainers had the same performance on the other outcomes as that seen in the overall group (χ2, df=3, p(noon discharge)=0.52, p(30-day readmission)=0.94, p(30-day mortality)=0.79, p(in-hospital mortality)=0.57).
Classification of hospitals that sustained length of stay (N=27 hospitals).
Discussion
This time-series analysis of a national VHA QI collaborative identified considerable variation in individual hospital performance with few hospitals classified as Sustain on each outcome. Classification of the two primary outcomes suggests that 34.6% of hospitals for LOS (13.8% improved and 20.8% sustained) and 46.1% for discharges before noon (31.5% improved and 14.6% sustained) had improvements during FIX that were not predicted by pre-existing temporal trends. Given VHA's activity in QI,26–28 we were not surprised by the pre-intervention rate of 3–4% decline in LOS and we knew the analytic approach should attempt to account for improvements that other ongoing interventions may have on the outcome methods. With that adjustment, this quasi-experimental evaluation found rates of improvement less than those reported in other assessments of large QI collaboratives, highlighting the importance of strong QI evaluations that report pre- and post-improvement quantitative data along with qualitative data tying the intervention to observed improvements and identifying key sources of variation.12 ,29
The most intriguing finding of this study was how hospitals performed on their efforts to increase the number of discharges before noon. Prior to the intervention the outcome was flat, reflecting few if any hospitals were focused on time of discharge, but during FIX there was a marked enterprise-wide (figure 2B) increase in the percentage of patients discharged before noon. However, shortly after the collaborative ended, the enterprise-wide rates began to decline and a third of the improving facilities showed sustained performance. While the reason for lack of sustained improvements probably has differing root causes across hospitals, this larger response profile may be emblematic of many QI efforts in healthcare and indicates a need to improve the understanding of how to sustain improvements effectively.
A secondary consideration from this analysis was 36 hospitals (28%) were classified as No Trend on the LOS and discharges before noon outcomes. Thirteen hospitals recorded this classification on both primary outcomes. This contrasts with only five hospitals recording Sustain on both primary outcomes. While it may be that these hospitals did not adhere to FIX, the time-series models for these hospitals generally identified high levels of variance suggesting they had few standardised care processes in place. This data serves as a reminder that it is difficult to improve a process that does not perform consistently and QI teams need to first establish a standardised process if one does not already exist.
Limitations
While this study provides some intriguing results, it is important to remember that the time-series model can only control for temporal trends and cannot identify causal relationships on its own. As this analysis does not have sufficient frontline details to understand projects at each hospital, it is not possible to isolate the impact of FIX. This is a particular challenge in VHA as FIX only represents one among many national QI initiatives. Additionally, VHA hospitals regularly develop local projects to meet hospital-specific needs. The impact of these other QI projects is of limited concern for two reasons. First, since the time-series analysis does account for baseline trends in the outcomes, a regular focus on QI should be reflected in baseline trends, with FIX representing a discrete increase in focus during FY07. Second, our interest is in developing an understanding of how to sustain improvements and we expect that complex outcomes, such as LOS and discharges before noon, are unlikely to be sustained by a single intervention. Instead, the importance of any single QI project may be the attention it brings to a topic, the training it provides team members and its contribution to a greater culture focused on QI—all of which facilitate sustained improvements through a continuous cycle of improvement.
There are two other limitations to consider when interpreting this data. First, FIX did not prescribe a specific solution, as is more common in collaboratives, so teams may have chosen not to directly target LOS or discharges before noon or they may have developed ineffective solutions. However, in a healthcare system that still struggles to quickly disseminate evidence or quickly improve quality, the successes and failures of this intervention reflect the real-world setting of QI and show we need to better understand variations between hospitals as well as how to improve the likelihood of sustained improvement. Second, FIX was a mandated QI collaborative, thus much of the variation in performance may reflect varying levels of engagement by teams or hospitals, which may not represent how teams perform when they choose to participate in an IHI BTS collaborative.
Conclusion
This analysis of the FIX collaborative in VHA found considerable variability in performance across hospitals and few (<20%) teams had potentially sustained improvements. The observed efforts to improve the rate of patient discharges before noon was particularly striking as focus on this new quality metric generated enterprise-wide improvements that declined after the collaborative completed. An additional finding from the analysis was that 28% of hospitals exhibited no statistical trend on the two primary outcomes. If the variability reflected in the outcome measures reflects a lack of standardised care processes at these hospitals, it serves as a reminder that processes must perform predictably and consistently before they can be successfully improved. Taken together, these findings suggest that future studies of QI initiatives and collaboratives need to more thoroughly evaluate QI efforts. These studies should include not only quantitative but also in-depth qualitative evaluations that among many things examine how well hospitals sustain improvements and what organisational characteristics support or hinder sustained improvements.
Acknowledgments
The authors appreciate the critical review and comments provided by Marta Render, MD, James Torner, PhD, Elizabeth Chrischilles, PhD, Jason Hockenberry, PhD, Jill Scott-Cawiezell, PhD, RN and Ryan Carnahan, PharmD.
References
Footnotes
This manuscript is not under review elsewhere and there is no prior publication of the manuscript's contents. The preliminary results of this manuscript were presented at the National VA Health Services Research and Development Research Meeting, Washington, DC, February 2011, and the Society of General Internal Medicine Annual Meeting, Phoenix, AZ, May 2011. The views expressed in this article are those of the authors and do not necessarily represent the views of the Department of Veterans Affairs. The authors report no conflict of interest in regards to this study.
Funding The work reported here was supported by a TL1 award from the University of Iowa Institute for Clinical and Translational Science (5TL1 RR024981-03) and the Department of Veterans Affairs, Veterans Health Administration, Health Services Research and Development (HSR&D) Service through the Comprehensive Access and Delivery Research and Evaluation (CADRE) Center (HFP 04-149).
Competing interests None.
Ethics approval University of Iowa Institutional Review Board and the Iowa City VA Healthcare System Research and Development Committee.
Provenance and peer review Not commissioned; externally peer reviewed.
Data sharing statement Available to researchers with VA accreditation.