Article Text

Abstract
Background The recognition of patient deterioration depends largely on identifying abnormal vital signs, yet little is known about the daily pattern of vital signs measurement and charting.
Methods We compared the pattern of vital signs and VitalPAC Early Warning Score (ViEWS) data collected from admissions to all adult inpatient areas (except high care areas, such as critical care units) of a NHS district general hospital from 1 May 2010 to 30 April 2011, to the hospital's clinical escalation protocol. Main outcome measures were hourly and daily patterns of vital signs and ViEWS value documentation; numbers of vital signs in the periods 08:00–11:59 and 20:00–23:59 with subsequent vital signs recorded in the following 6 h; and time to next observation (TTNO) for vital signs recorded in the periods 08:00–11:59 and 20:00–23:59.
Results 950 043 vital sign datasets were recorded. The daily pattern of observation documentation was not uniform; there were large morning and evening peaks, and lower night-time documentation. The pattern was identical on all days. 23.84% of vital sign datasets with ViEWS ≥ 9 were measured at night compared with 10.12–19.97% for other ViEWS values. 47.42% of patients with ViEWS=7–8 and 31.22% of those with ViEWS ≥ 9 in the period 20:00–23:59 did not have vital signs recorded in the following 6 h. TTNO decreased with increasing ViEWS value, but less than expected by the monitoring protocol.
Conclusions There was only partial adherence to the vital signs monitoring protocol. Sicker patients appear more likely to have vital signs measured overnight, but even their observations were often not followed by timely repeat assessments. The observed pattern of monitoring may reflect the impact of competing clinical priorities.
- Trigger tools
- Patient safety
- Medical emergency team
- Adverse events, epidemiology and detection
Statistics from Altmetric.com
Background
Abnormalities of easily measured, physiological variables, such as pulse, blood pressure and breathing rate, are associated with adverse outcomes in hospitalised patients.1–5 Close monitoring of such signs increases the chance of early detection of patient deterioration, and when followed by prompt action has the potential to reduce mortality, morbidity, hospital length of stay and costs. Despite this, the frequency of vital signs monitoring in hospital often appears to be inadequate.6–10 In 2007, the UK National Patient Safety Agency (NPSA) undertook semi-structured interviews with a total of 16 ward staff members (five junior doctors, five staff nurses and six senior nurses), selected from only four hospitals.7 On the basis of this small qualitative study, the NPSA reported that staff ‘rarely carry out routine observations during the night (between 10.30 pm–6 am)’ and that ‘observations are seen as tasks with a low priority’.7 Almost simultaneously, the UK National Institute for Health and Clinical Excellence (NICE) recommended that physiological observations should be monitored at least every 12 h with the frequency increasing if abnormal physiology was detected, but this was not evidence based and mainly represented the consensus of opinion from within the NICE Guideline Development Group.9 NICE also recommended that a multiple-parameter or aggregate weighted early warning scoring system (EWS) should be used to monitor all adult patients in acute hospital settings.9 The 2012 National Confidential Enquiry into Patient Outcome and Death (NCEPOD) report ‘Time to intervene?’ noted that 97.9% of organisations studied indicated that an EWS linked to an escalation protocol was in use.10 However, few patients having a cardiac arrest had clear vital signs monitoring plans10 almost 7 years after the NICE publication, emphasising the often considerable difference between policy and practice.9
Portsmouth Hospitals NHS Trust (PHT) uses an aggregated weighted scoring system (VitalPAC EWS: ViEWS11), a freely available paper-based EWS, which allocates points based on the derangement of patient's vital signs from a predetermined ‘normal’ range. The variables allocated points in ViEWS are pulse rate, breathing rate, systolic blood pressure, oxygen saturation, temperature and conscious level (measured using the alert, voice, pain, unresponsive (AVPU) scale). Additional points are also allocated if the patient is receiving supplemental oxygen therapy. The aggregate of these points—the ViEWS value—is used to direct care via a graded response system, that is, increasing ViEWS values should lead to an increase in the frequency of vital signs measurement and/or the involvement of more experienced ward, outreach or intensive care unit staff.
Vital signs monitoring is an essential component of the ‘chain of prevention’12 and failure to record vital signs on time, or perhaps not at all, will ‘break the chain’ so that patient deterioration is more likely. However, there is neither published data on the pattern of vital sign documentation throughout the 24 h day or on different days of the week, nor any evidence of the compliance of staff with a hospital's monitoring escalation plan. Therefore we used our hospital's large vital signs database to study the pattern of the recording of vital signs observations throughout the day and examine its relationship with the monitoring frequency component of the clinical escalation protocol that forms part of the hospital's track and trigger system.
Methods
Methods and participants
The study took place at PHT, a National Health Service District General Hospital on the South Coast of England. PHT handles around 140 000 admissions per year in around 1200 inpatient beds on a single site. It has around 5500 staff and provides all acute services except burns, spinal injury, neurosurgical and cardiothoracic surgery to approximately 540 000 of the local population.
A commercially available, electronic system (VitalPAC) is used at PHT for the routine documentation and charting of all vital signs at the bedside in all adult inpatient areas, except high care areas such as critical care units, using hand-held devices.13 Paper vital sign charts are not routinely used by the hospital. VitalPAC is integrated with the hospital patient administration system. ViEWS and its associated monitoring escalation plan are embedded within VitalPAC.
At each measurement, nurses in all adult inpatient areas, except high care areas such as critical care units, entered the patient’s vital signs into commercially available, hand-held, personal digital assistants (PDAs) running the VitalPAC software at the bedside. VitalPAC facilitated the gathering of a complete vital sign dataset each time a measurement was made and each dataset was assigned a timestamp by the VitalPAC software. The VitalPAC software warns if out-of-range data or erroneous values are entered. VitalPAC then automatically and accurately calculated a ViEWS value11 as a measure of the patient's level of physiological derangement. Appropriate decision support was displayed instantaneously via the PDA, indicating any alteration in the monitoring frequency that the nurse should make on the basis of the ViEWS value, according to the hospital's clinical escalation protocol (table 1). Specifically, the time to the next vital signs observation measurement was determined by the ViEWS value. This varied from 12 h for the least ill patient to 30 min for the most severely ill patient. Vital signs data from patients who were continuously monitored were not automatically recorded by VitalPAC, but the hospital policy instructs staff to enter these data manually into VitalPAC at the frequency recommended by the ViEWS value.
Hospital's clinical protocol for the interval between observation sets
The vital signs and ViEWS data recorded for all hospital inpatients for the period 1 May 2010 to 30 April 2011 were analysed. To facilitate analysis, all observation sets were allocated to an hour of the day, with the time for each observation set being labelled as the current hour at the moment of the timestamp. For example, all timestamps between 05:00 and 05:59 were labelled as 05:00. To determine the overall pattern of the recording of observations throughout the day, we calculated the number of vital sign sets collected each hour, expressed as a percentage of the total number of vital sign sets collected in the day. We then stratified each hourly total by ViEWS value using five ViEWS groups: ViEWS=0–1, ViEWS=2, ViEWS=3–6, ViEWS=7–8 and ViEWS ≥ 9. Each of these groups dictated different frequencies for the measurement of vital signs (table 1). To determine how the vital sign sets in a given ViEWS group were distributed throughout the day, we also calculated the number of vital sign sets collected in each ViEWS group each hour, expressed as a percentage of the total number of values in that ViEWS group for the whole 24 h period.
To investigate the pattern of vital signs observation recording on weekdays and at weekends, we calculated the number of vital signs sets collected each hour, expressed as a percentage of the total number of vital sign sets collected in the day, stratified by days of the week.
To investigate whether observations for the study period were performed in accordance with the clinical escalation protocol during the daytime and night-time periods, we analysed the vital signs datasets of patients who had observations recorded in two time periods: 08:00–11:59 and 20:00–23:59. For each of these time periods, we analysed only those observations for which there was at least one subsequent observation recorded within the 24 h after the last ViEWS value recorded in the respective time period. Observations in the two time periods were excluded if there was no subsequent observation recorded within the 24 h after the last ViEWS value recorded in the respective time period. For each of the vital signs datasets in the 08:00–11:59 h subgroup, we paired the last ViEWS value recorded in the period 08:00–11:59 with the subsequent ViEWS value up until 07:59 the next day. Similarly, for each of the vital sign datasets in the 20:00–23:59 subgroup, we paired the last ViEWS value recorded in the period 20:00–23:59 with the subsequent ViEWS value up until 19:59 the next day. The ViEWS value and documentation date/time of each observation in the pair were extracted. We then performed the following analyses:
-
The numbers and proportions of vital sign datasets recorded in the period 08:00–11:59, for which a paired ViEWS value was recorded in the subsequent period 12:00–17:59 (daytime), were calculated for the five ViEWS groups described previously.
-
The numbers and proportions of vital sign datasets recorded in the period 20:00–23:59, for which a paired ViEWS value was recorded in the subsequent period 00:00–05:59 (night-time), were calculated for the five ViEWS groups described previously.
-
The time between the last ViEWS value recorded in the period 08:00–11:59 and the subsequent ViEWS value in the period 12:00–07:59 the next day (termed the time to next observation (TTNO)) was calculated for each pair. These data were stratified by the ViEWS value recorded in the period 08:00–11:59.
-
The time between the last ViEWS value recorded in the period 20:00–23:59 and the subsequent ViEWS value in the period 00:00–19:59 the next day (TTNO) was calculated for each pair. These data were stratified by the ViEWS value recorded in the period 20:00–23:59.
Statistical analyses
The data were analysed using commercial database and analysis software, Foxpro and Microsoft Excel. Descriptive statistics were calculated, including counts, means (±SD), medians and percentages. Statistical significance was tested using Student's t test (STATA V.11.1).
Results
A total of 950 043 complete observation sets were recorded during the study period: 489 299(51.50%) of the observations had a ViEWS value=0–1, and 171 889 (18.09%), 250 895 (26.41%), 25 235 (2.66%) and 12 725 (1.34%) had ViEWS values=2, 3–6, 7–8 and ≥9, respectively.
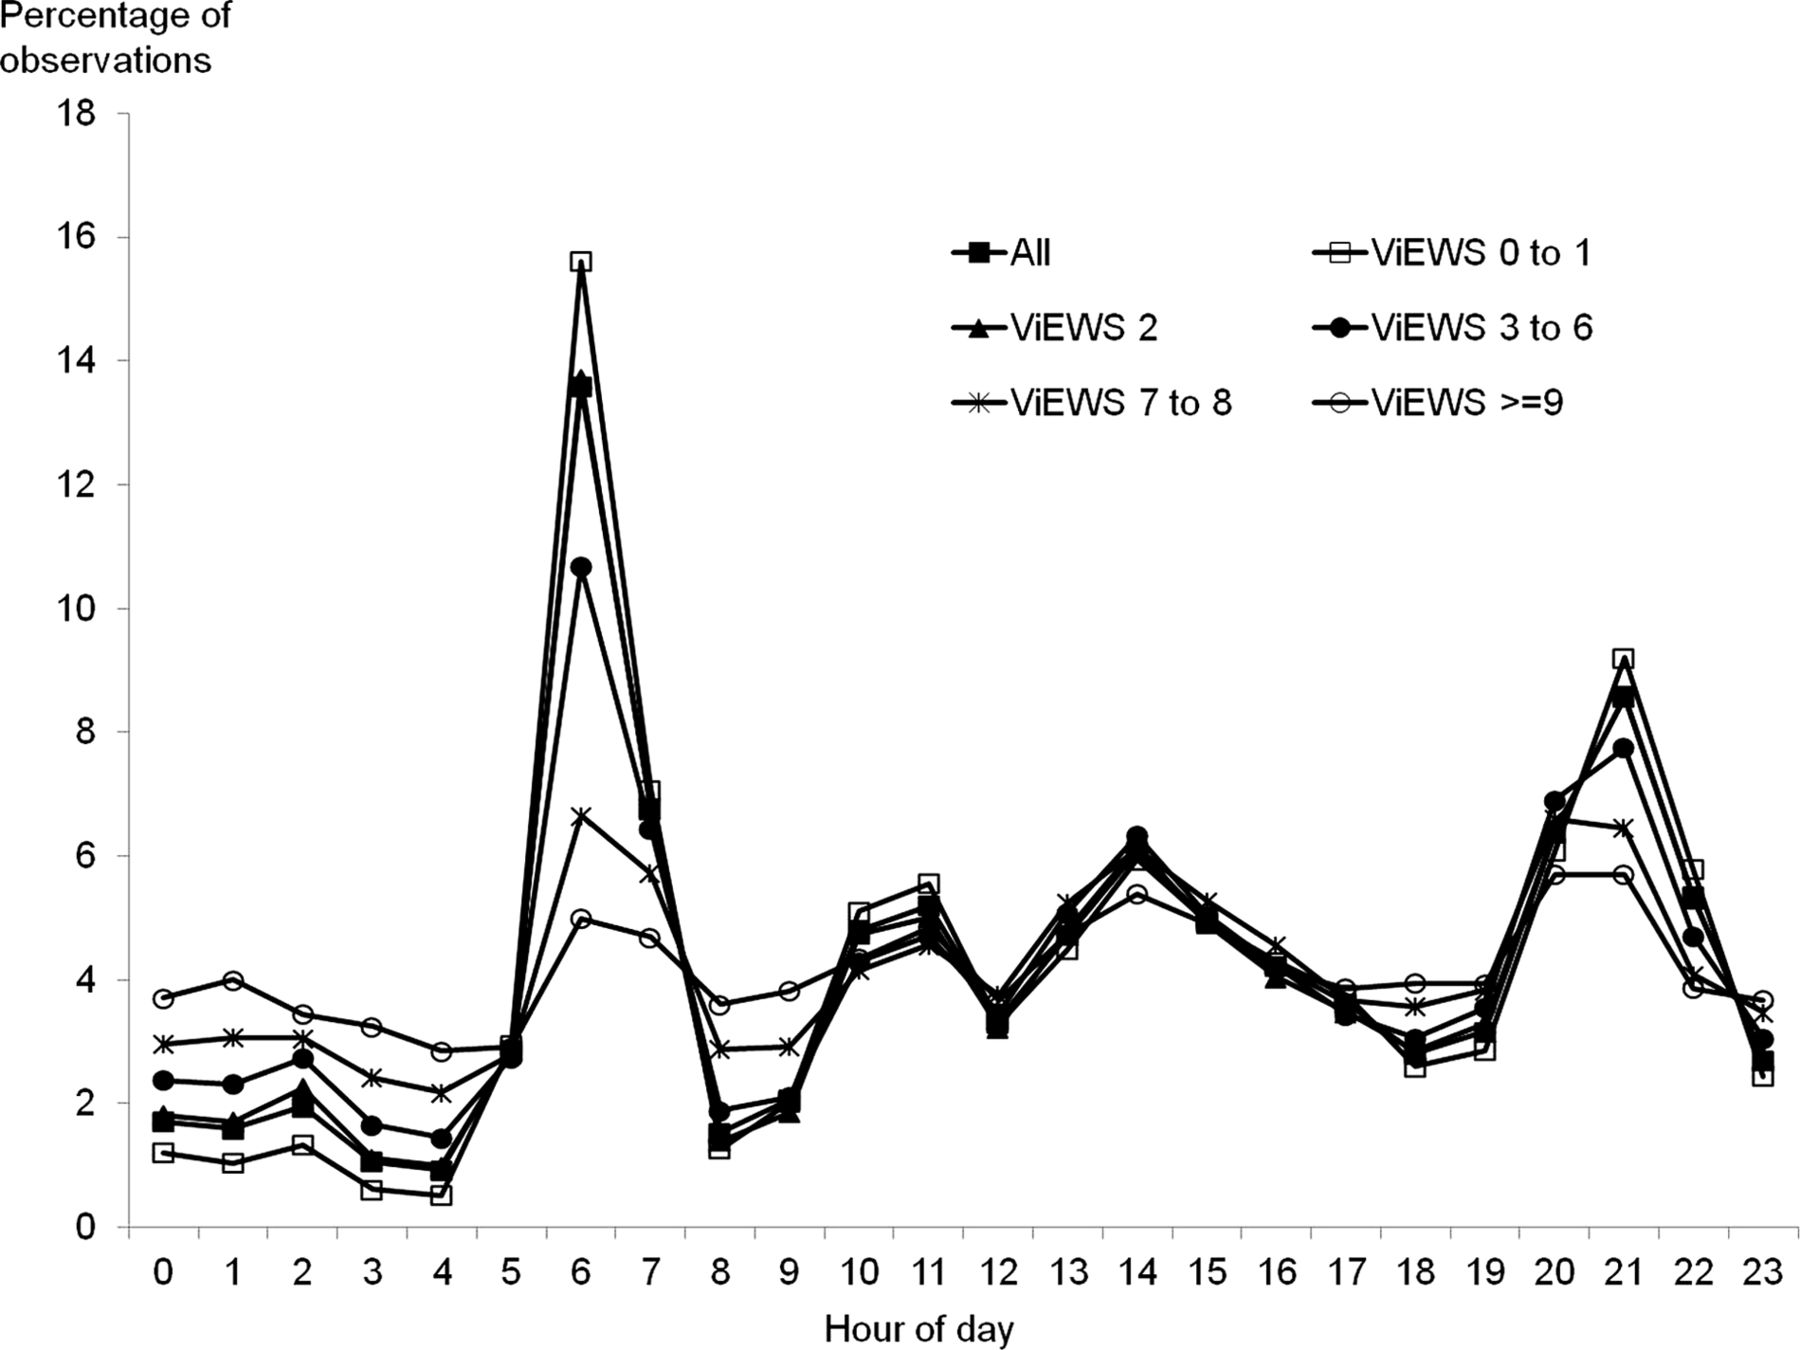
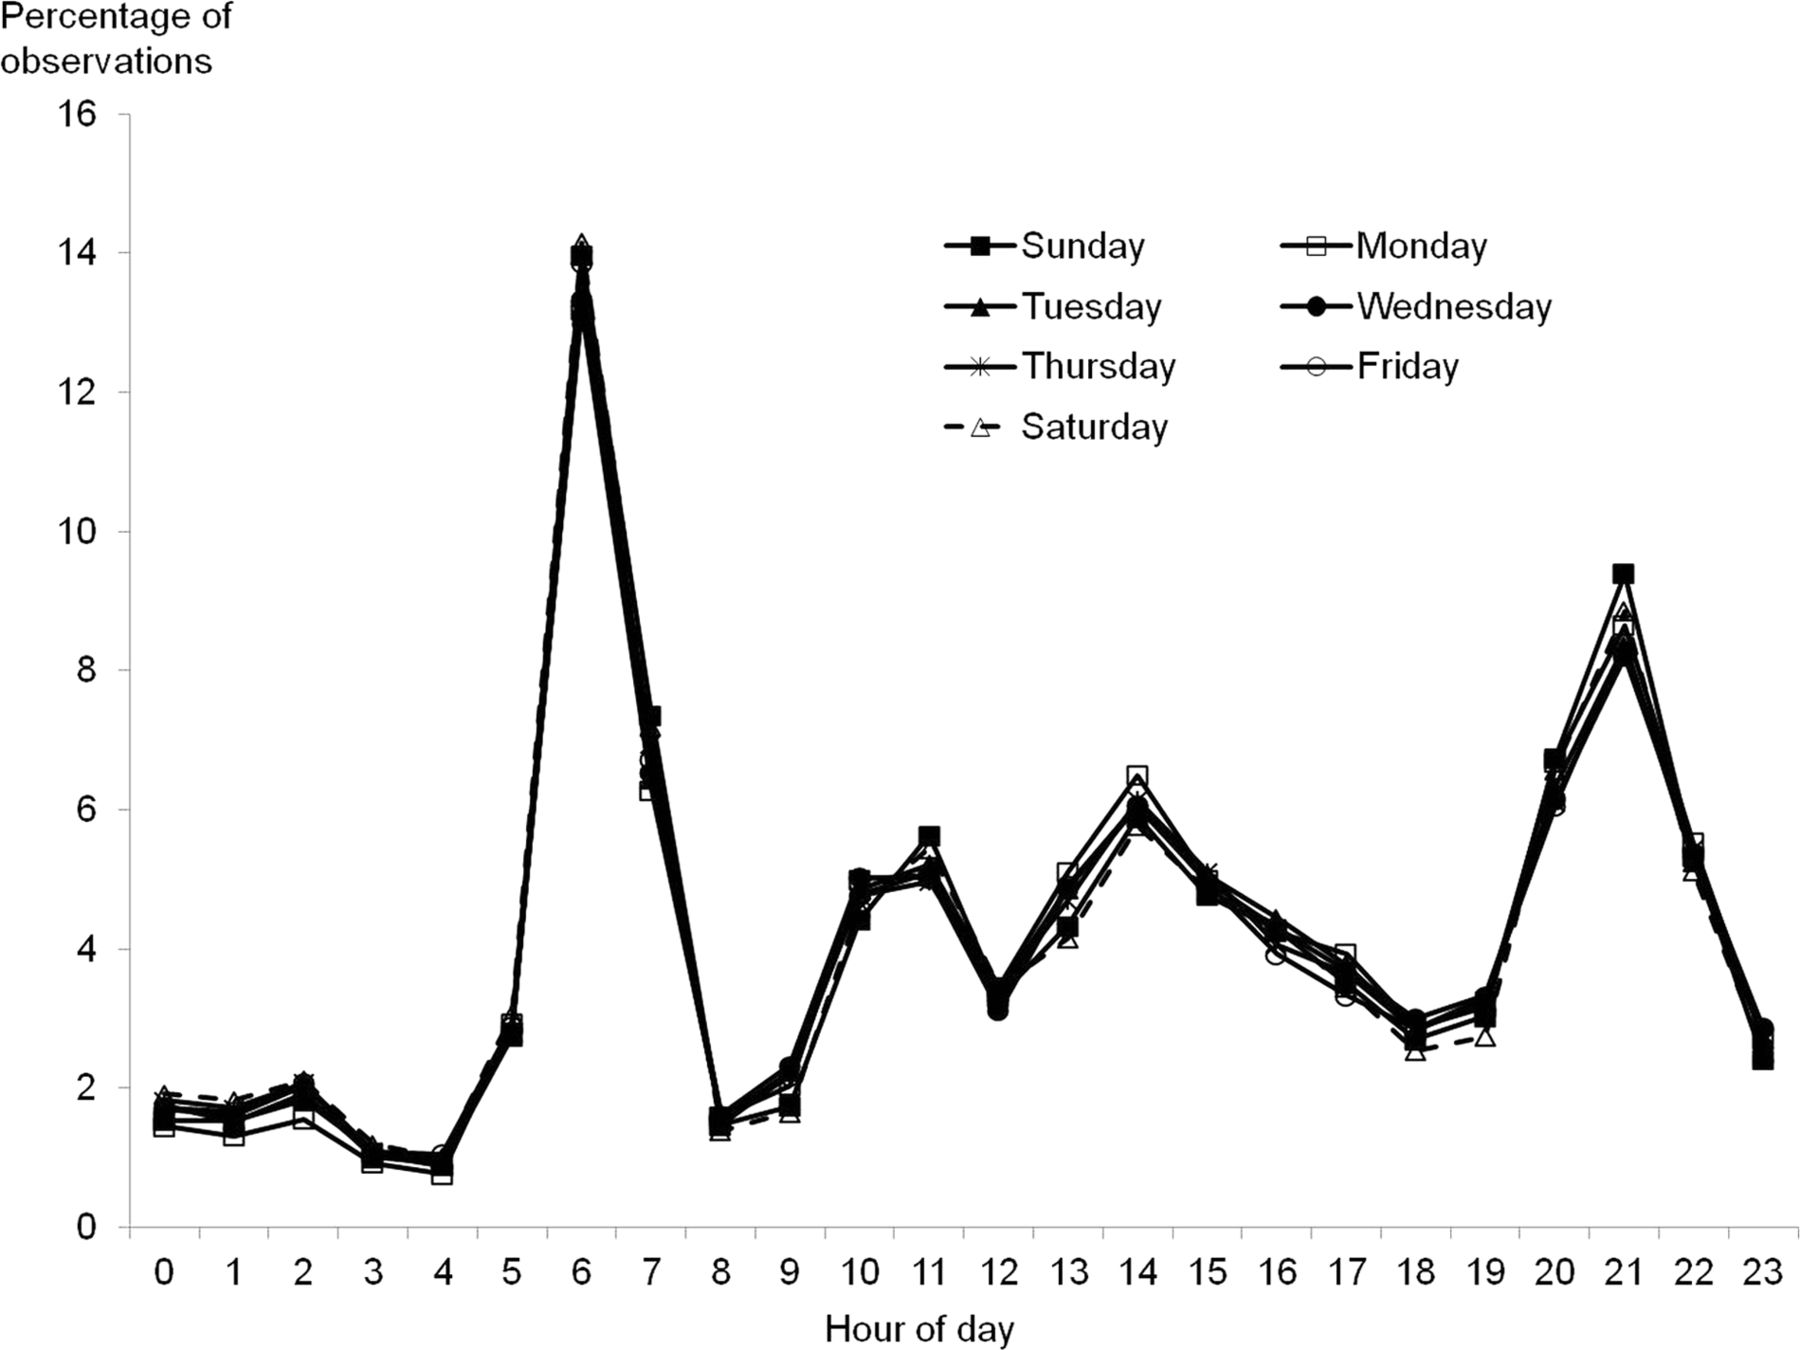
Figure 1 shows that the pattern of vital signs recording was variable throughout the 24 h period. From 23:00 to 05:59, vital signs were measured infrequently, with the percentage of vital sign sets collected each hour varying little from 0.93% to 2.87%. Despite comprising 29.2% of the 24 h day, only 12.81% of vital signs were measured during the period 23:00–05:59. There was an increase in the percentage of vital signs collected each hour between 10:00 and 17:59 (range 3.35–6.08%), but the most striking pattern was the presence of two peaks of recording activity at 06:00–06:59 and 21:00–21:59, during which 13.58% and 8.58% of observations sets were recorded, respectively. The pattern of observations on each day of the week was identical (figure 2).

Pattern of vital signs observation sets recorded each hour of the day expressed as a percentage of the total. Pattern shown for all vital signs and for vital signs categorised by VitalPAC Early Warning Score (ViEWS) value.

Pattern of vital signs observation sets recorded each hour of the day, categorised by day of week.
Stratification of each hourly total by ViEWS value demonstrated different patterns for each ViEWS group. The distribution of ViEWS values of 0–1 follows the pattern described above. However, for ViEWS values of 2, 3–6, 7–8 and ≥9, the degree of variability in the percentage of vital sign sets collected each hour reduced (figure 1).
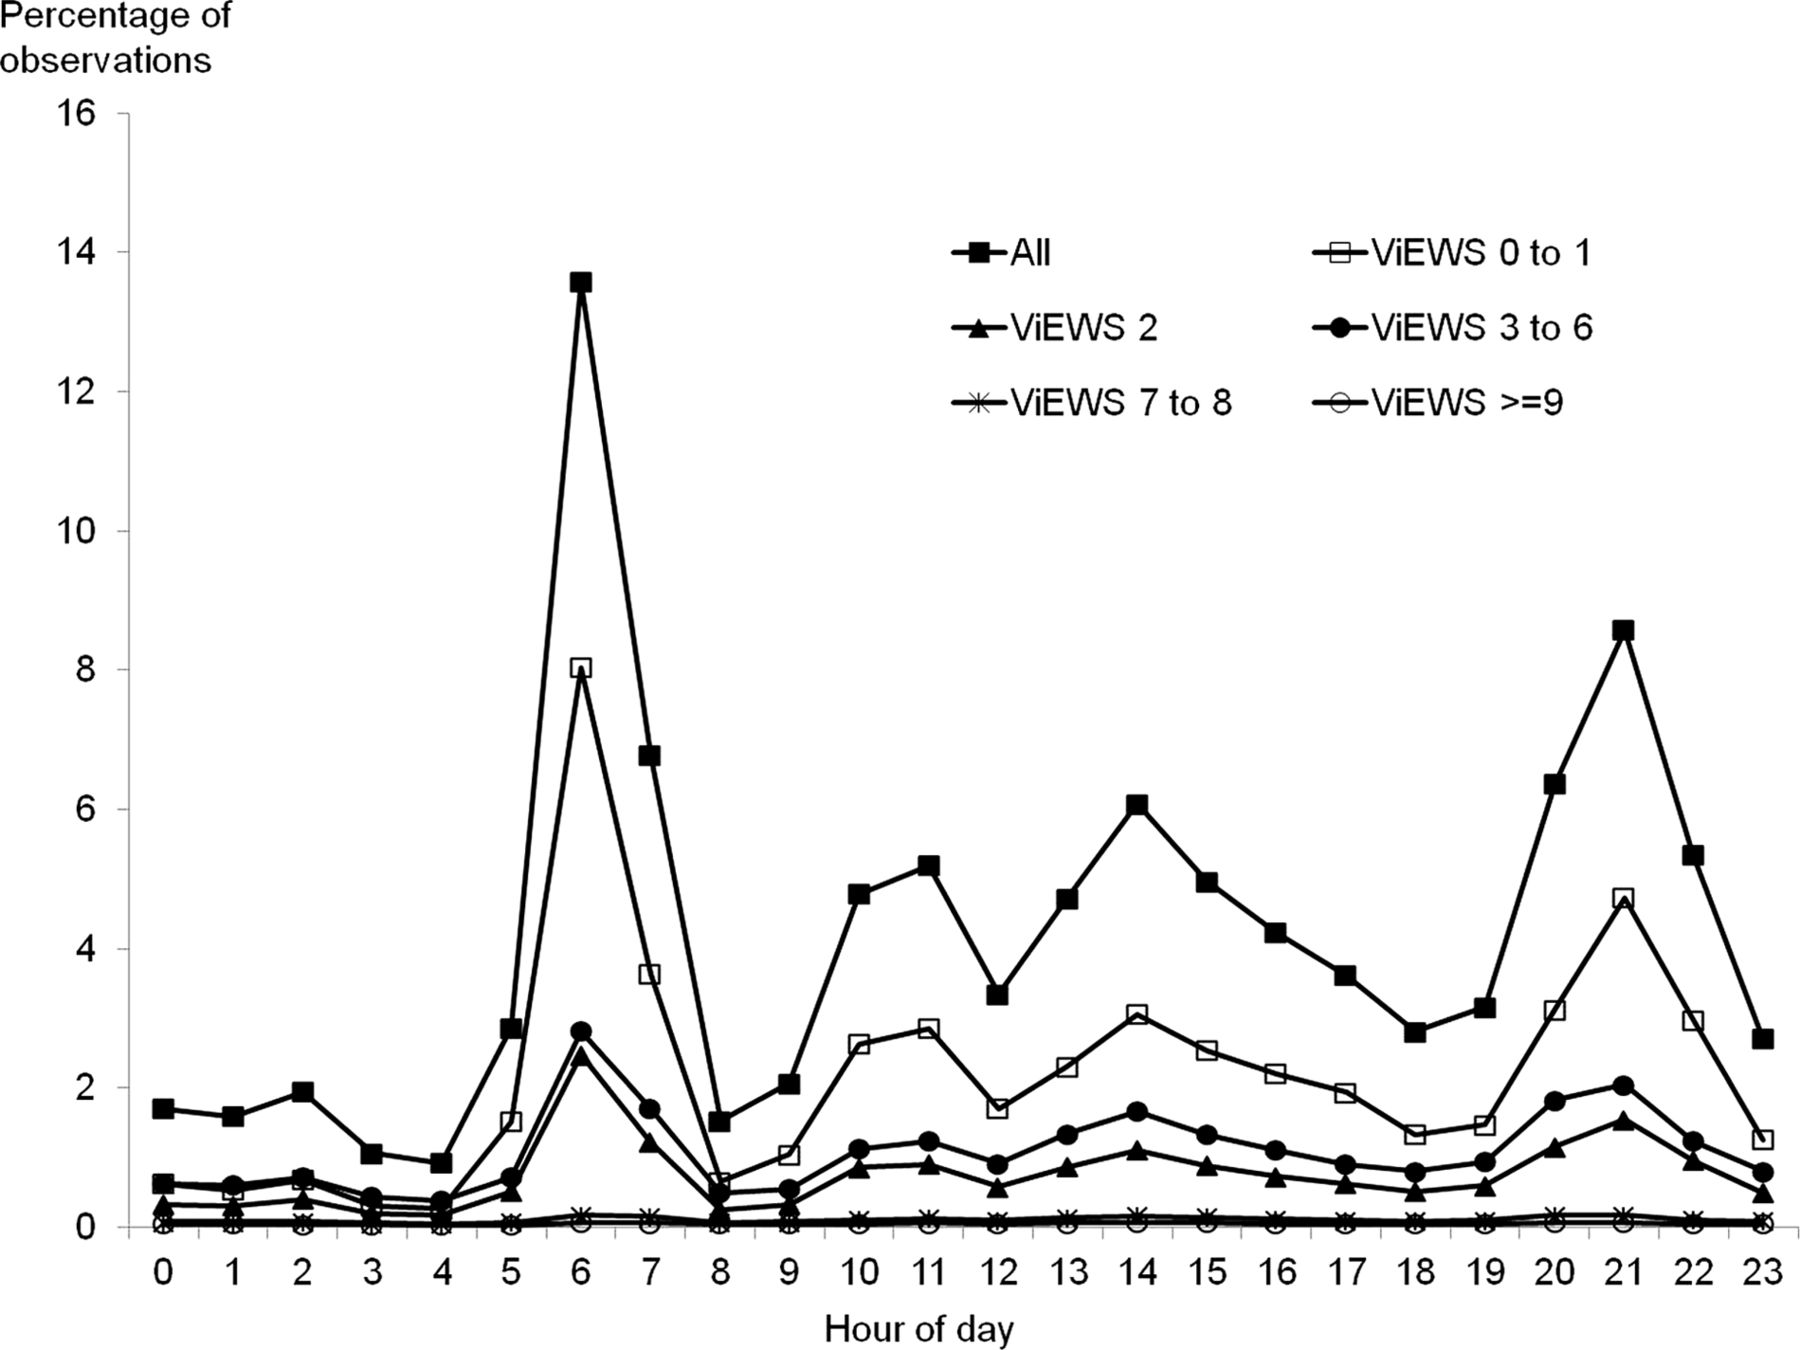
Comparing the proportions of vital sign sets collected in each ViEWS group each hour, expressed as a percentage of the total number in that ViEWS group during the 24 h period, shows that the variation for ViEWS values of ≥9 was much less (2.85–5.71%) than for any other ViEWS group: 0–1 (0.52–15.61%), 2 (0.99–13.70%), 3–6 (1.45–10.67%), 7–8 (2.18–6.65%) (figure 3). The proportion of vital sign datasets measured in the period 23:00–05:59 for ViEWS of ≥9 (23.84%) was greater than the proportion of values in any of the other ViEWS groups (10.12–19.97%) measured during the same period (figure 3), indicating that sicker patients were more likely to have vital signs measured through the night.
Pattern of vital signs observation sets recorded each hour of the day expressed as a percentage of the total number in that VitalPAC Early Warning Score (ViEWS) group during the 24 h period, categorised by ViEWS value.
There was a marked contrast in the adherence to the expected monitoring schedule during the daytime and night-time periods (table 2). A total of 95 085 vital sign observation datasets were recorded in the 08:00–11:59 subgroup. Of these, 69 511 (73.10%) had a subsequent vital sign dataset recorded in the following 6 h. However, of the 160 050 vital sign observation datasets recorded in the 20:00–23:59 subgroup, only 40 530 (25.32%) were followed by a subsequent vital sign dataset in the subsequent 6 h. Adherence to the hospital vital signs monitoring protocol was always greater during the daytime period, irrespective of ViEWS value (table 2).
Number of patients with a ViEWS value recorded in the periods 08:00–11:59 and 20:00–23:59 with a subsequent ViEWS value recorded in the following 6 h
The TTNO for the last ViEWS value recorded in the 08:00–11:59 and 20:00–23:59 subgroups, stratified by the last ViEWS value in the respective period, is shown in table 3. For each ViEWS value, the mean TTNO was higher for observations in the subgroup 20:00–23:59. In addition, the TTNO decreased with increasing ViEWS value groupings for both subgroups, but not to the extent demanded by the hospital's monitoring protocol.
The time between the last ViEWS value recorded in the periods 08:00–11:59 and 20:00–23:59 and the subsequent ViEWS value (ie, TTNO)
Discussion
This large study demonstrates that the pattern of recorded vital signs observations in the study hospital was not uniform across the 24 h period. In fact, there were substantial hourly differences in observation sampling frequency, with two large peaks in the morning and evening, and a lower sampling frequency at night-time compared with daytime. The pattern was identical irrespective of the day of the week. To our knowledge, these quantitative findings have not been reported previously.
When the hourly vital signs data were stratified by ViEWS value, the patterns differed considerably between groups, with less variability in the higher ViEWS groups. This suggests that staff do in fact manage patients with higher ViEWS values differently to those with lower values and that sicker patients are more likely to have vital signs measured overnight. Further evidence that this is the case is suggested in figure 3, in which the proportion of observations measured at night was highest for ViEWS values of ≥9 (23.84%). However, while an encouraging finding, it by no means implies that these patients were monitored sufficiently closely at night times.
Indeed we noted that, overnight, even observations that indicated that the patient was unwell were not necessarily followed by a subsequent vital signs assessment at a timely interval. Although sicker patients were more likely to have vital signs recorded before 06:00, 47.42% of observations with a ViEWS value in the range 7–8 and 31.22% of those with a ViEWS value ≥9 in the period 20:00–23:59 did not have a vital signs measurement recorded in the next 6 h period. In contrast, only 18.81% of observations with a ViEWS value in the range 7–8 and 13.35% of those with a ViEWS value ≥9 in the period 08:00–11:59 did not have a vital signs measurement recorded in the next 6 h period.
According to the hospital’s escalation policy, patients with a ViEWS value of 3–6 should have vital signs recorded at least every 4 h; those with a ViEWS value of 7–8 should have at least hourly recording of vital signs; and those with a ViEWS value of ≥9 should have vital signs recorded at least every 30 min. When a patient is being continuously monitored using electronic technology, a full set of vital signs data must be entered into VitalPAC using the ‘minimum interval’ algorithm (eg, for a patient with a previous ViEWS=7, data from a continuous device must be entered each hour). Interestingly, the TTNO values for these three groups were 5.64 h (ViEWS=3–6), 4.91 h (ViEWS=7–8) and 4.22 h (ViEWS≥9), respectively, during the daytime, and 7.88 h (ViEWS=3–6), 6.59 h (ViEWS=7–8) and 5.17 h (ViEWS≥9), respectively, during the night-time. Lower ViEWS values (0–6) were more likely to have a TTNO value closer to that expected than higher ViEWS values (≥7). This demonstrates that adherence to the hospital's recommendations for the frequency of vital signs monitoring is, at best, only partial.
Why should this be the case, given that clear decision support regarding the desirable frequency of vital signs monitoring is provided directly to the nurse at the bedside at each vital signs assessment? We believe that it is unlikely that the observed patterns are simply a function of bed occupancy at different times of the day. The lowest pattern of observations occurs overnight, when virtually all patients will be in bed. The two major peaks of observations at 06:00 and 21:00 do not correspond to any process other than the end and beginning of nursing night shifts. Admissions for elective surgery occur generally in the weekdays and surgery rarely takes place at night. Diagnostic tests rarely occur outside the period 09:00–17:00. Operations and investigations are also extremely uncommon at weekends, except for emergencies.
Figure 2 shows that the pattern of observations on each day of the week was identical, thereby making it unlikely that the patterns that we observed were due to operations, investigations or patient census.
Perhaps ward staff do not believe that using ViEWS and the escalation protocol is the best way of determining which patients require vital signs monitoring and, instead, choose to use their clinical judgement and professional expertise. Alternatively, it is possible that the escalation protocol chosen by the hospital, closely based on the recommendations of NICE,9 is inappropriate or imposes a vital signs observation routine that is unachievable, given staffing levels, monitoring equipment availability and the need to carry out other necessary clinical activities. While this protocol would appear to be reasonable and easily attainable, different patients with different EWS values will have different requirements with respect to the timing of their next observation set and this imposes stress on the system. In addition, measurement of vital signs needs to be fitted into a wide range of other important and competing patient (eg, washing, feeding, sleeping) and clinical (eg, ward rounds, clinical investigations, handovers, ward transfers) activities. These activities unavoidably impose their own rhythms on the measurement of vital signs.
Consequently, staff appear to have necessarily established predetermined hours of the day when they undertake 'observation rounds’, perhaps as a way of ensuring that as many patient and clinical activities can take place as possible without interrupting vital signs measurement. Such assessments may be undertaken in preparation for doctors’ ward rounds, or as a result of decisions or requests made on the rounds, and probably account for the large peaks in sampling frequency observed in our study at 06:00 and 21:00.
Does failure to follow the clinical escalation protocol matter? Perhaps, for if vital signs are abnormal, but are not measured, the full clinical escalation protocol cannot be followed and a rapid response team (RRT), such as an outreach or medical emergency team (MET), cannot be activated. The recent NCEPOD ‘Time to intervene?’ noted that while 97.9% of hospitals indicated that an EWS linked to an escalation protocol was in use, few patients having a cardiac arrest had clear monitoring plans and there appeared to be little evidence of instructions regarding criteria for timely escalation to more senior staff.10
Hence, the pattern of recording of vital sign observations is likely to have an impact on the pattern of activation of the RRT. Indeed the pattern of vital signs measurement noted in our study is similar to the pattern of MET activation, with peaks in the morning and few activations overnight, noted by Galhotra et al14 and Jones et al.15 Jones et al15 also reported a higher number of MET calls around the times of routine nursing observation, nursing handover, and after the commencement of the daily medical shift. In a separate study, Jones et al16 demonstrated that the peak levels of cardiac arrest detection occurred during 02:00–03:00 and 06:00–07:00 and is similar to the work of Matot et al,17 who showed that 43% of in-hospital arrests occurred during the night, with high levels of unwitnessed arrests. If, as seems plausible, the patterns of vital signs measurement, RRT activation and cardiac arrest seen in our study and others13–16 describe a cause and effect relationship, failure to undertake timely vital signs observations has major significance for the effectiveness of any rapid response system.
The identification of the failure of the staff in our study to follow a clinical vital signs monitoring protocol echoes the recent findings around failure to follow RRT calling instructions.18 Shearer et al18 showed that, even when clear escalation instructions for calling a RRT exist, and patients meet the criteria, staff do not always make the call. This was the case even when staff recognised that a patient met the calling criteria and were concerned about the patient's condition. In subsequent interviews, many staff indicated that they had chosen not to call the RRT while further clinical investigations and clinical reviews were pending; others felt that the bedside clinical team had enough experience to manage the situation without calling the RRT. Other reasons for failing to follow the protocol were poor communication and prioritisation by the medical team involved, and failure to repeat abnormal observations. They also suggested that ward staff may feel that the sensitivity and specificity of rapid response system activation criteria have insufficient ‘face validity’. It is possible that desensitisation occurs if, from the viewpoint of ward staff, failure to measure vital signs or call a RRT results in no obvious adverse outcome for the patient. As with our suggestion of local prioritisation of vital signs measurement by staff to take account of other important patient and clinical activities, staffing levels and monitoring equipment availability, staff in the study by Shearer et al18 appeared to have re-prioritised rapid response system activation based on the clinical scenario, the environment, status of pending investigations, perceived competence of attending medical staff, and degree of involvement of critical care staff.
There are strengths and weaknesses in our study. A major strength is that data were entered directly into electronic devices at the bedside as part of patients’ clinical management. The database comprised 950 043 complete vital sign datasets from all patients across all specialities for a calendar year, with each dataset having an accurate date/time stamp. No retrospective chart review of paper and pen recorded data could hope to replicate data collection, extraction, analysis or audit on this scale. While possible transcription errors were eliminated, the collection of vital signs measurements followed traditional nursing practice. As such, the measurements and data input were not validated. The occasional recording mistake is bound to occur as a result of human factors, but the effect of this is minimised by the size of the database. Perhaps the biggest weakness relates to patients who were monitored using electronic technology. For such patients, the hospital's escalation protocol dictates that a full set of vital signs data should be entered into VitalPAC using the ‘minimum interval’ algorithm. That some patients may be monitored using continuous monitoring and that staff may, for reasons unknown, fail to enter vital sign sets into VitalPAC using the ‘minimum interval’ algorithm means that some vital signs data may be missing. However, as VitalPAC provides the hospital's electronic record of the patient's vital signs and the primary aim of the research was to describe the pattern of documentation of vital signs, this should not materially impact upon our findings. Finally, the study was undertaken in a single hospital and there is no guarantee that similar results would be obtained in other locations, clinical settings or patient groups.
There is little scientific evidence regarding the optimal frequency for vital signs measurement in hospitalised patients, with current practices and recommendations being based almost entirely on tradition and opinion.9 ,19 Therefore, future research should focus on the timing and rate of progression of patient deterioration, as this is essential to identifying the most appropriate frequency of vital signs monitoring. If the patterns that we observed exist in other hospitals, it may be pertinent to study the impact of monitoring patterns on patient outcomes, and to study the patterns in different specialities, and areas with different levels of acuity in future research. Perhaps, it would also be of value to explore whether, in addition to continuing the practice of vital signs ‘rounds’, the development of a separate, designated, clinical team whose role is to focus on patients who have developed a high or rising EWS would be beneficial.
Our data validate the views of staff interviewed by the NPSA, who commented that staff ‘rarely carry out routine observations during the night (between 10.30 pm to 6 am)’ and that ‘observations are seen as tasks with a low priority’.7 Additionally, the failure of staff to follow a vital signs monitoring plan, similar to that described by NICE, may mean that these guidelines need re-evaluation. Finally, our work and that of Shearer et al18 and NCEPOD,10 when taken together, indicate significant deficits in at least three parts of the ‘chain of prevention’12: monitoring, recognition and calling for help. These studies show that, despite the presence of clear clinical protocols, staff often fail to follow them. Future work is required to understand the local social, cultural and interprofessional issues that may prevent staff from recording vital signs and acting upon them, even when this contravenes the hospital policy. In addition, perhaps our findings make a compelling case for the remote continuous monitoring of vital signs in all hospitalised patients using electronic systems20 ,21 and for the development of reliable and accurate methods for the automatic calling of a RRT.
Acknowledgments
The authors would like to acknowledge the cooperation of the nursing and medical staff in the study hospital.
References
Footnotes
-
Contributors PIF and PES facilitated the data collection for this study. PM constructed the databases and DRP, CH and ER undertook the data analysis. GBS, CH and DRP drafted the initial manuscript. All authors contributed to the study design, and reviewed and edited the final manuscript.
-
Competing interests VitalPAC is a collaborative development of The Learning Clinic Ltd (TLC) and Portsmouth Hospitals NHS Trust (PHT). PHT has a royalty agreement with TLC to pay for the use of PHT intellectual property within the VitalPAC product. Professor Prytherch and Drs Schmidt, Featherstone and Meredith are employed by PHT. Professor Smith was an employee of PHT until 31 March 2011. Dr Schmidt and the wives of Professors Smith and Prytherch are shareholders in TLC. Professors Smith and Prytherch and Dr Schmidt are unpaid research advisors to TLC. Professors Smith and Prytherch have received reimbursement of travel expenses from TLC for attending symposia in the UK. Professor Smith acted as expert advisor to the National Institute for Health and Clinical Excellence during the development of the NICE clinical guideline 50: ‘Acutely ill patients in hospital: recognition of and response to acute illness in adults in hospital’. He was also a member of the National Patient Safety Agency Committee that wrote the two reports: ‘Recognising and responding appropriately to early signs of deterioration in hospitalised patients’ and 'Safer care for the acutely ill patient: learning from serious incidents’.
-
Ethics approval Local research ethics committee approval was obtained for this study from the Isle of Wight, Portsmouth and South East Hampshire Research Ethics Committee (study ref. 08/02/1394).
-
Provenance and peer review Not commissioned; externally peer reviewed.
-
Data sharing statement All authors had full access to all of the data (including statistical reports and tables) in the study and can take responsibility for the integrity of the data and the accuracy of the data analysis. Professor Smith will act as the guarantor of the paper.