Article Text

Abstract
Background Medicolegal agencies—such as malpractice insurers, medical boards and complaints bodies—are mostly passive regulators; they react to episodes of substandard care, rather than intervening to prevent them. At least part of the explanation for this reactive role lies in the widely recognised difficulty of making robust predictions about medicolegal risk at the individual clinician level. We aimed to develop a simple, reliable scoring system for predicting Australian doctors’ risks of becoming the subject of repeated patient complaints.
Methods Using routinely collected administrative data, we constructed a national sample of 13 849 formal complaints against 8424 doctors. The complaints were lodged by patients with state health service commissions in Australia over a 12-year period. We used multivariate logistic regression analysis to identify predictors of subsequent complaints, defined as another complaint occurring within 2 years of an index complaint. Model estimates were then used to derive a simple predictive algorithm, designed for application at the doctor level.
Results The PRONE (Predicted Risk Of New Event) score is a 22-point scoring system that indicates a doctor's future complaint risk based on four variables: a doctor's specialty and sex, the number of previous complaints and the time since the last complaint. The PRONE score performed well in predicting subsequent complaints, exhibiting strong validity and reliability and reasonable goodness of fit (c-statistic=0.70).
Conclusions The PRONE score appears to be a valid method for assessing individual doctors’ risks of attracting recurrent complaints. Regulators could harness such information to target quality improvement interventions, and prevent substandard care and patient dissatisfaction. The approach we describe should be replicable in other agencies that handle large numbers of patient complaints or malpractice claims.
- Quality improvement
- Risk management
- Governance
- Healthcare quality improvement
This is an Open Access article distributed in accordance with the Creative Commons Attribution Non Commercial (CC BY-NC 4.0) license, which permits others to distribute, remix, adapt, build upon this work non-commercially, and license their derivative works on different terms, provided the original work is properly cited and the use is non-commercial. See: http://creativecommons.org/licenses/by-nc/4.0/
Statistics from Altmetric.com
Introduction
Medicolegal agencies—such as malpractice insurers, medical boards and complaints handling bodies—are essentially reactive regulators: they deal with the aftermath of care that has gone badly. This posture has confined them largely to the sidelines of the patient safety movement. Clinicians eye medicolegal processes with scepticism and fear, and sometimes with outright disdain. The ex post nature of these processes, coupled with their focus on provider fault, is derided as antithetical to quality improvement efforts focused on prevention and systemic causes of harm.1
Part of the explanation for medicolegal agencies’ limited role lies in their inability to make reliable predictions about which clinicians will experience complaints or claims. The conventional wisdom is that these events cannot be predicted at the individual practitioner level with acceptable levels of accuracy. Numerous studies have tried,2–12 with limited success.
In a recent national study13 of formal patient complaints against Australian doctors lodged with state regulators, we found that 3% of doctors (or 18% of doctors with at least one complaint) accounted for half of all complaints lodged over a 10 year period. We proposed and tested a new method for identifying doctors at high risk of incurring repeated medicolegal events. Among doctors who had already incurred one or more complaints, we found that risks of incurring more complaints in the near term varied dramatically—from less than 10% to more than 80%—depending on certain observable characteristics, or risk factors. However, one limitation of the method we deployed, recurrent event survival analysis, is its complexity. Few health regulators are likely to have the technical capacity to replicate this approach, much less incorporate it into their front-line case management activities. Relatedly, although survival analysis accounts well for changing baseline risk over time, it does not generally provide estimates of these risks that can be easily integrated into a risk algorithm.
In this study, we extended our analysis of patient complaints to create a simple predictive algorithm. Our immediate objective was to provide health complaints commissions in Australia with a tool that would allow them to reliably estimate practitioners’ future risk of complaints in ways that could support proactive intervention. More generally, we sought to demonstrate the feasibility of using routinely collected administrative data to construct a risk calculator for predicting medicolegal events.
Methods
Setting
Health complaints commissions (Commissions) are statutory agencies established in each of Australia's six states and two territories. Commissions have responsibility for receiving and resolving patient complaints about the quality of healthcare services. Patients or their advocates must initiate complaints in writing, but the process is free and legal representation is optional.14
Outside the clinic or hospital where care is rendered, Commissions are the primary avenue of redress for patients dissatisfied with the quality of care they have received. Plaintiffs’ lawyers in Australia will rarely take cases unless they have first proceeded through Commission processes (although the vast majority of complaints do not go on to become malpractice claims). At least 10 other Organisation for Economic Co-operation and Development countries—including Austria, Finland, Israel and New Zealand—have similar bodies.15 ,16 In the UK, the closest analogue is the Parliamentary and Health Service Ombudsman.
Commissions in all Australian states except South Australia participated in the study. In 2011, these seven jurisdictions had 21 million residents and 90% of the nation's 70 200 practicing doctors.17
Data
Between May 2011 and February 2012 we collected data on-site at Commission offices in each participating state and territory. Complaints against doctors were identified by querying the Commissions’ administrative data systems. The filing period of interest spanned 12 years and differed slightly by jurisdiction: 2000–2011 for the Australian Capital Territory, the Northern Territory, Queensland, Tasmania and Victoria; 2000–2010 for Western Australia; and 2006–2011 for New South Wales. (Changes to the data system in New South Wales necessitated a narrower sampling window there.) As described elsewhere,13 we supplemented administrative data from the Commissions with additional doctor-level variables obtained from a database on Australian doctors held by AMPCo Direct, a subsidiary of the Australian Medical Association.
All data were combined in a complaint-level analytical data set, in which multiple complaints against a single doctor could be observed.
Variables
Our unit of analysis was the complaint. The primary outcome was the occurrence of a ‘subsequent’ complaint, defined as a complaint that occurred soon after a prior one. Specifically, a complaint against a doctor within 2 years of the most recent complaint against that doctor was coded ‘1’; a complaint that was not followed by another during the 2-year window, was coded ‘0’. To allow sufficient follow-up time, complaints that occurred within 24 months of the end of a jurisdiction's data period (2011 in all but one jurisdiction) were included in the analysis as subsequent complaints but not as index complaints. We chose a 2-year window based on our discussions with regulators in Australia and New Zealand, who indicated that this is generally the time horizon of interest to them in their efforts to separate complaint-prone practitioners from respondents whose appearance reflects merely ‘baseline’ risks of being complained against.
The set of predictors we examined consisted of variables measured at the doctor level (specialty, age, sex, location of practice) and the complaint level (number of previous complaints, time since previous complaint, complaint issue). Doctor age and all complaint level variables were coded as time-varying variables, meaning their values related to the most recent complaint. Specialty was classified into 13 categories, based on those promulgated by the Medical Board of Australia.18 Doctor age was coded as <35 years or 35–65 years. (Doctors older than 65 years were excluded because of possible bias due to unobserved censoring: an absence of further complaints may have been due to retirement). Principal practice address was classified as urban or rural, based on the location of its postcode within a standard geographical classification system.19 Subsequent complaints were categorised by time intervals (<6 months after the most recent complaint, 6 months to <1 year, 1–2 years).
Complaint issue in the most recent complaint was coded into two categories: complaints in which the primary issue related to clinical care (treatment; diagnosis; medication; hygiene or infection control; discharge or transfer; other clinical care issues) and complaints with other primary issues (communication; costs or billing, medical records, certificates or reports; access and timelines, sexual contact or relationship; rough or painful treatment; confidentiality or information privacy; breach of conditions; grievance handling; discrimination; other issues).
Statistical model
We used multivariate logistic regression analysis to estimate odds of a subsequent complaint within 2 years. The predictors were number of previous complaints; time since previous complaint; complaint issue; and specialty, age, sex and practice location of the doctor against whom the complaint was made. Cluster-adjusted robust SEs were calculated to account for multiple observations pertaining to single doctors.
We estimated and compared three models: Model 1 used all available predictors; Model 2 focused on a subset of predictors that tend to be the most straightforward for regulators to obtain from routine operational data; and Model 3 had only one predictor, the variable most strongly associated with the outcome. Our goal was to identify the model that best balanced model fit against parsimony. The primary basis for comparing the models’ performance was the c-statistic (or area under the receiver operating characteristic (ROC) curve). We computed c-statistics, adjusting them for optimism to guard against overfitting using a bootstrap sampling approach.20 (Details of the adjustment-for-optimism method of cross validation are provided in the online supplementary appendix) We tested whether the unadjusted c-statistic for Model 1 was significantly different from Model 2, and whether Model 2 was significantly different from Model 3. Finally, as a sensitivity analysis, we repeated our analysis using only complaints over clinical care. All analyses were conducted using Stata V.13.1.21
Construction of the PRONE score
We sought to design a scoring system with the following features: (1) each risk factor is assigned a prespecified number of points, expressed in whole numbers; (2) the assigned points are proportionate to the ORs from the underlying model and discriminate well between differences in ORs; (3) points assigned to individual risk factors sum to produce a total risk score; (4) total scores are expressed across a range of approximately 20 values; and (5) the risk score is designed to be calculated anew at the doctor level each time a new complaint is lodged.
Once the preferred model was chosen, we assigned points to each predictor, indexing point values to the values of the model coefficients (the log ORs). The scoring system features we sought were best achieved by multiplying each coefficient by 3.7 and rounding to the closest integer. Summation of points across the risk factors produced a score ranging from 0 to 21. We dubbed this the PRONE (Predicted Risk Of New Event) score.
Analysis of performance of PRONE score
We assessed the performance of the PRONE score in three ways. First, to determine whether precision was lost in transforming coefficients from the multivariate model to crude integers for the PRONE score, we plotted ROC curves for the model coefficients and the scores and compared them. Second, to assess calibration of the PRONE score (ie, how closely the predicted probability of a subsequent complaint reflected actual risk22), we calculated and compared the observed and expected number of new complaints at each value of the PRONE score. The expected number of complaints was estimated by calculating P(Complaint)=exp(β1+β2(PRONE score))/(1+exp(β1+β2(PRONE score)) and multiplying these probabilities by the total number of doctors with each PRONE score. The Hosmer-Lemeshow χ2 statistic was used to assess whether expected scores differed from observed scores.23 Finally, we calculated sensitivity and specificity of the PRONE score at three levels that have policy relevance, in the sense that they represent potential thresholds for regulatory intervention.
Results
There were 13 849 complaints in the analytical sample. A total of 8424 doctors were the subject of an initial complaint to Commissions and 31% (2586/8424) of them had subsequent complaints. There were a total of 6427 subsequent complaints, 70% (4488/6427) of which occurred within 2 years.
Sample characteristics
Table 1 describes characteristics of the doctors and complaints in our study sample. Sixty per cent of the complaints addressed clinical aspects of care, most commonly concerns with treatment (39%), diagnosis (16%) and medications (8%). About a fifth of complaints addressed communication issues, including concerns with the attitude or manner of doctors (13%), and the quality or amount of information provided (6%).
Characteristics of complaints and doctors who were the subject of the complaints
Nearly half of the doctors complained against were general practitioners and 15% were surgeons. Seventy-nine per cent were male and 80% were 35–65 years of age. On average, 398 days (SD 497 days) elapsed between the index and subsequent complaints. There was a trivial amount of missing data (<1%) for all variables except age (14%).
Choice of multivariate prediction model
All of the variables considered in Model 1, except the variable indicating the previous complaint related to clinical care, were statistically significant predictors of subsequent complaints, and this model had a c-statistic of 0.69 after adjusting for optimism (table 2). Model 2 dropped doctor age, the clinical care variable and practice location (a variable many regulators do not routinely collect). All four remaining variables were statistically significant predictors of subsequent complaints, and discrimination in this model (c-statistic=0.70) was very close to Model 1's, although there was a statistically significant difference between the c-statistics for the two models (p=0.018).
Logistic regression models for risk of complaints within 2 years, and Predicted Risk Of New Event (PRONE) scoring system, derived from the ORs in model 2
Model 3 consisted only of the number of prior complaints variable, which was clearly the strongest predictor of subsequent complaints in models 1 and 2. Although this predictor on its own showed reasonable discrimination (c-statistic=0.66), there was strong evidence that its fit was inferior to the other two models (p<0.0001 in both comparisons).
Therefore, considering parsimony, discriminative ability and potential practicality, we selected Model 2 as the basis for the PRONE score algorithm. The far right column in table 2 shows the PRONE score points assigned to each predictor, based on the corresponding coefficients from Model 2. Other commonly used approaches—for instance, assigning a point for every 100% increase in ORs—produced similar results (data not shown).
To test the robustness of our results, we refit our models using only those complaints that related to clinical care. The c-statistics for these three models were 0.69, 0.70 and 0.65, respectively, and the ORs were similar to those reported above (see Models 4, 5 and 6 in online supplementary appendix table S1).
Performance of PRONE score
A comparison of ROC curves for the PRONE score and the coefficients estimated in Model 2 showed almost perfect overlap, suggesting little if any discrimination was lost in transforming the model's coefficients to the scoring system (see online supplementary appendix figure S1).
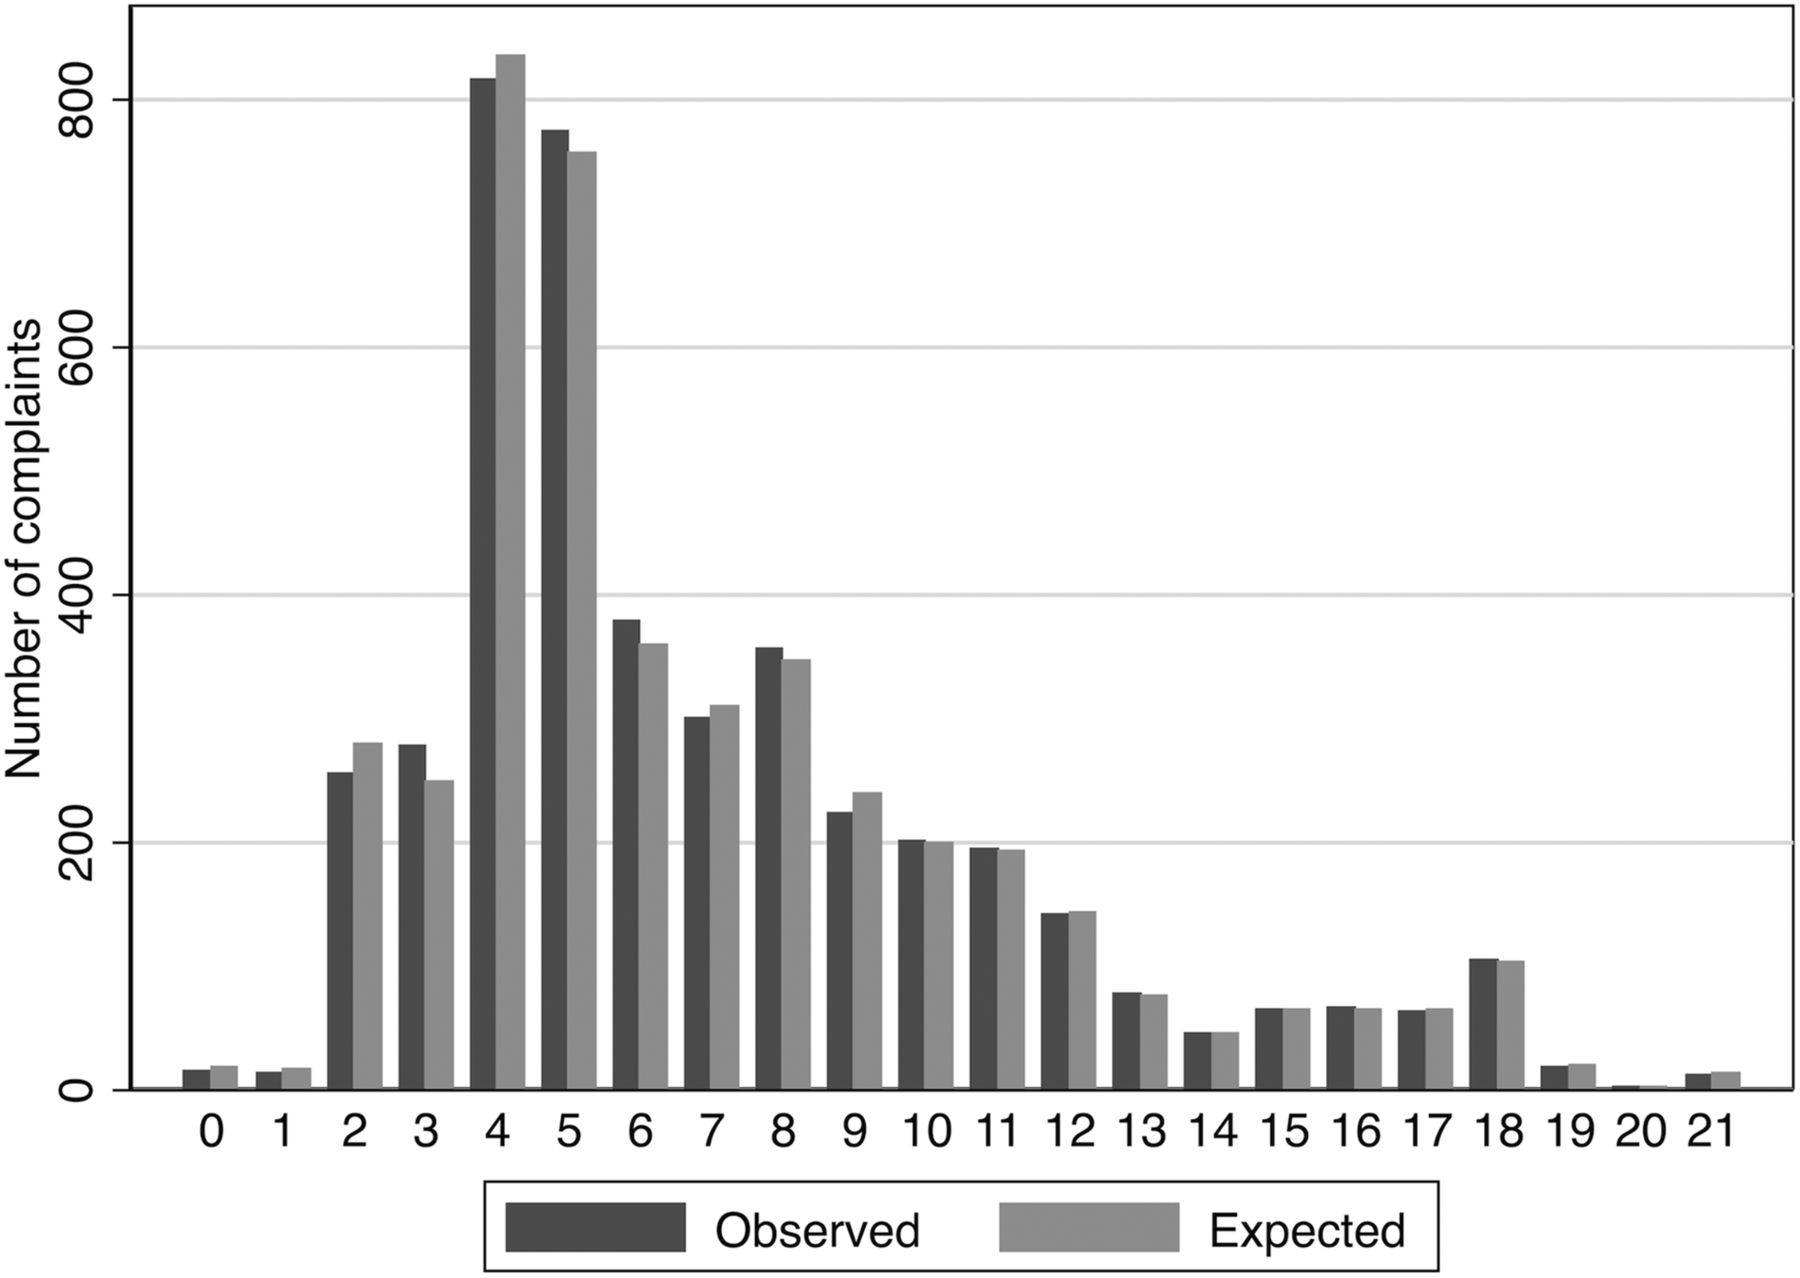
Figure 1 shows, at each level of the PRONE score, the number of complaints predicted by the score alongside the number actually observed. The Hosmer-Lemeshaw χ2 statistic was non-significant, χ2(20)=21.83, p=0.35, suggesting that PRONE scores corresponded closely to actual risk. The distribution of observed and expected complaints by PRONE score indicates some skewness, with scores centred around values of 4 and 5.

Calibration curves for 22-point PRONE (Predicted Risk Of New Event) score.
PRONE score predictions
Table 3 shows the frequency and risk of subsequent complaints within seven PRONE score groups. Risk increased monotonically with PRONE score. For example, among 2000 doctors whose index complaint scored between 0 and 2, 285 of them actually had a subsequent complaint, a 2-year risk of 14.2%. Among 221 doctors with PRONE scores between 15 and 17, 194 had subsequent complaints, a risk of 87.8%.
Frequency and risk of complaint within 2 years, by Predicted Risk Of New Event (PRONE) score groups
Thresholds for intervention
Decisions regarding suitable score thresholds for intervention involve a trade-off between sensitivity and specificity, and are likely to be influenced by the effectiveness, intrusiveness and cost of the intervention. While the exact nature of such interventions is beyond the scope of this paper, we use three hypothetical examples to illustrate the nature of these trade-offs. (We note that some of these interventions may fall outside current statutory powers of Australian Commissioners.)
Table 3 depicts three possible interventions: (1) advising doctors in writing that they are at risk of a future complaint; (2) compelling doctors to undertake a continuing medical education course on a topic that addresses issues commonly arising in their complaint profile; and (3) referral to a regulator (eg, medical board) for further action. For a low cost, relatively unintrusive intervention, such as an informational letter, a reasonably low threshold for intervention is appropriate. This will ensure that most doctors at risk of a subsequent complaint will receive the intervention (high sensitivity), although many letter recipients will not actually go on to incur further complaints (low specificity). A cut point of 3 or more on the PRONE score, which has sensitivity of 94% and a specificity of 19%, may be a reasonable threshold for this type of intervention.
A much sterner intervention, such as referral to a medical board for assessment and possible further action, would impose a significant burden on affected doctors, and would also generate substantial costs for regulators. For such interventions, there should be high confidence that the practitioner will in fact incur additional complaints in the near term (high specificity), even though setting tolerances in that way will mean that a non-trivial number of doctors who will incur additional complaints will fall below the threshold (low sensitivity). A PRONE score of 12 or more has specificity of 99% and sensitivity of 13%.
Requiring doctors at relatively high risk of additional complaints to undertake a relevant continuing medical education course is an example of intervention that is moderately intrusive. The PRONE score threshold triggering such an intervention should seek to strike a balance between sensitivity and specificity. A cut point of 5 or more, for example, would achieve sensitivity of 69% and specificity of 58%.
Discussion
The PRONE score exhibited strong predictive properties and has considerable potential as a tool for determining the likelihood that doctors named in complaints will reappear as the subjects of additional complaints in the near future. The precise contours of the algorithm we report map directly to complaints lodged with health service commissions in Australia, not other settings. However, the evidence presented of the feasibility and potential value of this approach has wider implications. It is ripe for testing and possible replication in other places and agencies, including liability insurers and medical boards.
Previous attempts4–8 ,10 ,24 ,25 to predict medicolegal risk have substantial limitations and, to the best of our knowledge, none, with the exception of the Patient at Risk Score (PARS) score developed by Hickson et al,8 has attempted to convert findings into an user-friendly scoring system to guide interventions. An impressive feature of the PARS system is that it links scores to a suite of doctor-focused interventions aimed at preventing recurrence. However, the PARS predictive algorithm is based on patient complaints accumulated in a handful of hospitals, not a population-wide sample of complaints. Three of the four variables used in PARS are similar to PRONE—namely, doctor's sex, specialty group (surgeons vs non-surgeons) and complaint count. PARS also has a variable for clinical activity, which PRONE does not have. Beyond that, it is very difficult to compare PRONE with PARS because details of the structure and performance of the identification algorithm used in PARS have not been published.
This study extends a recent analysis13 of patient complaints against Australian doctors. Our earlier analysis showed that the incidence of complaints was extremely skewed, and ‘frequent flyers’ accounted for a very substantial proportion of all complaints; it also demonstrated the feasibility of identifying those frequent flyers early in the trajectory of their complaints profile. This study takes an important next step: converting such predictive modelling into a simple risk scoring system that is amenable to routine use by regulators.
Our approach differs from previous attempts to predict medicolegal risk in two main respects: inclusion of time-varying predictors (such as a continuously changing measure of prior events) and a focus on practitioners who have already experienced at least one complaint. These distinctive aspects of our analytical design boost our ability to make stronger risk predictions than earlier studies have.
How might the PRONE score be used in practice? We envision two ways it could be incorporated into the complaint-handling process. First, because the score can be recalculated each time a new complaint is lodged, it could be useful for ‘red-flagging’ cases for a deeper file review—for example, reviewing all previous complaints against a practitioner to ascertain if there are any troubling patterns. Second, the score could be useful for ‘tiering’ interventions. For example, a low PRONE score may suggest that minimal action is required beyond resolution of the immediate complaint, while a high score may prompt a regulator to consider whether more active intervention is needed to guard against the risk of future harm.
The strengths of the PRONE score are that it is simple and relies on information that most complaint-handling or claim-handling bodies collect routinely. Its predictive properties, based on the risk of a subsequent complaint within each score band, are fairly good. Although the c-statistic (0.70) for the multivariate model from which the scoring system is derived indicates only moderate discrimination, our various tests of PRONE score performance were encouraging; in particular, we observed few ‘false positives’ among doctors who score in the upper reaches of the scale (>15), which is where the scoring system performs best.
However, our study also has several limitations. First, factors others than those we considered predict complaints. For example, patient and doctor characteristics,26 ,27 aspects of the doctor-patient relationship,28 ,29 and the system in which the doctor works30 ,31 are all known to affect patient dissatisfaction and subsequent complaining and claiming behaviour. However, the difficulty regulators face in measuring such factors across an entire case load makes them poor candidates for a risk calculator intended for routine use.
Nonetheless, recognition that unobserved variables may influence a practitioner's complaint risk is crucial at the point of intervention. Environmental or system-related factors—such as solo practice, poor information systems or especially challenging patient populations—are particularly powerful examples of confounding factors. The relationship between individual-related and system-related causes of poor quality care is complex.32 But the coexistence of observed individual factors and unobserved systemic factors does not negate the value of the PRONE score. Even in situations where a practitioner’s outlier status is explained primarily by systemic causes, the score may be an effective way of spotlighting practice environments of concern. Thus, the score is best understood as a method of identifying practitioners whose behaviour and event history warrants special attention and further investigation, rather than a direct determinant of the type of action needed to improve quality.
Third, risk factors acting in concert (ie, interaction effects) may increase or decrease risk of subsequent complaints. Inclusion of interactions may increase the score's predictive power, but at the expense of simplicity, which could act as a barrier to adoption by regulators. In exploratory analyses we found only one significant interaction (between complaint number and specialty). It was a poor candidate for inclusion in the score however, because it would substantially increase the number of parameters without improving discrimination.
Third, we used head counts of practitioners, not more sophisticated measures of doctors’ exposure to complaint risk, such as volume of patients treated or procedures conducted. Fourth, we used logistic regression to develop our predictive model. This approach allowed us to directly estimate time parameters (eg, time since last complaint). Since the risk of a new complaint decreases over time, this allowed the resultant PRONE score to increase, decrease or remain unchanged at each new calculation of a doctor's score. Disadvantages of this approach are that it does not fully account for changing baseline risk and the subjectivity associated with choice of time cut points. Survival analysis, which we used in our previous analysis of complaints,13 deals better with these issues, but has its own disadvantages: it cannot handle time-related predictor variables, risk scores can only increase, and it is a difficult approach to explain to regulators.
Fifth, although our methodology should be generalisable to other medicolegal settings, the extent to which it actually is is unknown. The potential gains from replication in other settings depend on three key factors: (1) the proportion of all events attributable to multievent practitioners; (2) the capacity of available predictors to reliably estimate those events; and (3) the size of the reference population. If the proportion of all events attributable to multievent practitioners is small, or data catchment relates to a relatively small population (eg, a single hospital), this would undermine the usefulness and feasibility of risk prediction. Health regulators and liability insurers interested in developing an approach like the PRONE score should be attentive to these factors.
Finally, even if the PRONE score were to be adopted and deployed effectively, it is insufficient, on its own, to improve the quality and safety of care. It is merely the ‘front end’ of a quality improvement strategy. The scoring system must connect to interventions that work. Exactly what those interventions are, and how they interlock with the scoring system, lie beyond the scope of this study, although table 4 exemplified the types of approaches that regulators are likely to find attractive.
Precision and rationale of thresholds on the Predicted Risk Of New Event (PRONE) score for three indicative interventions
A risk calculator, like the PRONE score, could be deployed retrospectively or prospectively. As part of a general case load review, such an algorithm could be applied to identify practitioners at highest risk of further events and in need of prompt intervention. Another approach would be to incorporate the tool into day-to-day handling of complaints or claims, giving regulators an ability to observe ascending levels of risk and tailor responses accordingly. The potential for prospective use is particularly novel and exciting because it holds the promise of ushering medicolegal agencies into the prevention business. However, such uses would inevitably raise ethical and legal challenges. The best way to deflect those challenges may be to ensure that, in any attempt to make levels of predicted risk trigger points for intervention, the intrusiveness of the intervention is well matched to the confidence of the prediction.
Acknowledgments
The authors thank the health services commissioners and their staff in the Australian Capital Territory, New South Wales, the Northern Territory, Queensland, South Australia, Tasmania, Victoria and Western Australia; their support, assistance and advice made this study possible.
References
Supplementary materials
Supplementary Data
This web only file has been produced by the BMJ Publishing Group from an electronic file supplied by the author(s) and has not been edited for content.
Files in this Data Supplement:
- Data supplement 1 - Online supplement
Footnotes
-
Twitter Follow Marie Bismark at @mbismark
-
Contributors MJS, MB, and DMS devised the study. MJS and MB collected the data. MJS undertook the analysis and wrote the first draft. MB and DMS contributed to the interpretation of the results and manuscript revision.
-
Funding The study was funded by an ARC Laureate Fellowship (FL110100102 to DMS) from the Australian Research Council. The research was conducted independently from the funder.
-
Competing interests None.
-
Ethics approval Human Research Ethics Committee, University of Melbourne.
-
Provenance and peer review Not commissioned; externally peer reviewed.
-
Data sharing statement The study data are owned by state health complaint commissions. Permission was granted to use it for purposes of the study, but not for any other use.