Article Text

Abstract
Background Studies finding higher mortality rates for patients admitted to hospital at weekends rely on routine administrative data to adjust for risk of death, but these data may not adequately capture severity of illness. We examined how rates of patient arrival at accident and emergency (A&E) departments by ambulance—a marker of illness severity—were associated with in-hospital mortality by day and time of attendance.
Methods Retrospective observational study of 3 027 946 admissions to 140 non-specialist hospital trusts in England between April 2013 and February 2014. Patient admissions were linked with A&E records containing mode of arrival and date and time of attendance. We classified arrival times by day of the week and daytime (07:00 to 18:59) versus night (19:00 to 06:59 the following day). We examined the association with in-hospital mortality within 30 days using multivariate logistic regression.
Results Over the week, 20.9% of daytime arrivals were in the highest risk quintile compared with 18.5% for night arrivals. Daytime arrivals on Sundays contained the highest proportion of patients in the highest risk quintile at 21.6%. Proportions of admitted patients brought in by ambulance were substantially higher at night and higher on Saturday (61.1%) and Sunday (60.1%) daytimes compared with other daytimes in the week (57.0%). Without adjusting for arrival by ambulance, risk-adjusted mortality for patients arriving at night was higher than for daytime attendances on Wednesday (0.16 percentage points). Compared with Wednesday daytime, risk-adjusted mortality was also higher on Thursday night (0.15 percentage points) and increased throughout the weekend from Saturday daytime (0.16 percentage points) to Sunday night (0.26 percentage points). After adjusting for arrival by ambulance, the raised mortality only reached statistical significance for patients arriving at A&E on Sunday daytime (0.17 percentage points).
Conclusion Using conventional risk-adjustment methods, there appears to be a higher risk of mortality following emergency admission to hospital at nights and at weekends. After accounting for mode of arrival at hospital, this pattern changes substantially, with no increased risk of mortality following admission at night or for any period of the weekend apart from Sunday daytime. This suggests that risk-adjustment based on inpatient administrative data does not adequately account for illness severity and that elevated mortality at weekends and at night reflects a higher proportion of more severely ill patients arriving by ambulance at these times.
- Emergency department
- Health services research
- Mortality (standardized mortality ratios)
- Standards of care
This is an Open Access article distributed in accordance with the Creative Commons Attribution Non Commercial (CC BY-NC 4.0) license, which permits others to distribute, remix, adapt, build upon this work non-commercially, and license their derivative works on different terms, provided the original work is properly cited and the use is non-commercial. See: http://creativecommons.org/licenses/by-nc/4.0/
Statistics from Altmetric.com
- Emergency department
- Health services research
- Mortality (standardized mortality ratios)
- Standards of care
Background
It has been widely observed that death rates among patients admitted to hospital in an emergency vary across days of the week, with higher mortality rates experienced by patients admitted at weekends compared with midweek days.1–7 There is no conclusive evidence on the causes of this phenomenon, termed ‘the weekend effect’, and it has prompted much debate.8–11
Concerns that the ‘weekend effect’ reflects inadequate quality of care on admission due to reduced staffing levels at weekends have prompted the National Health Service (NHS) in England to extend emergency hospital services at weekends in line with the government's commitment to providing uniform quality of care on each day of the week.12 ,13 Hospitals are required to implement new clinical standards for ‘7-day services’, which include providing emergency admissions with a thorough clinical assessment by a suitable consultant within 14 hours of arrival and timely 24-hour access to consultant-directed interventions.
However, recent evidence aligns with the hypothesis that higher mortality following weekend admission reflects differences in the volume and severity of patients admitted at weekend.14–16 Concerns about the adequacy of administrative data to account fully for fluctuations in the severity of patients admitted to hospital at different times of the week have been raised,16–20 suggesting that more accurate adjustment for severity of illness could explain the weekend effect.
The majority of studies identifying a weekend effect have relied on analyses of routinely collected inpatient administrative databases and have therefore adjusted for patient risk accounting for demographic characteristics, primary diagnosis and comorbidity measures based on reported International Classification of Diseases (ICD)-10 codes.17 While these risk-adjustment models exhibit high explanatory power in predicting mortality, they cannot account fully for severity of illness.17 ,18 ,21 Studies based on data from specialist clinical databases and audits for specific diseases or clinical departments have used richer risk-adjustment models that account for variations in severity of illness within a diagnostic and comorbidity group. These studies have found little or no significant difference in death rates by day of admission.16 ,19 However, these studies have focused on patients with specific conditions.
In this study, we use national administrative inpatient data merged with previously underused data on attendances at accident and emergency (A&E) departments. These contain information on whether the patient arrived by ambulance, an additional indicator of severity22 not available in the inpatient data. Despite ambulance services being available 24 hours each day of the week, the proportion of patients arriving by ambulance varies substantially across the week.22 We examine how the inclusion of information on arrival by ambulance in the risk-adjustment model affects the observed pattern of mortality across the week.
The attendance data also enable us to use information on the time of arrival at hospital in addition to the day of arrival. Studies have shown that patterns of outcomes differ throughout the whole week and between day and night-times, and that either being admitted overnight or receiving care overnight tends to be associated with worse outcomes.7 ,14 ,23 ,24 This suggests that the description of the weekly variation in care quality as a weekend effect is an oversimplification.14 ,25 If fluctuations in staffing levels are the cause of the weekend effect, we would expect to see the patterns of patient mortality align with the typical shift patterns worked by senior medical staff.
Methods
Data sources
We used patient-level data on all admissions to hospital and all attendances at A&E departments in England for the period 1 April 2013 to 28 March 2014 extracted from Hospital Episode Statistics.26 ,27
The inpatient records contain information on date of admission, gender, age, ethnic group, primary and secondary diagnoses, and whether the patient was admitted via A&E.28 We identified patients who had died in any hospital within 30 days of admission using the information on dates of death on discharge.28 The A&E records contain information on individual attendances at A&E departments, including the time of arrival and whether the patient arrived by ambulance.29
Linked admission and A&E attendance record identifiers were provided by the Health and Social Care Information Centre (HSCIC).30 Admission records and attendance records were linked using a matching algorithm based on an encrypted person identifier, dates of discharge from A&E departments and dates of admission to hospital and a set of criteria to prioritise conflicting information from the two data sources.30 In cases of multiple episodes within an admission spell, the first episode was used for linkage. In cases of multiple attendances at A&E on the same day, the last attendance was used. Socioeconomic deprivation, measured by the 2010 Index of Multiple Deprivation in the area of residence,31 was linked through patient Lower-level Super Output Area, provided in the data.28
We restricted the sample to emergency admissions via A&E at 140 non-specialist acute hospitals in England, for which mortality indicators are routinely reported. The case-mixes of these hospitals are more comparable to each other than those of specialist hospitals.32 We included patients admitted to hospital between 1 April 2013 and 28 February 2014 to allow a 30-day follow-up period for all patients over which to analyse mortality. We excluded all but the first admission in cases of multiple admissions in the last 30 days of life.
Of the 3 427 133 admission records, 64 912 (1.9%) were excluded due to lack of complete information on the risk-adjustment variables. There was no matching A&E record for 334 275 admissions (9.9% of the total of 3 362 221 admissions with complete information on the risk adjusters used in the analysis) (see online supplementary appendix figure A1). Patterns of mortality by day of the week were broadly similar in the included and excluded records (see online supplementary appendix table A2). We carried out the main analysis on 3 027 946 merged admission and A&E records with complete information on the risk adjusters.
supplementary appendix
Statistical analysis
We first constructed a standard risk-adjustment model estimating each patient's risk of mortality within 30 days using a logistic regression model that included the following variables taken from the inpatient records: the interaction between gender and age (in 5-year age bands), ethnicity, primary diagnosis (based on ICD-10 classification and defined according to Summary Hospital-level Mortality Indictor-grouped Clinical Classifications Software33 ,34), a set of 30 binary indicators for comorbidities recorded in the secondary diagnosis fields (measured using Elixhauser conditions20 ,35 ,36), source of admission (home or another hospital provider or institution), deprivation in the patient's area of residence (categorised in quintiles), admitting hospital and month of admission. We then categorised the predicted risk of mortality into five quintiles.
We examined how the predicted risk of mortality varied by time of arrival at A&E and by mode of arrival. To reflect senior doctors' working times,37 we classified time of arrival at A&E into 14 twelve-hour periods by dividing the week into seven daytime periods (07:00 to 18:59) and seven night periods (19:00 to 06:59 the following day). We classified attendance at A&E in three categories defined according to arrival mode: by ambulance, by ‘other’ modes (non-ambulance) and unknown (patients with missing information that could potentially be included in both categories).29 Ambulance arrivals include all forms of ambulance, but >98% are by emergency ambulance.22
We then used logistic regression models to analyse differences in the probability of death within 30 days of admission across the 14 twelve-hour time of arrival periods, with Wednesday daytime as the reference category (model 1). We used the same risk-adjustment variables as in the main analysis.
We examined whether mortality was associated with the mode of arrival at A&E and whether this factor influenced the size of the estimated differences in mortality by day of the week and time of the day in two ways: first, by modifying the standard risk-adjustment model with the addition of arrival mode (model 2), and second, by carrying out the analysis stratified by arrival mode (ambulance vs non-ambulance; models 3 and 4). We did not carry out stratified analysis for patients with unknown mode of arrival at A&E due to the small size of this group (11 846 records, 0.39% of the total).
SEs were clustered at the individual level to account for repeated admissions of each individual patient. We used the C-statistic to discriminate across models. Analyses were undertaken using Stata V.14, using a significance level of 5% throughout.
Results
Association between crude risk of mortality and day and time of attendance
Of all 3 027 946 patients admitted to hospital following attendance at A&E, the majority (1 907 920, 63.0%) attended A&E during daytime, while the remaining 1 120 026 (37.0%) attended at night (table 1, column 1).
Association of day and time of attendance with risk-adjusted mortality within 30 days of admission
The crude mortality rates are higher for patients attending A&E during the day compared with at night (table 1, column 3); 3.66% of patients attending on Wednesday daytime die within 30 days compared with 3.48% of patients attending on Wednesday night-time. The crude mortality rates are highest for those attending on Sunday daytime (4.12%) and Saturday (4.00%) daytime, and lowest for those attending on Friday night (3.28%) and Saturday night (3.32%).
The higher crude mortality rates during daytime reflect the higher proportions of patients in the highest risk quintile (as measured using the standard risk-adjustment model) among those arriving during daytime compared with those arriving at night (figure 1). Over the whole week, 20.9% of daytime arrivals were in the highest risk quintile compared with 18.5% for night arrivals. Daytime arrivals on Sundays contained the highest proportion of patients in the highest risk quintile (21.59%), followed by daytime arrivals on Saturdays (21.38%) and Fridays (20.89%). The proportions of patients in the highest risk quintile among those arriving at night were similar across the days of the week, with the highest proportions on Mondays (18.97%) and Wednesdays (18.9%) and the lowest proportion on Saturdays (17.62%).

Percentage of admissions by quintile of mortality risk and day and time of attendance. Source data available in online supplementary appendix table A8.
Association between risk of mortality and mode of arrival
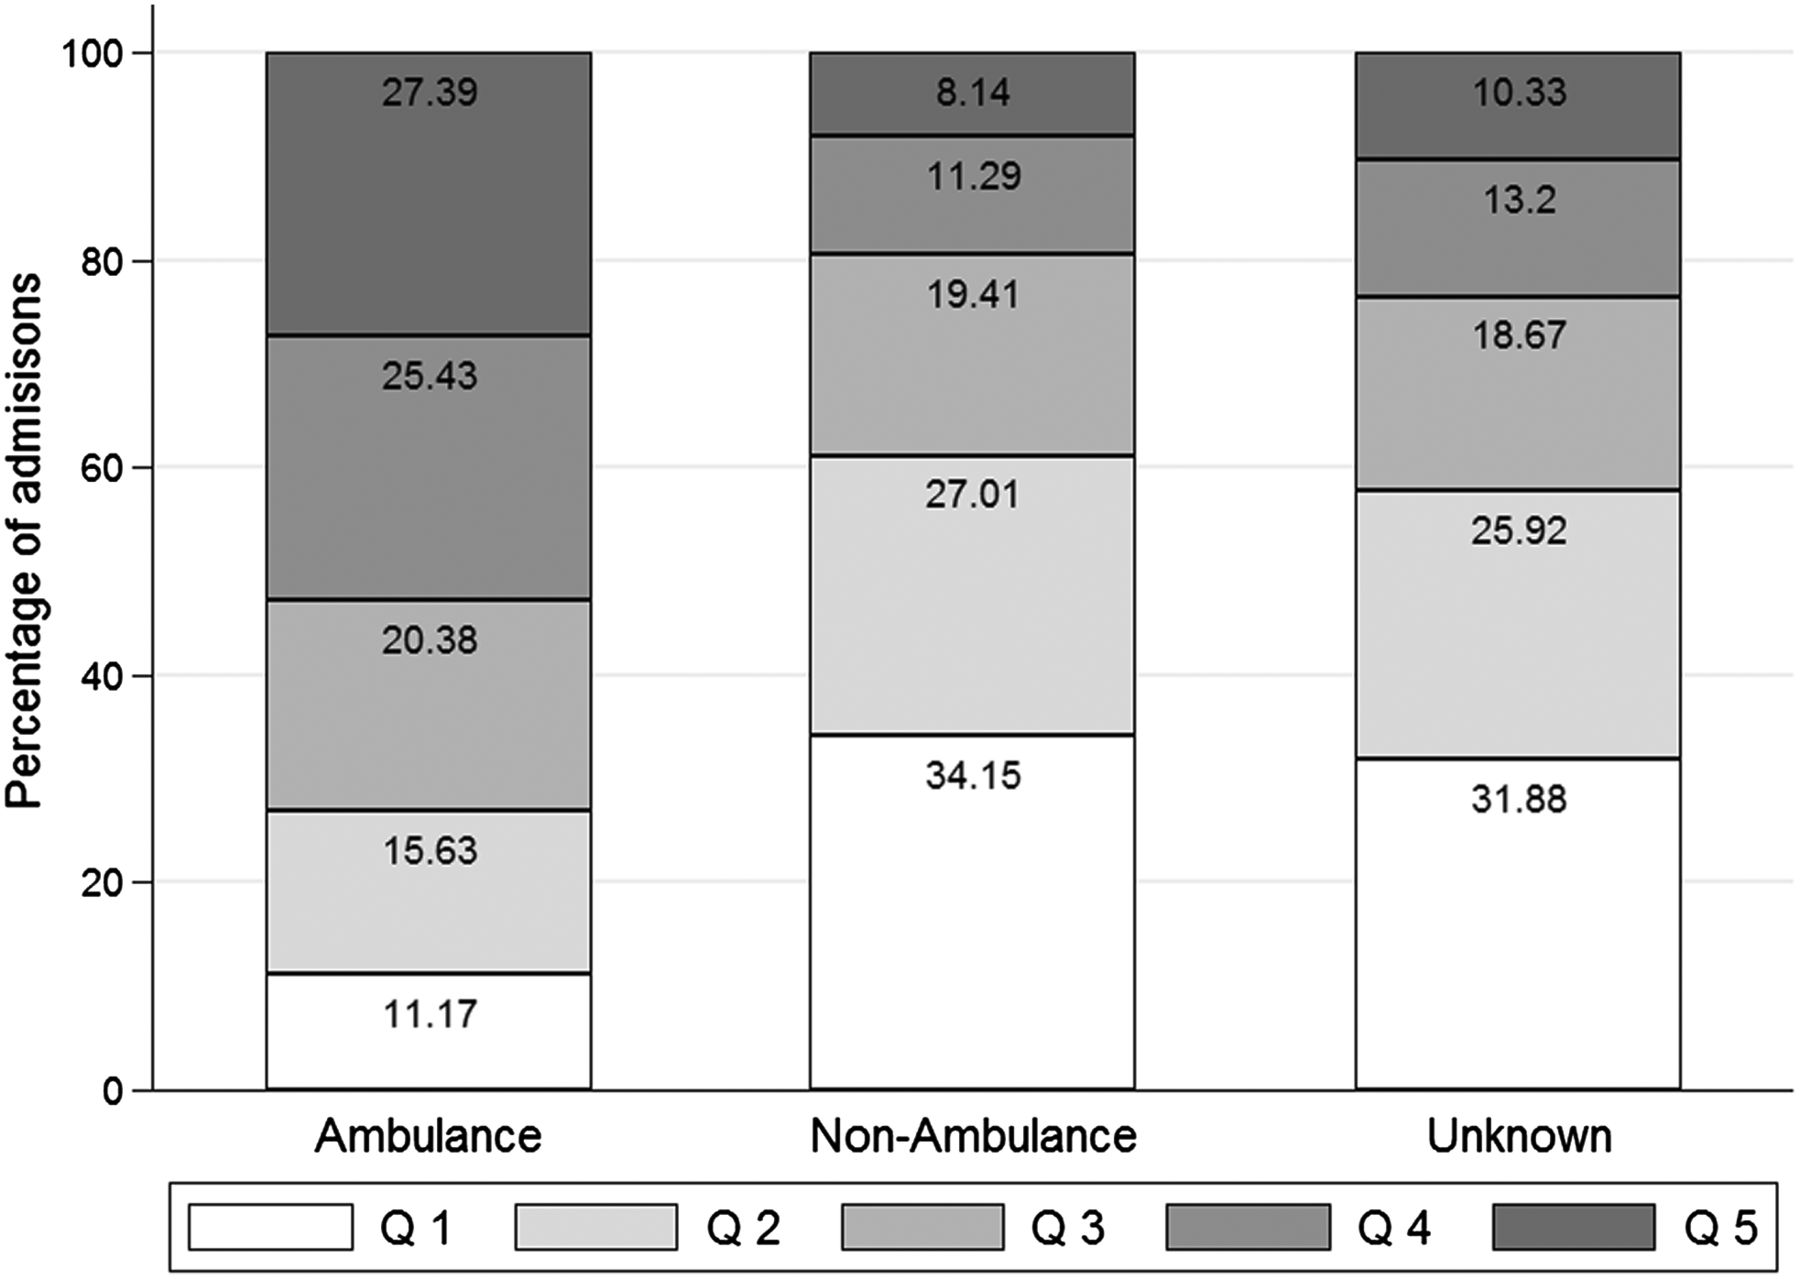
The majority (1 863 246, 61.5%) of patients admitted to hospital after attendance at A&E were brought into hospital by ambulance (table 1, column 1). Patients admitted after being brought into A&E by ambulance were at a higher risk of death compared with those arriving by other modes (crude mortality rates 5.46% vs 0.78%, table 1, column 3). 27.4% of patients admitted to hospital following arrival at A&E by ambulance were in the highest risk quintile and 52.8% were in the two highest risk quintiles (figure 2). Only 8.1% of patients who were admitted after arriving at A&E by other means were in the highest risk quintile, while the majority were in the lowest risk quintile (31.9%) and over half of them (61.2%) were in the two lowest risk quintiles.

Percentage of admissions by quintile of mortality risk and mode of arrival. Source data available in online supplementary appendix table A9.
Association between day and time of attendance and mode of arrival
The proportion of admitted patients brought into A&E by ambulance was higher at night (average 67.6%) compared with daytime (average 57.1%), with the highest proportions on Saturday night (69.0%) and Friday night (68.1%) and the lowest proportion on Monday night (66.5%) (figure 3). For daytimes, the proportion of admitted patients brought in by ambulance was substantially higher on Saturdays (61.1%) and Sundays (60.1%) compared with other days of the week (57.0% on average).
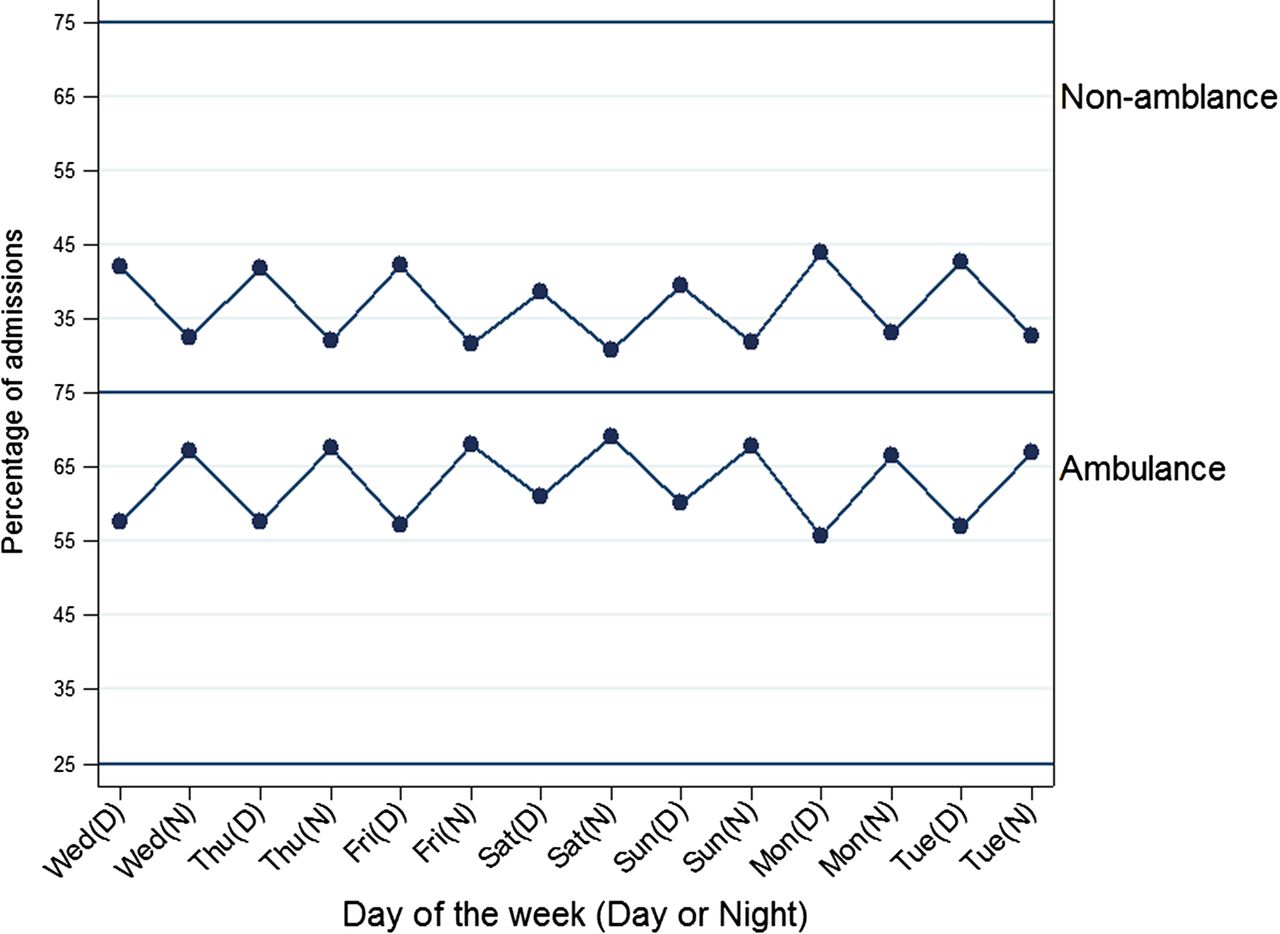
Percentage of admissions by mode of arrival and day and time of attendance. Source data available in online supplementary appendix table A10.
Association between risk-adjusted mortality and day and time of attendance
Using standard risk adjusters (excluding arrival mode; model 1: table 1, column 4), mortality rates were significantly higher, compared with Wednesday daytime, for patients arriving at A&E during the week at night, on Wednesday (0.16 percentage points; OR 1.055, CI 1.016 to 1.096) and Thursday (0.15 percentage points; OR 1.052, CI 1.031 to 1.092). Risk-adjusted mortality rates increased through the weekend from Saturday daytime (0.16 percentage points; OR 1.058, CI 1.025 to 1.092) to Sunday night (0.26 percentage points; OR 1.096, CI 1.055 to 1.137).
Risk-adjusted mortality was substantially lower for patients arriving by non-ambulance modes (−2.4 percentage points; OR 0.339, CI 0.330 to 0.348) and unknown modes (−2.0 percentage points; OR 0.456, CI 0.380 to 0.548), compared with patients arriving by ambulance (model 2: table 1, column 6). After controlling for arrival mode, Sunday daytime was the only time period associated with a higher mortality risk (0.17 percentage points; OR 1.061, CI 1.028 to 1.095) compared with Wednesday daytime.
The patterns of mortality among patients arriving by ambulance (model 3: table 1, column 8) were similar to those for all patients after adjusting for arrival mode. Mortality was only significantly higher for patients arriving on Sunday daytime, both among patients arriving by ambulance (0.23 percentage points; OR 1.055, CI 1.020 to 1.090) and among patients arriving by non-ambulance modes (0.11 percentage points; OR 1.186, CI 1.070 to 1.314, model 4: table 1, column 10).
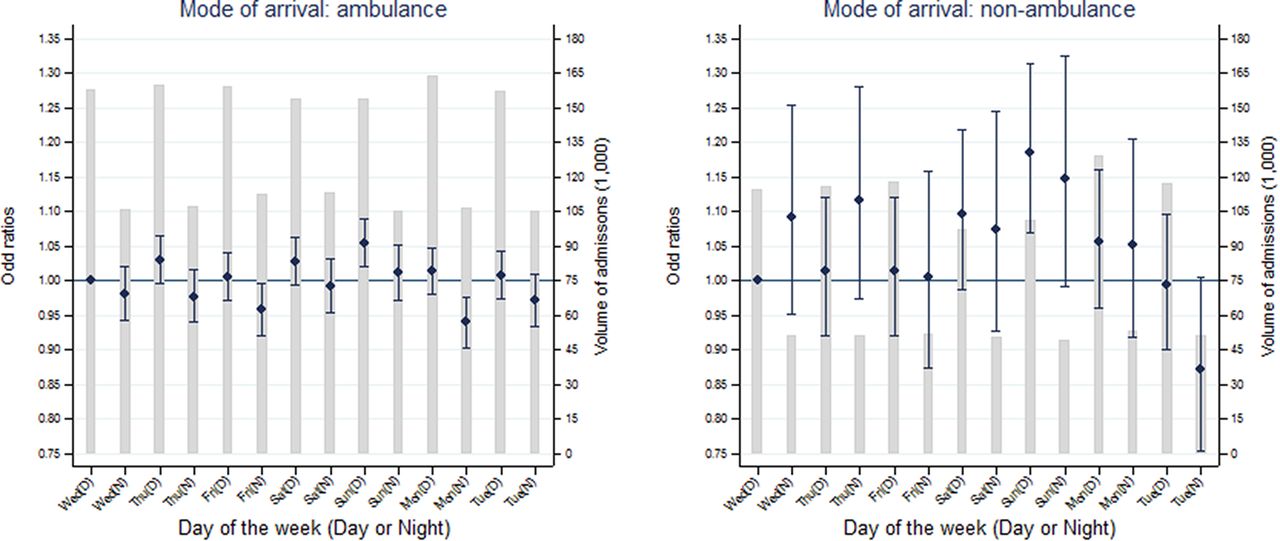
Figure 4 shows how the estimated effects of time and day of arrival at A&E on mortality change after including mode of arrival in the risk-adjustment models. The trend towards increased risk of mortality for night-time admission is reversed, with lower mortality for patients arriving overnight from Monday to Saturday. Figure 5 shows that the same pattern is observed among patients arriving by ambulance. There is more variation in mortality among patients arriving by non-ambulance modes but only Sunday daytime differs significantly from Wednesday daytime.

Risk-adjusted mortality within 30 days of admission by day and time of attendance by mode of arrival at accident and emergency.
Discussion
Principal findings
We analysed the association between risk-adjusted mortality and day and time of arrival for patients admitted to hospital after attendance at A&E. When controlling only for the risk adjusters available in inpatient administrative records as in previous studies,1–7 mortality was found to be significantly higher for patients admitted to hospital throughout the weekend and on Wednesday and Thursday nights. Patients arriving at A&E by ambulance had a higher risk of mortality and higher proportions of patients admitted overnight and at weekends arrived by ambulance.
Accounting for mode of arrival substantially altered the observed pattern of mortality throughout the week. Only patients admitted via A&E on Sunday daytime had an increased risk of mortality compared with patients admitted on Wednesday daytime, and patients admitted on Monday and Friday nights had significantly lower risk. None of the night-time periods were associated with higher risk of mortality.
Strengths and weaknesses
We made innovative use of information on mode of arrival to account for severity of illness in patients admitted to hospital in an emergency. We investigated the hypothesis that the differences in mortality throughout the week observed in previous studies using national administrative records are explained by previously unmeasured differences in severity of illness.17 ,18 ,21
This study focuses only on patients admitted in an emergency after attending A&E, who represent 80% of all emergency admissions and 89% of weekend emergency admissions.15 However, since this group experiences a different profile of mortality rates than patients admitted directly to hospital,15 we cannot test whether our results generalise to all inpatient admissions.
A&E records are known to be less complete and accurate than inpatient records.38 We relied mainly on the better quality data extracted from inpatient records and only used information on arrival time and mode of arrival from the A&E record. No specific concerns about these variables have been raised by the HSCIC in their audits of the quality of A&E records. Although any variation in accuracy of recording by time and day could bias our results, we examined the patterns of mortality by day of the week for complete versus incomplete A&E records and found them to be broadly similar, suggesting that the incompleteness of records is unlikely to have biased our analysis (see online supplementary appendix table A2).
We were restricted by data availability to deaths that occur in hospital and could not examine out-of-hospital deaths. However, >80% of all deaths within 30 days of an emergency admission occur in hospital and the proportion is higher at weekends, leading to a small bias towards finding a weekend effect.15
We used the time of attendance at A&E rather than the time of admission to hospital as our index time. We argue that the time of attendance is more appropriate since this is the point at which hospitals become responsible for patient care. Nonetheless, for comparability with previous studies, we repeated our analysis using the time of departure from A&E to approximate the time of admission to hospital. The basic patterns of mortality across the week were unaffected (see online supplementary appendix table A4).
We used a classification of daytime versus night-time that was consistent with senior doctors' working hours.23 We checked that our results were robust to using an alternative definition of daytime and night-time (08:00 to 19:59 and 20:00 to 07:59 the following day), as has been used in a previous study.24 The changes to the point estimates of the ORs for our main analysis (full risk adjustment including mode of admission) were small and the OR for Sunday daytime remained the largest (see online supplementary appendix table A5).
Comparison with previous studies
Previous studies using national administrative data have consistently found mortality to be elevated for patients admitted to hospital at the weekend compared with their counterparts admitted during the week.1–7 However, these studies suffer from two major limitations. First, they have been constrained by the absence of information on patients' time of arrival at hospital and have been forced to classify the weekend crudely by dates as 00:00 Saturday to 23:59 Sunday.1–4 ,6 Second, these studies have been limited in how they could adjust for severity of illness.
To allow comparison of our results with previous studies using only inpatient data,1–4 ,6 ,15 we carried out the same analysis to test how the addition of arrival mode would change the association between mortality and day of admission to hospital or admission at weekend. Day of admission was defined as 00:00 to 23:59 based on information in inpatient records. The results obtained using standard risk adjusters were similar to previous studies15 and inclusion of arrival mode reduced the elevation of mortality at weekends (from OR 1.046, CI 1.031 to 1.061, to OR 1.024, CI 1.008 to 1.039) (see online supplementary appendix tables A6 and A7).
Including arrival mode in the risk-adjustment model accounted for most of the differences in mortality between different days and different times, leaving Sunday daytime as the only period associated with a higher risk of death. These findings were replicated when we stratified the analysis by mode of arrival. Our results are in line with previous studies that have used clinical audit data and concluded that the elevation of mortality at weekends disappears once indicators of severity are controlled for.14 ,16 In contrast to these studies, however, we analysed a large national data set and considered all clinical causes of admissions. Nonetheless, arrival by ambulance is an imperfect proxy for severity of illness. It is likely that there are further unmeasured aspects of severity related to the risk of mortality that differ between patients admitted at different times of the week.
Implications and future research
Current extensions of emergency hospital services at weekends in the NHS in England are only likely to be successful in addressing the weekend effect if it is caused by reduced availability of hospital services on the day of admission. By accounting for patient arrival at hospital by ambulance, we have shown that much of the weekend effect identified in previous studies is likely to be explained by variations in severity of illness. With the exception of Sunday daytime, elevated mortality among admissions at weekends reflects a higher proportion of patients arriving by ambulance.
Most of the debate on 7-day services has focused on weekend care. Our results suggest that a more granular approach to time classification is needed to fully capture the variations in the flow of patients and the services offered across times of the day in addition to days of the week.
In addition to the patient's mode of arrival at hospital, other information on the services that patients have accessed prior to their arrival at hospital should be included in future studies to further understand mortality risk. Such proxies will, however, always be inferior to direct measurement of illness severity, which is required in order for clinicians and policymakers to make valid comparisons of outcomes over time and across providers. Our results therefore add to the increasing body of evidence highlighting the limitations of the risk adjusters available in inpatient records when standardised mortality rates are interpreted as an indicator of hospital quality.39
When assessing quality of care, there are many important aspects beyond mortality; the vast majority of patients admitted to hospital do not die. The time taken to receive necessary scans and procedures has been shown to vary throughout the week in condition-specific studies using clinical audit data.14 ,40 ,41 Temporal variations in quality indicators beyond mortality warrant further investigation.
Acknowledgments
The paper benefited substantially from the valuable comments and suggestions received from the editors and from two anonymous reviewers. Linked A&E and inpatient records were provided by the Health and Social Care Information Centre (now NHS Digital). In particular, Ariane Alamdari from the Data Access Request Service provided access to the electronic files and support in using them.
References
Footnotes
Twitter Follow Rachel Meacock at @RachelMeacock, Søren Rud Kristensen at @soerenrk, Matt Sutton at @MattXSutton, Tim Doran at @narodmit
Contributors LA and MS designed the paper. LA, SRK and MS extracted the data and LA performed the analysis. LA and MS wrote the manuscript. RM, SRK and TD edited the manuscript. LA is the guarantor of this article.
Funding This research was funded by the National Institute for Health Research Health Services and Delivery Research (NIHR HS&DR) programme (project number 12/128/48).
Disclaimer The views and opinions expressed are those of the authors and do not necessarily reflect those of the HS&DR programme, NIHR, NHS or the Department of Health.
Competing interests None declared.
Provenance and peer review Not commissioned; externally peer reviewed.