Article Text

Abstract
Objectives To assess the effect of the Maternal Newborn Dashboard on six key clinical performance indicators in the province of Ontario, Canada.
Design Interrupted time series using population-based data from the provincial birth registry covering a 3-year period before implementation of the Dashboard and 2.5 years after implementation (November 2009 through March 2015).
Setting All hospitals in the province of Ontario providing maternal-newborn care (n=94).
Intervention A hospital-based online audit and feedback programme.
Main outcome measures Rates of the six performance indicators included in the Dashboard.
Results 2.5 years after implementation, the audit and feedback programme was associated with statistically significant absolute decreases in the rates of episiotomy (decrease of 1.5 per 100 women, 95% CI 0.64 to 2.39), induction for postdates in women who were less than 41 weeks at delivery (decrease of 11.7 per 100 women, 95% CI 7.4 to 16.0), repeat caesarean delivery in low-risk women performed before 39 weeks (decrease of 10.4 per 100 women, 95% CI 9.3 to 11.5) and an absolute increase in the rate of appropriately timed group B streptococcus screening (increase of 2.8 per 100, 95% CI 2.2 to 3.5). The audit and feedback programme did not significantly affect the rates of unsatisfactory newborn screening blood samples or formula supplementation at discharge. No statistically significant effects were observed for the two internal control outcomes or the four external control indicators—in fact, two external control indicators (episiotomy and postdates induction) worsened relative to before implementation.
Conclusion An electronic audit and feedback programme implemented in maternal-newborn hospitals was associated with clinically relevant practice improvements at the provincial level in the majority of targeted indicators.
- audit and feedback
- health services research
- implementation science
- obstetrics and gynecology
This is an Open Access article distributed in accordance with the Creative Commons Attribution Non Commercial (CC BY-NC 4.0) license, which permits others to distribute, remix, adapt, build upon this work non-commercially, and license their derivative works on different terms, provided the original work is properly cited and the use is non-commercial. See: http://creativecommons.org/licenses/by-nc/4.0/
Statistics from Altmetric.com
Introduction
Pregnancy, labour, birth and the postpartum period are times when less than optimal care can have far-reaching consequences, potentially influencing the long-term health of women and infants.1 Across Canada, there is wide variability in clinical practice and outcomes in maternal-newborn care settings, which suggests there are opportunities for improvement.2 3 One approach that has been widely used to promote evidence-based care in clinical settings is audit and feedback,4 in which clinical performance is assessed over time and feedback is provided to users about their practice.5 6 These interventions are effective in a wide range of clinical settings4 7 and are among the most commonly used knowledge translation interventions.6 However, it is unclear why performance improves in some settings and not in others, what is needed to improve effectiveness, and what attributes of an audit and feedback system have the greatest effect.4 Moreover, to date, audit and feedback interventions have been infrequently used in obstetrical settings.4
In January 2012, a new data collection platform for a provincial birth registry (Better Outcomes Registry & Network (BORN)) was launched in all Ontario hospitals providing maternal-newborn care, with the aim of improving care and outcomes for mothers and newborns. This technological platform was designed to facilitate the collection and management of data in the registry database. In addition, an electronic online audit and feedback tool (the Maternal Newborn Dashboard, hereafter referred to as the Dashboard) was built into this new system to address quality of care issues.3
The Dashboard was launched provincially in November 2012 and targeted six clinical performance issues, which were selected and refined during a rigorous development process.3 8 These performance indicators were chosen in part because of their clinical importance to patient outcomes, so that improvements in these indicators could lead to important health gains in the population.8 The Dashboard provided users with near real-time hospital-specific feedback, including peer comparison data, a visual display of practice gaps and benchmarks to provide direction for practice change.3 The objective of our study was to evaluate the effect of implementation of the Dashboard on the rates of six clinical performance indicators in maternal-newborn care across Ontario hospitals.
Methods
Study design, study population and data sources
A protocol detailing our study methods has been previously published.3 Briefly, we used an interrupted time series (ITS) approach, a robust, quasi-experimental study design to evaluate the effects of interventions when random allocation is not possible.9 In an ITS study, the outcome of interest is observed at multiple time points (eg, on a monthly or quarterly basis) and trends are estimated both before and after the intervention.10 The preintervention trend is then compared with the postintervention trend to determine the effect of the intervention over and above the underlying secular trend.9 10 Our study population included all hospital deliveries taking place in Ontario, resulting in live births ≥500 g or ≥20 weeks of gestation between 1 November 2009 and 31 March 2015 (see online supplementary appendix figure A1). We followed the quality criteria proposed by Ramsay et al 11 for the conduct and reporting of ITS studies to ensure that our study was properly executed and reported.
Supplementary file 1
The data for our study originated from BORN Ontario birth registry data sets (https://www.bornontario.ca/en/data/). In January 2012, a new provincial birth registry was launched to capture information on 100% of births in the province, and replaced an existing provincial perinatal database (henceforth known as the historical data set) which contained data on 96% of the births in Ontario dating back to 1997.12 Data quality assessments in both data sets indicate that the data are of good quality overall, and data quality is comparable between the two data sets.12 13 We used the historical data set as the source for calculating provincial rates on the clinical performance indicators of interest from 1 November 2009 through 31 March 2012, and used the new birth registry data sets as the source for clinical performance indicator rates from 1 April 2012 until 31 March 2015. The Dashboard audit and feedback intervention launched in November of 2012, and we incorporated a 5-month implementation phase (November 2012 through March 2013) to allow for increased awareness and uptake of the Dashboard. Thus, our analysis covered 36 months before, 5 months during and 24 months after implementation of the Dashboard.
The data elements in the province’s birth registry and the historical data set were very similar, but not identical, owing to expanded depth of clinical data collection in the newer system. In both systems, available data elements include maternal demographics and health behaviours, pre-existing medical conditions, obstetrical complications, intrapartum interventions, and birth and newborn outcomes. Moreover, the process of data entry into each system (either manually by clinical staff or through direct upload from electronic medical records) did not change in most hospitals when the historical database was retired and the new birth registry commenced. To ensure that any changes in data coding between the two systems would not influence our analyses, the data elements used to define the performance indicators in each data set were carefully selected and normalised. We used time series plots for each clinical performance indicator and internal control outcome to assess accuracy of mapping between the two data sources. Furthermore, we were able to take advantage of a 3-month time period in which data were captured by both systems (January through March 2012) to further validate indicator definitions, and compare the rates to ensure they were equivalent in the two systems. This time period, which was not used in our analyses, was a ramp-up phase for the new provincial registry, during which data capture was not complete in all hospitals.
Outcomes
The six clinical performance indicators of interest in this study are listed below. A decrease in rate would indicate improvement for all indicators except number 5 (group B streptococcus (GBS) screening), where an increase indicates improvement. Additional information on the indicators is presented in online supplementary appendix table A2.
Rate of newborn screening samples that were unsatisfactory for testing.14
Rate of episiotomy in women with a spontaneous vaginal birth.
Rate of formula supplementation in term infants whose mothers intended to breast feed.
Rate of repeat caesarean delivery performed prior to 39 weeks’ gestation in low-risk women at term, who were not in labour and had no medical or obstetrical complications.
Rate of GBS screening at 35–37 weeks’ gestation among women who delivered at term.
Rate of induction among women with an indication of postdates, but were less than 41 weeks’ gestation at delivery.
Our analysis was restricted to records with complete information on the data elements required to define the clinical performance indicators of interest. Each indicator was aggregated across all hospitals in the province and expressed as a monthly rate per 100 women. Denominator definitions were tailored to the relevant clinical group for each indicator; therefore, the analytical denominators varied by performance indicator (see online supplementary appendix tables A2 and A3). Our a priori hypotheses were that introduction of the Dashboard would reduce the rates of unsatisfactory newborn screening samples, episiotomy, formula supplementation, term repeat caesarean delivery occurring prior to 39 weeks and inductions for postdates occurring prior to 41 weeks, and would increase the rate of GBS screening.
Sample size
Our analysis included all 94 hospitals in the province of Ontario and no formal power calculation was carried out. Robust statistical analyses of ITS data require between 40 and 50 time points; moreover, to avoid overfitting of segmented regression models, at least 10 observations are required for each parameter.15 Since our model included four parameters, a minimum of 40 time points is adequate, and therefore the use of monthly time intervals is preferred.16 Furthermore, to avoid instability in the monthly proportions, it is desirable to have denominators consisting of at least 100 births at each time point, and using a smaller time interval would have resulted in insufficient numbers. After censoring the implementation period, our ITS analysis included a total of 60 time points (36 pre and 24 post), and pooling across all hospitals, the smallest monthly denominator was 362 (indicator 4—elective repeat caesarean delivery prior to 39 weeks). Our sample sizes were therefore considered adequate to conduct the planned analyses.
Statistical analysis
Our statistical analysis plan was described in detail in our published study protocol.3 Briefly, we pooled across all hospitals and analysed the aggregated monthly rates, expressed as a percentage, for each clinical performance indicator, using a simple linear segmented regression model. Due to small numerators, there was high variability in monthly rates of newborn screening samples that were unsatisfactory for testing; therefore, we analysed this indicator using quarterly time intervals. The model included fixed terms for time, intervention and time postintervention. The 5-month implementation period was censored from analysis by coding the intervention variable as missing during these months. The model was estimated using maximum likelihood estimation. Statistical significance was obtained as the estimated beta coefficients divided by their SEs, with SEs accounting for the autoregressive parameters. As the analysis was conducted at the aggregate level, no covariates were adjusted for in this analysis. We assessed serial autocorrelation, non-stationarity and seasonality using the Durbin-Watson statistic, Dickey-Fuller unit root test and visual inspection of residual plots against time.17 Where required, autocorrelation parameters up to lag 12 were included and reduced using backward elimination in order to fit the most parsimonious model. The fit of the final model was assessed by inspecting residuals around the predicted regression lines.
We elected to carry out an aggregate segmented regression as our primary analysis, rather than a random-effects regression accounting for between-hospital variation for several reasons. First, our preferred metric for expressing the effect of the intervention was the absolute difference scale rather than the OR scale as absolute differences are usually more meaningful to decision-makers. Second, the inclusion of small hospitals with very low numbers of births in each time interval may have led to instability in the random-effects model; instead, we were able to fit a simple but robust model incorporating data from all hospitals. Third, our planned secondary analysis will examine between-hospital variation in the effect of the Dashboard and identify factors associated with such variation.3
We expressed the effect of the Dashboard on each indicator as intercept and slope changes, where the former can be interpreted as the immediate effect of Dashboard implementation and the latter as the gradual effect of the Dashboard on the rate of the performance indicator over time. We also evaluated the difference, at 30 months postimplementation, between the fitted postimplementation rates and the projected rates estimated using only the preintervention data. This represents the counterfactual effect, that is, the difference between the observed rate and the rate that would have been observed had the Dashboard not been implemented. We expressed these differences on both the absolute and relative scales, with 95% CIs calculated using the method of Zhang et al.18–20 All analyses were conducted using SAS V.9.4.
Control analyses
The main threat to validity in an ITS analysis relates to time-varying confounding, such as simultaneously occurring interventions, changes in the composition of the population and changes in data coding. We used two approaches to evaluate the risk of competing explanations for any observed effects of the Dashboard. First, we used the same study population and time period to assess two internal control outcomes, which were not targeted and should not have been affected by implementation of the Dashboard but are subject to the same threats to internal validity as the outcomes of interest. The control outcomes, chosen a priori, were caesarean delivery rate in induced nulliparous women and use of electronic fetal monitoring during labour in women with low-risk term deliveries. Due to differences in the data elements for electronic fetal monitoring between the historical and newer registry data sets, the definition of this validation outcome was modified slightly from the prespecified protocol, to use of intermittent auscultation in low-risk term deliveries. Second, we used an external comparison group over the same time period from another Canadian province, not exposed to the intervention (British Columbia). Data from this province were available for four of the six clinical performance indicators used in our study. In both sets of validation analyses, we hypothesised that a finding of no effect of the Dashboard implementation would strengthen any inference made about the effect of the Dashboard on our indicators of interest.
Sensitivity analyses
To verify the robustness of our statistical models, we carried out a number of sensitivity analyses, where we reran the models after revising the data set or indicator definitions and compared the results with those obtained in the primary analyses. Sensitivity analyses included the removal of all data from one site where data entry was delayed, and revisions to indicator coding to confirm that the results were not influenced by data quality or modifications that were made to the coding of the indicators during the study period.
Results
Between November 2009 and March 2015, there were 728 109 live birth deliveries (an average of 132 383 live birth deliveries annually). The analytical denominators varied by performance indicator due to the different inclusion and exclusion criteria (online supplementary appendix table A3). The smallest analytical denominators were for performance indicator 4—repeat caesarean delivery in low-risk women prior to 39 weeks (586 monthly deliveries on average), and the largest denominators were for performance indicator 1—unsatisfactory newborn screening samples (32 182 quarterly deliveries on average).
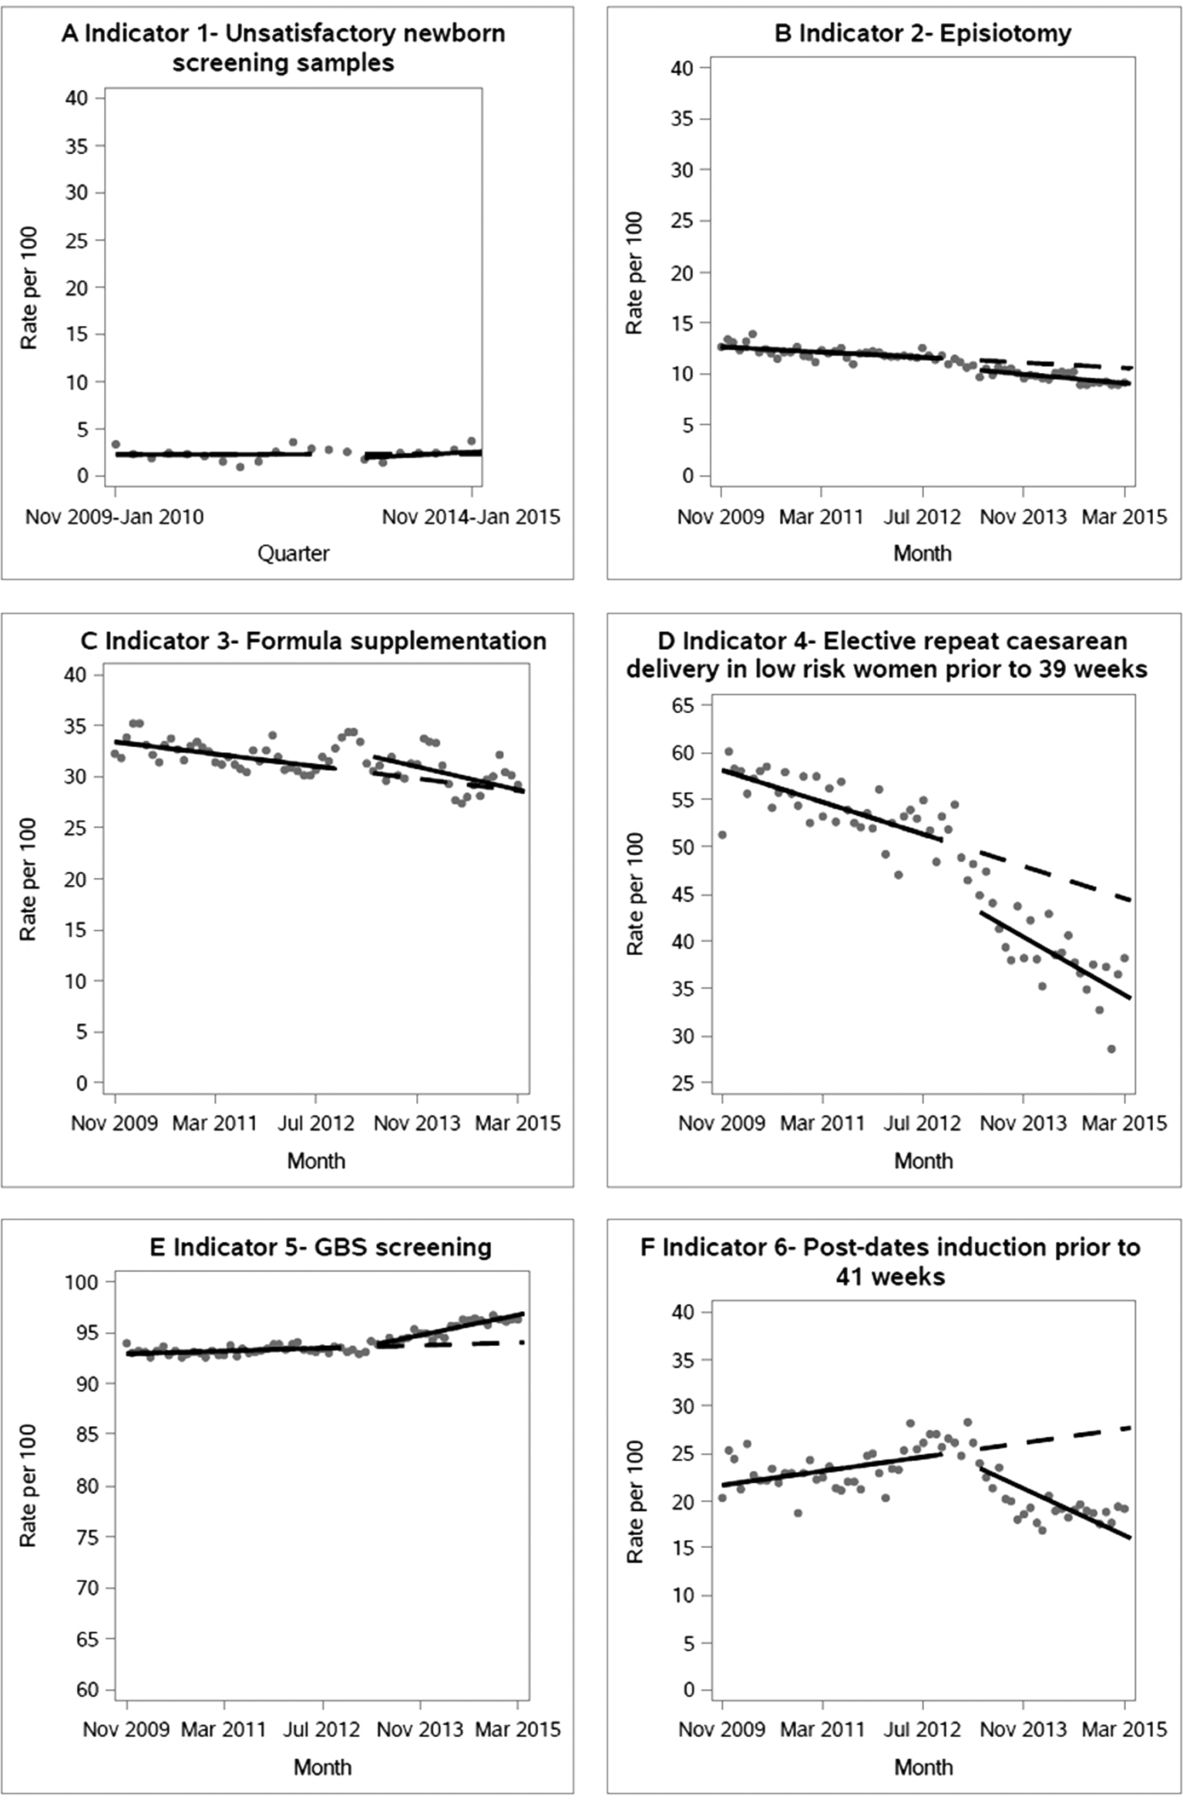
Figure 1 presents the observed time series for each performance indicator, with the fitted preintervention and postintervention trends, as well as the extrapolated preintervention trends that were used to calculate the counterfactual differences. Final model fit was found to be adequate. The estimated coefficients from the segmented regression analyses are presented in table 1. Overall, statistically significant improvements due to the Dashboard (either level and/or slope changes) were observed for most indicators, the exception being the rate of unsatisfactory newborn screening samples, where no significant changes were observed. The provincial rate of formula supplementation increased significantly after implementation of the intervention (ie, increase in level), followed by a significant decrease in the slope. The interpretation of the regression estimates for episiotomy, for example, would be as follows: the provincial rate of episiotomy at the start of the study was 13 per 100 women having a spontaneous vaginal delivery, with a statistically significant decrease of 0.03 women per 100 per month (P<0.001), and the implementation of the Dashboard was associated with an immediate decrease of 0.85 women per 100 (P=0.01), and an additional non-significant monthly decrease over and above the preintervention slope of 0.02 women per 100 per month (P=0.20).
Results from segmented regression analysis for six clinical performance indicators and two internal validation outcomes from Ontario birth registry data sets, and four clinical performance indicators from an external data set (British Columbia), 2009–2015

Primary analyses evaluating the effect of the implementation of the Maternal Newborn Dashboard on provincial rates of six clinical performance indicators, from November 2009 to March 2015, in Ontario, Canada. For each plot, the grey circles are the raw data per hundred births, the solid line is the fitted linear regression line, and the dashed line is the projected trend assuming there was no intervention (counterfactual). GBS, group B streptococcus.
The combined intercept and slope changes associated with the Dashboard, expressed as counterfactual differences at 30 months postimplementation, are presented in table 2. There were statistically significant improvements associated with the Dashboard for four of the six indicators. The largest improvement was in the rate of induction for postdates in women who delivered before 41 weeks (absolute reduction of 11.7 per 100, 95% CI 7.4 to 16.0). The reduction in rates of repeat caesarean delivery in low-risk women before 39 weeks was 10.4 per 100 (95% CI 9.3 to 11.5), and the reduction in episiotomy was 1.5 per 100 (95% CI 0.6 to 2.4). The increase in the rate of appropriately timed GBS screening was 2.8 per 100 (95% CI 2.2 to 3.5). Implementation of the Dashboard did not significantly affect the rate of unsatisfactory newborn screening samples received, nor was the rate of formula supplementation in women who intended to exclusively breast feed affected. Our results were robust to numerous sensitivity analyses (see online supplementary appendix).
Effect of Dashboard on performance and validation indicators: absolute and relative intervention effects with 95% CI at 30 months following introduction of intervention, and corresponding time period for external control indicators, 2009–2015
We verified the performance indicator rates for the 3-month period of overlap between the two data sets (January to March 2012). Rates were available for four of the performance indicators used in our current study, and we found those rates to be comparable, with the largest disparity being an absolute difference of 2.6% for formula supplementation at discharge (31.2% in historical data set, 28.6% in newer registry data set). We do not believe that the disparity for this indicator would be sufficient to change our conclusions regarding the lack of association between Dashboard implementation and rates of formula supplementation at discharge. For the other three indicators, the absolute differences were below 1%. The proportion of records excluded due to missing data on key elements was less than 10% for all indicators.
Internal and external controls
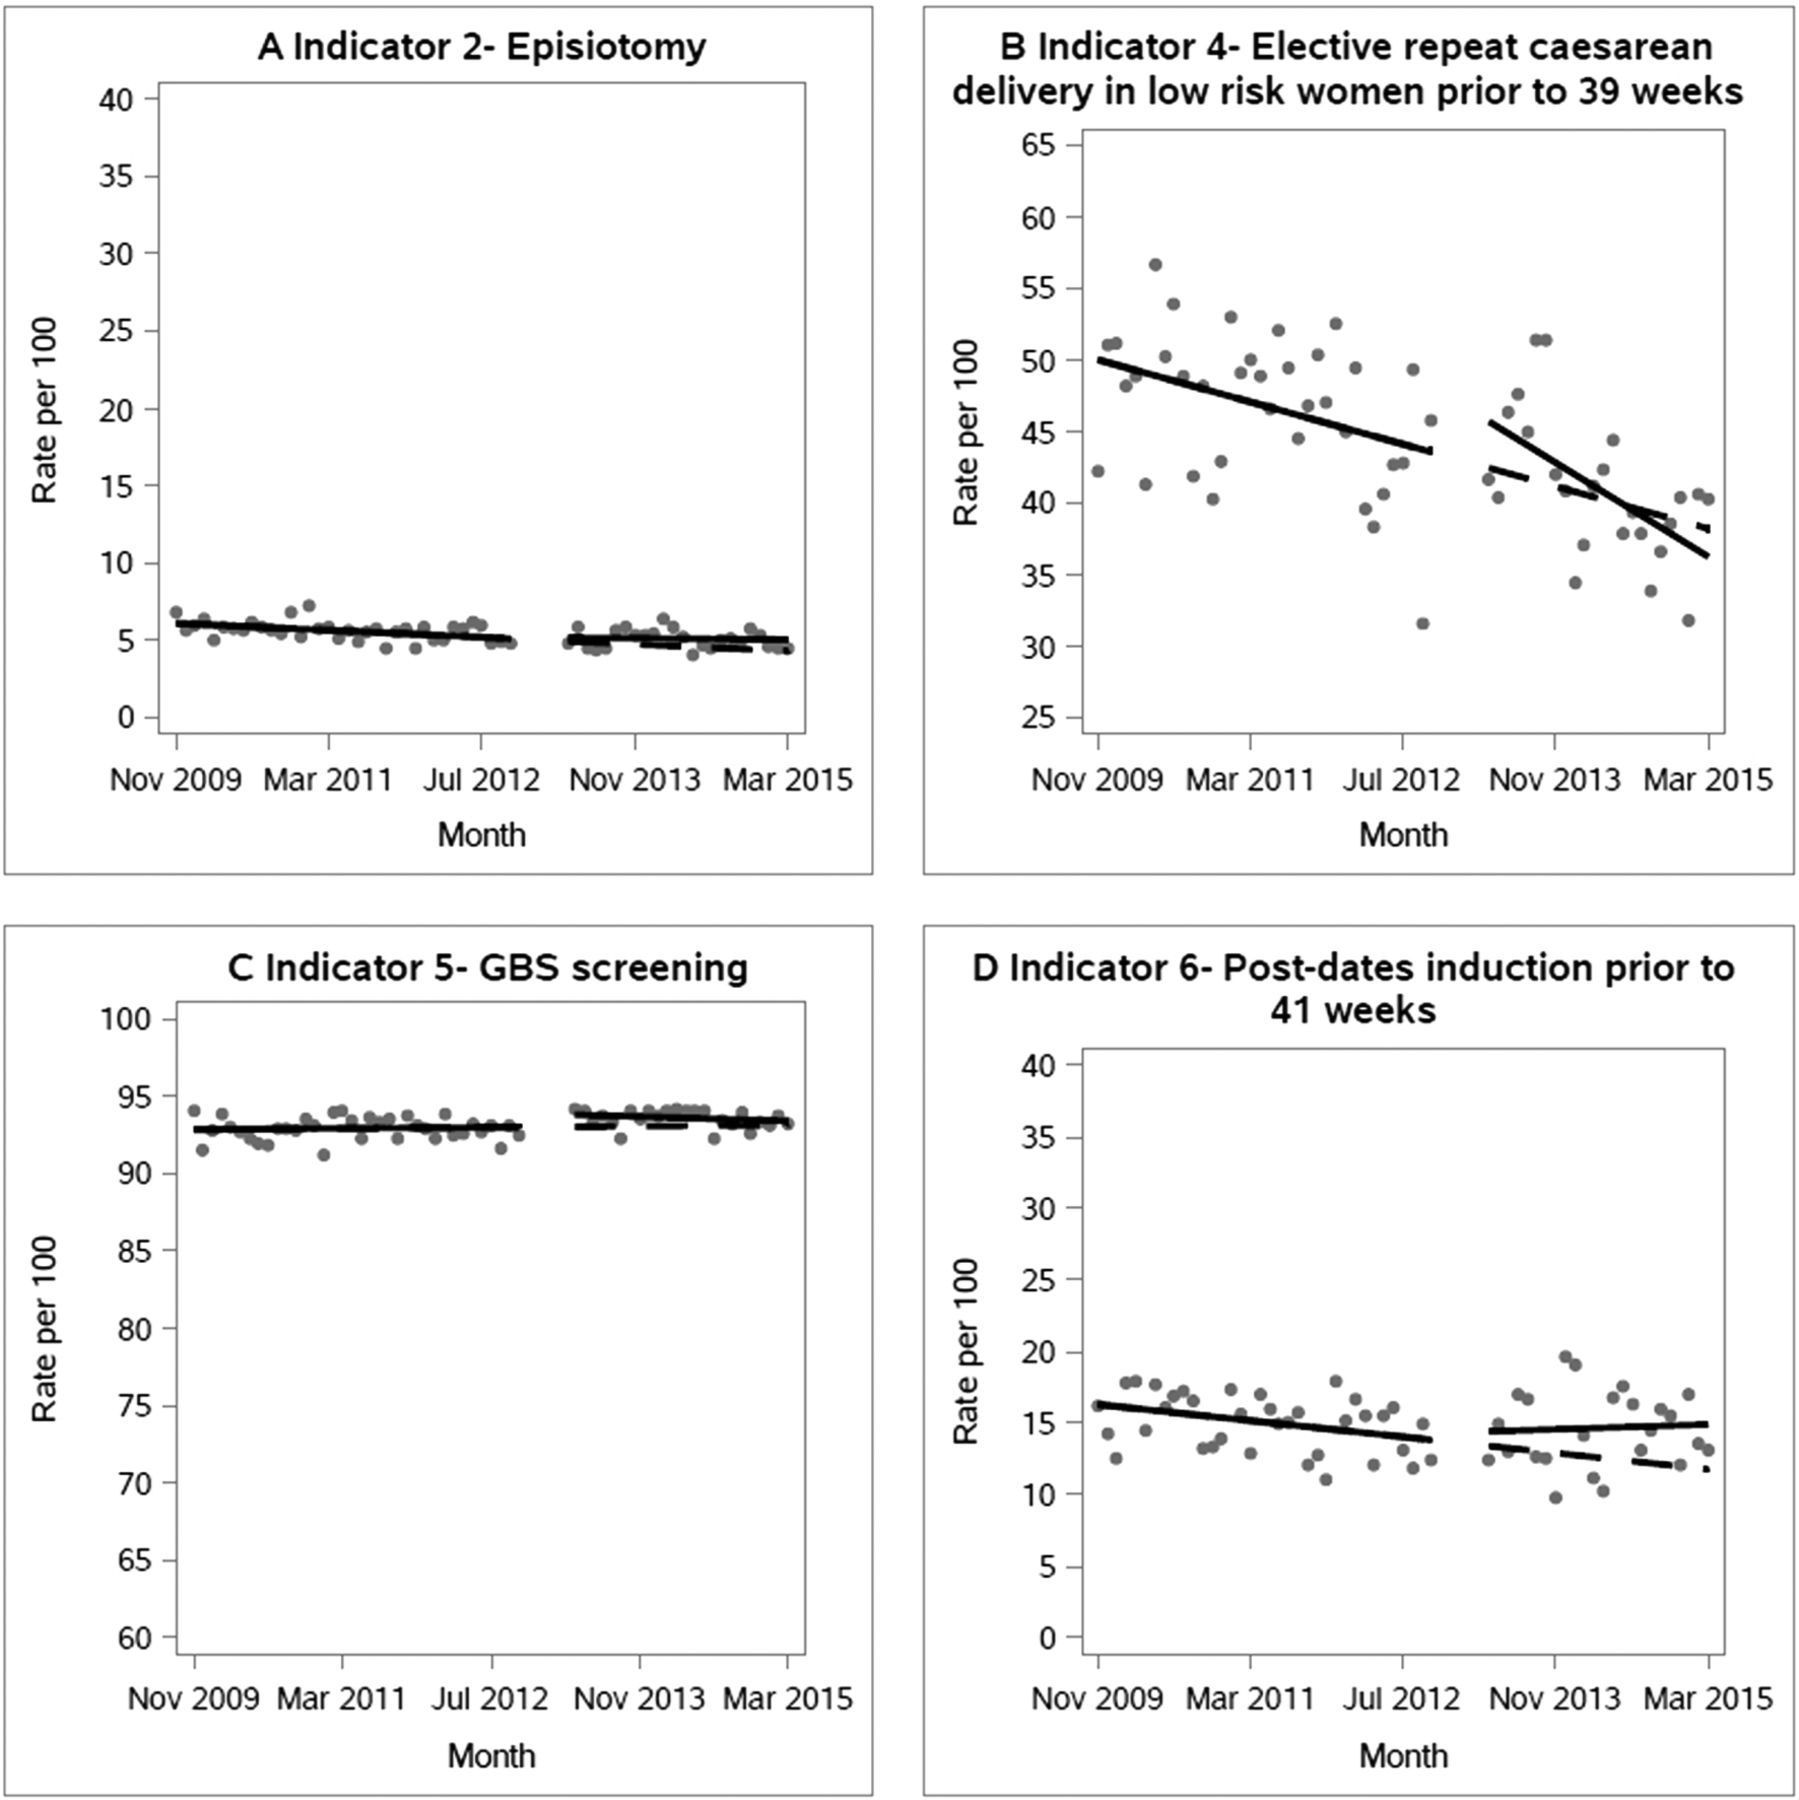
The results for the two internal control outcomes are presented in tables 1 and 2 and in figure 2. There were no significant effects of the Dashboard on the first control indicator. For the second indicator, an initial statistically significant increase in the level was observed, followed by a significant decrease in the slope, resulting in an overall null effect at 30 months postimplementation. The results of the segmented regression models applied to the external data set from British Columbia are presented in tables 1 and 2 and figure 3. There were no statistically significant improvements in any of the indicators coinciding with the timing of the Dashboard implementation in Ontario; in fact, two indicators (episiotomy and timing of postdates induction) increased in British Columbia relative to baseline.

Analyses evaluating the effect of the implementation of the Maternal Newborn Dashboard on provincial rates of two internal control outcomes from November 2009 to March 2015, in Ontario, Canada. For each plot, the grey circles are the raw data per hundred births, the solid line is the fitted linear regression line, and the dashed line is the projected trend assuming there was no intervention (counterfactual).

Analyses evaluating the effect of the implementation of the Maternal Newborn Dashboard on provincial rates of four clinical performance indicators in an external data set from November 2009 to March 2015, in British Columbia, Canada. For each plot, the grey circles are the raw data per hundred births, the solid line is the fitted linear regression line, and the dashed line is the projected trend assuming there was no intervention (counterfactual). GBS, group B streptococcus.
Discussion
Principal findings
This study found that an online audit and feedback intervention implemented in maternal-newborn hospitals was associated with overall improvements, at the provincial level, in four out of six of the targeted clinical issues. At 2.5 years post-Dashboard implementation, we demonstrated a statistically significant decrease in episiotomy, postdates induction prior to 41 weeks and elective repeat caesarean delivery prior to 39 weeks, and a statistically significant increase in the rate of GBS screening at term. No changes were observed for the number of unsatisfactory newborn screening samples or the rate of formula supplementation at discharge for babies of mothers who had intended to exclusively breast feed. In analyses with external control indicators from another province, rates of two indicators were found to worsen in the corresponding time period, which further supports that changes observed in Ontario are associated with the implementation of the Dashboard.
Strengths and weaknesses
An important strength of this study is the use of the ITS design, which allows the effect of the intervention to be differentiated from change due to secular trends.9 Furthermore, because population-level rates are used in the analysis, results should not be confounded by individual-level characteristics unless these changed simultaneously with the intervention.21 Additionally, two internal control outcomes—caesarean delivery rates in induced nulliparous women and use of auscultation in low-risk deliveries, which were not used as performance indicators in the Dashboard but were likely subject to the same potential threats to internal validity as our outcomes of interest—showed no significant association with implementation of the Dashboard. We also obtained data on performance indicators from the province of British Columbia but were unable to detect the changes we observed in Ontario. If changes in rates were observed in British Columbia, this might have led us to question if the changes observed in Ontario could be attributed to the Dashboard or were due to some other factor. There were two initiatives launched in Ontario in 2014, which targeted two of the Dashboard clinical indicators. The first involved a revision to the criteria regarding the assessment of unsatisfactory newborn samples for screening, and the second a provincial Baby-Friendly Initiative for promoting breast feeding. The former came into effect towards the end of our study period, and the latter, 6 months after; therefore, it is unlikely either affected the study results.
Additional strengths of this study are that all Ontario hospitals providing maternal-newborn care were included, and we used provincial registry data sets that capture at least 96% of births in the province. Therefore our coverage exceeds the proposed 80% coverage in the framework for assessing quality of ITS designs proposed by Ramsay et al.11 This study included an entire health jurisdiction, the province of Ontario, and our results indicate that audit and feedback can make substantial improvements on population health. Few efforts, in any specialty, have embraced such a vast change management, quality improvement initiative. While the launch of the new provincial registry presented the opportunity for implementation of the Dashboard, the fact that we had to use the historical data set prior to the launch of the new registry for the preimplementation period was challenging. The data elements and response choices were not the same in the historical data set, but every attempt was made to ensure that the mapping of the indicators between the two data sets was as exact as possible. While the use of provincial rates is a strength of the design, it also presents a limitation, in that it is not possible to identify institutional factors associated with differences in rates.
In this study, we used a robust but simple linear segmented regression fit to data pooled across all hospitals in order to yield a province-wide assessment of the effect of the Dashboard. An alternative approach, using random-effects regression accounting for clustering within hospitals, would have allowed us to deliberately examine variation across hospitals in the response to the Dashboard, but may have necessitated the exclusion of very small hospitals due to numerical instability. It is very unlikely that our results are driven by improvements at a small number of large hospitals: the total number of births included in the analysis is around 130 000 births per year, whereas the maximum contribution by any one hospital is only around 5% of this total. Future planned analyses include a random-effects analysis to explore between-hospital variation in the response to the Dashboard.
A possible weakness of our study is that the existence of the Dashboard influenced data capture, for example, that it brought attention to the clinical indicators. As well, tools were purposefully built into the system to facilitate auditing of the data, identification of data quality issues and resolution of erroneous data. An additional possible limitation involves the formula supplementation at discharge indicator. This indicator relies on the assessment of a mother’s intention to exclusively breast feed, which could be susceptible to reporting bias. Additionally, it is possible that data entered manually by clinical staff are susceptible to reporting bias. This risk may be partially mitigated by the fact that data were directly uploaded from electronic medical records at approximately a quarter of hospital sites. Further, ongoing data validation, quality checks and formal training are an integral part of the data collection platform,3 and formal data quality assessments that have been conducted on both the historical and new registry data sets suggest that the data quality is good overall and comparable between the two data sets.12 13 Any remaining data quality issues would likely bias the results towards the null, because their occurrence would not be expected to change over time or with Dashboard implementation, thereby leading to an underestimation of the effect of the Dashboard. Due to the fact that we tested multiple outcomes (six clinical performance indicators, plus six control indicators), our results are subject to increased risk of type I error due to multiple testing.
Comparison with previous studies
A 2012 Cochrane review concluded that audit and feedback interventions yielded a median 4.3% increase in provider compliance with practice recommendations (IQR: 0.5%–16%).4 In the current study, the absolute changes in the performance indicators ranged from 1.5% to 11%, within the range we would have expected based on this review. However, of the 140 studies included in the review, only three involved obstetrical care, and none involved the implementation of an audit and feedback intervention targeting multiple performance indicators, across an entire jurisdiction at a population level. Further, the Dashboard itself is novel in that users are provided with a near real-time continuous feed of information about their performance. In the Cochrane review, frequency of feedback was found to be one of the important factors in influencing effectiveness of audit and feedback interventions, with the majority of studies providing one-time feedback.4 While feedback is provided on an ongoing basis, one drawback of the Dashboard is that uptake of the information is user-controlled, so we know the frequency with which information is made available, but not the frequency with which it is accessed. As well, the feedback is not routinely provided to each healthcare provider, rather the person accessing the data collection platform will see the Dashboard. Interventions that target the healthcare provider directly may be more effective.22 A further difference between our study and other audit and feedback interventions is that the Dashboard targeted six performance indicators, where in much of the previous research, one indicator is targeted. In a systematic review published in 2006 assessing evidence-based strategies for implementing guidelines in obstetrics, 11 studies incorporating an audit and feedback approach were included,23 and of these, 9 reported a positive effect on guideline implementation. Of these, six targeted rates of caesarean delivery only, and all but two took place in one or two hospital sites. In two more recent studies, carried out at one hospital site in Brazil, improvements were reported for episiotomy and presence of a companion during birth, but not for the other indicators.24 25 A cluster randomised trial carried out at 32 hospitals in Quebec, Canada, with the objective of assessing the effect of a multifaceted intervention on caesarean delivery rates found a small but statistically significant reduction in rates in low-risk, but not high-risk women (adjusted risk difference=−1.7%, 95% CI −3.0 to −0.3).26 In this case it is not possible to isolate the effect of the audit and feedback because of the multifaceted nature of the intervention. Overall, based on previous studies, it is difficult to draw firm conclusions regarding the possible effect of audit and feedback interventions on outcomes in maternal-newborn care due to differences in study design and analysis, population and setting, and intervention characteristics. The features of the Dashboard, combined with total provincial implementation among maternal-newborn care sites in the province, along with our use of a robust analytical approach which included control analyses, mean we overcame many of the limitations encountered in previous research.
Possible explanations and implications for policymakers
After Dashboard implementation, we observed changes in clinical indicators that have the potential to improve population health at the provincial level. It is well established that elective repeat caesarean delivery prior to 39 weeks is associated with increased respiratory distress in the newborn and increased neonatal intensive care unit admission rates, and therefore many obstetrical organisations recommend these procedures be avoided prior to 39 weeks’ gestation.27 28 Our results indicate that over 30 months, the Dashboard was associated with 1825 fewer women undergoing an elective repeat caesarean delivery prior to 39 weeks, with a resultant reduced risk of adverse outcomes for newborns. Likewise, over the 30-month period post-Dashboard implementation, our results translate to 2990 fewer episiotomies and 3188 fewer inductions for postdates prior to 41 weeks, as well as 7990 more women receiving appropriately timed GBS screening.
Because the Dashboard was implemented provincially, our results are potentially generalisable to other jurisdictions that maintain provincial birth registries, such as the Canadian provinces of Nova Scotia, British Columbia, and Newfoundland and Labrador. Our results are also potentially generalisable to other clinical contexts having population-level registry data at the organisational level, such as cancer or cardiovascular disease.
While our results suggest that the Ontario Dashboard did have an effect on four clinical indicators at the provincial level, no effect was seen on rates of unsatisfactory newborn screening samples, nor was an effect observed on rates of formula supplementation at discharge in mothers who intended to breast feed. For the former, this may be due to a ceiling (or floor) effect, in that the rates of unsatisfactory samples were already very low at baseline, leaving little room for possible improvement.4 For the latter, breast feeding is a very complex issue, and change may involve a host of factors. It may be that for this performance indicator, a multifaceted, tailored approach is required.29 Further, length of stay in hospital postpartum is short, making it difficult to implement breastfeeding strategies. Our study highlights an important implication for researchers, funders and policymakers undertaking this type of research—that practice change takes time, particularly for complex clinical issues.30 31 As well, hospitals with multiple practice issues might have had to prioritise and selectively emphasise certain Dashboard indicators, leaving others for the future. It is important to establish realistic expectations for how long change takes, in particular when multiple issues are targeted for change.
Unanswered questions and future research
We report here the overall, population-based changes in rates observed after the implementation of an audit and feedback intervention at the jurisdictional level. This study represents one stage of a multiphased evaluation of the Dashboard; the next steps of this evaluation involve an assessment of hospital-specific factors to better understand how audit and feedback is used to improve practice, and why it is more successful in some institutions as compared with others. In future analyses, random-effects regression will be used to examine differences in the effect of the Dashboard among hospitals and to identify factors associated with such between-hospital variation. While it was not the focus of this current analysis, we expect that the size and direction of change in rate of performance indicators will vary among hospitals, and therefore in the next phase of our research we are exploring factors at the hospital level associated with variability in performance after implementation of Dashboard, using both quantitative and qualitative methods.
Acknowledgments
Thank you to Erin Graves who contributed to the early stages of the analysis, and to Ashley Desrosiers for her assistance with background research. We would also like to thank Perinatal Services BC for providing data, and Newborn Screening Ontario and all maternal newborn hospitals in Ontario for contributing data to the registry – making this study possible.
References
Footnotes
Handling editor Kaveh G Shojania
Contributors SID, AES, DBF, JMG, ED, IDG, JH, GNS, WEP, MCW and MT contributed to the conception, design and implementation of the study, and acquired funding. DW carried out the analyses, interpreted the analyses, and drafted and revised the manuscript. All authors contributed to the acquisition, analysis and interpretation of the data. All authors participated in the writing of this manuscript and reviewed and approved the final manuscript, and take responsibility for the integrity of the data and the accuracy of the data analysis. SID as co-PI is guarantor.
Funding This study was funded by the Canadian Institutes of Health Research (CIHR- FRN: 133576) and the Ontario Ministry of Health and Long-Term Care (MOHLTC - 06684).
Competing interests All authors have completed the ICMJE uniform disclosure form and declare the following: SID, AES, DBF, JMG, ED, IDG, JH, WEP, MCW and MT report grants from CIHR-Operating Grant and grants from MOHLTC-HSRF Capacity Award, during the conduct of the study. The authors declare no financial relationships with any organisations that might have an interest in the submitted work in the previous 3 years, and no other relationships or activities that could appear to have influenced the submitted work.
Ethics approval Children’s Hospital of Eastern Ontario Research Ethics Board (#13/218X) and University of Ottawa Research Ethics Board (#A01-14-03).
Provenance and peer review Not commissioned; externally peer reviewed.
Data sharing statement The data set for this study is held securely at the Ontario prescribed registry Better Outcomes Registry & Network (BORN). Data sharing regulations prevent this data from being made available publicly. Enquiries regarding BORN data may be directed to Science@BORNOntario.ca.
Correction notice This article has been updated to correct typographical errors in the main text.