Article Text

Abstract
Background The public health burden associated with diagnostic errors is likely enormous, with some estimates suggesting millions of individuals are harmed each year in the USA, and presumably many more worldwide. According to the US National Academy of Medicine, improving diagnosis in healthcare is now considered ‘a moral, professional, and public health imperative.’ Unfortunately, well-established, valid and readily available operational measures of diagnostic performance and misdiagnosis-related harms are lacking, hampering progress. Existing methods often rely on judging errors through labour-intensive human reviews of medical records that are constrained by poor clinical documentation, low reliability and hindsight bias.
Methods Key gaps in operational measurement might be filled via thoughtful statistical analysis of existing large clinical, billing, administrative claims or similar data sets. In this manuscript, we describe a method to quantify and monitor diagnostic errors using an approach we call ‘Symptom-Disease Pair Analysis of Diagnostic Error’ (SPADE).
Results We first offer a conceptual framework for establishing valid symptom-disease pairs illustrated using the well-known diagnostic error dyad of dizziness-stroke. We then describe analytical methods for both look-back (case–control) and look-forward (cohort) measures of diagnostic error and misdiagnosis-related harms using ‘big data’. After discussing the strengths and limitations of the SPADE approach by comparing it to other strategies for detecting diagnostic errors, we identify the sources of validity and reliability that undergird our approach.
Conclusion SPADE-derived metrics could eventually be used for operational diagnostic performance dashboards and national benchmarking. This approach has the potential to transform diagnostic quality and safety across a broad range of clinical problems and settings.
- diagnostic errors
- patient harm
- outcome measures/methods
- process measures/methods
- public health informatics/methods
- epidemiology/diagnosis
Statistics from Altmetric.com
- diagnostic errors
- patient harm
- outcome measures/methods
- process measures/methods
- public health informatics/methods
- epidemiology/diagnosis
Introduction
According to the US National Academy of Medicine (NAM), diagnostic errors represent a major public health problem likely to affect each of us in our lifetime.1 The 2015 NAM report, Improving Diagnosis in Healthcare, goes on to state that, ‘improving the diagnostic process is not only possible, but it also represents a moral, professional, and public health imperative.’1 Annually in the USA, there may be more than 12 million diagnostic errors2 with one in three such errors causing serious patient harm.3 The aggregate annual costs to the US healthcare system could be as high as US$100–US$500 billion.4 The global problem is likely even bigger.5–8
Diagnostic errors represent the ‘bottom of the iceberg’ of patient safety—a hidden, yet large, source of morbidity and mortality. Valid operational measures are badly needed to surface this problem so that it can be quantified, monitored and tracked.9 Existing measures of diagnostic error that rely on manual chart review to confirm diagnostic errors suffer from problems of poor chart documentation,10 11 low inter-rater reliability,12 13 hindsight bias14 and the high costs of human labour needed for chart abstraction. Additionally, reliance on chart review alone will likely lead to an underestimation of diagnostic error since key clinical features necessary to identify errors are preferentially missing from charts where errors occur.15 16 We believe that key gaps in operational measures of diagnostic error can be filled via thoughtful statistical analysis of large clinical (electronic health record (EHR)) and administrative (billing, insurance claims) data sets.
In this manuscript, we describe a novel conceptual framework and methodological approach to measuring diagnostic quality and safety using ‘big data’: Symptom-Disease Pair Analysis of Diagnostic Error (SPADE). We illustrate our approach predominantly using a single well-studied example (dizziness-stroke), but provide evidence that SPADE could be used to develop a scientifically valid set of diagnostic performance metrics across a broad range of conditions.
Diagnostic error and misdiagnosis-related harm definitions
The NAM defines diagnostic error as failure to (A) establish an accurate and timely explanation of the patient’s health problem(s) or (B) communicate that explanation to the patient.1 Harms resulting from the delay or failure to treat a condition actually present (false-negative diagnosis) or from treatment provided for a condition not actually present (false-positive diagnosis) are known as misdiagnosis-related harms.17 18 A key feature of the NAM definition is that it does not require the presence of a diagnostic process failure (eg, failure to perform a specific diagnostic test)17 nor that the error could have been prevented. This patient-centred definition is agnostic as to the correctness of the diagnostic processes; it relies only on the outcome of a patient receiving an inaccurate or delayed diagnosis as opposed to an accurate and timely diagnosis.1
The SPADE approach, described in detail below, uses unexpected adverse health events (eg, stroke, myocardial infarction (MI), death) to measure misdiagnosis-related harms.19–25 SPADE methods maintain core consistency with the NAM definition of diagnostic error by identifying inaccurate or delayed diagnoses, regardless of cause or preventability. Although SPADE does not specifically address communication with patients (part ‘B’ of the NAM definition), if failure to communicate a diagnosis to a patient results in a clinically relevant and harmful health event (ie, misdiagnosis-related harm), the SPADE approach will detect it. A key advantage of this approach is that using ‘hard’ clinical outcomes avoids much of the subjectivity12–14 inherent in other methods that rely on detailed, human medical record reviews to assess for errors.
The symptom-disease pair framework for measurement
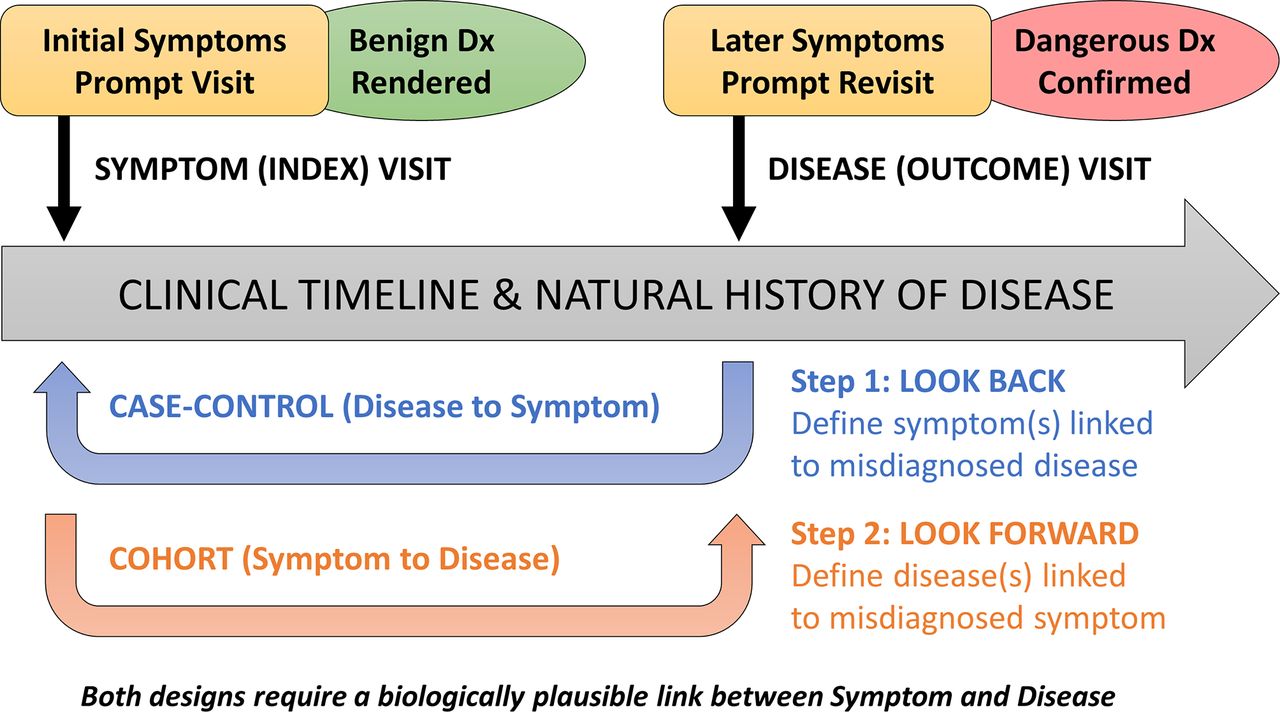
The SPADE approach is premised on three principles: (1) patients with symptoms seek medical attention; (2) the object of the medical diagnostic process is to identify the underlying cause (ie, the condition(s) responsible for the patient’s symptom(s)); and (3) failure to correctly diagnose the underlying disease(s) in a timely manner (NAM-defined diagnostic error) may be followed by illness progression that might have been avoided through prompt diagnosis and treatment (preventable misdiagnosis-related harm). In this approach, we combine what is known about disease natural history and pathophysiology to develop an inferential model for identifying misdiagnosis-related harms based on time-linked markers of diagnostic delay that are clinically sensible, biologically plausible and specific to symptom-disease pairs (figure 1).

Conceptual model for Symptom-Disease Pair Analysis of Diagnostic Error (SPADE). The SPADE conceptual framework for measuring diagnostic errors is based on the notion of change in diagnosis over time. Envisioned is a scenario in which an initial misdiagnosis is identified through a biologically plausible and clinically sensible temporal association between an initial symptomatic visit (that ended with a benign diagnosis rendered) and a subsequent revisit (that ended with a dangerous diagnosis confirmed); note that these ‘visits’ could also be non-encounter-type events (eg, a particular diagnostic test, treatment with a specific medication, or even death). The framework shown here illustrates differences in structure and goals of the ‘look back’ (disease to symptoms) and ‘look forward’ (symptoms to disease) analytical pathways. These pathways can be thought of as a deliberate sequence that begins with a target disease known to cause poor patient outcomes when a diagnostic error occurs: (1) the ‘look back’ approach defines the spectrum of high-risk presenting symptoms for which the target disease is likely to be missed or misdiagnosed; (2) the ‘look forward’ approach defines the frequency of diseases missed or misdiagnosed for a given high-risk symptom presentation. Dx, diagnosis.
Symptom-disease pairs that may be ‘diagnostic error dyads’ can be analysed using either a ‘look-back’ or a ‘look-forward’ approach (figure 2). The look-back approach takes an important disease and identifies which clinical presentations of that disease are most likely to be missed. The look-forward approach takes a common symptom and identifies which important diseases are likely to be missed among patients who present with this symptom. When little is known about misdiagnosis of a particular disease, a look-back analysis helps identify promising targets to establish one or more diagnostic error dyads. Once one or more diagnostic error dyads are established, a look-forward analysis can be performed to measure real-world performance.

Method for establishing a symptom-disease pair using dizziness-stroke as the exemplar. Envisioned is a ‘symptom’ and ‘disease’ visit occurring as clinical events unfold in the natural history of a disease, as illustrated in figure 1. (A) The ‘look-back’ approach is used to take a single disease known to cause harm (eg, stroke) and identify a number of high-risk symptoms that may be missed (eg, dizziness/vertigo). In this sense, the ‘look-back’ approach (case–control design) can be thought of as hypothesis generating. In the exemplar, stroke is chosen as the disease outcome. Various symptomatic clinical presentations at earlier visits are examined as exposure risk factors, some of which are found to occur with higher-than-expected odds in the period leading up to the stroke admission. (B) The ‘look-forward’ approach is used to take a single symptom known to be misdiagnosed (eg, dizziness/vertigo) and identify a number of dangerous diseases that may be missed (eg, stroke). In this sense, the ‘look-forward’ approach (cohort design) can be thought of as hypothesis testing. In the exemplar, dizziness is chosen as the exposure risk factor, and various diseases are examined as potential outcomes, some of which are found to occur with higher-than-expected risk in the period following the dizziness discharge.
The SPADE approach
The SPADE approach relies on having information from at least two discrete points in time. The first time point is an ‘index’ diagnosis and the second time point is an ‘outcome’ diagnosis (figure 1). The outcome diagnosis must plausibly link back to symptoms or signs from the index visit (and diagnosis) yet be unexpected or improbable if the index diagnosis had been correct. The most common and straightforward diagnostic error scenario is one in which an ambulatory index visit (eg, primary care or emergency department (ED)) results in a discharge for a supposedly benign disorder (treat-and-release visit) and a subsequent outcome visit or admission discloses otherwise. For example, the occurrence of an adverse outcome (eg, hospitalisation for a newly diagnosed stroke, MI or sepsis) shortly after a treat-and-release ED visit with a benign diagnosis rendered is a strong indicator of diagnostic error with misdiagnosis-related harm (assuming similar symptoms or signs are associated with both the benign and dangerous diseases).
For illustrative purposes, we will use the case of a patient seen in the ED with a chief complaint of dizziness diagnosed as a benign inner ear condition, but who has dangerous cerebral ischaemia as the true cause of her symptoms.26 27 Imagine we are unsure of whether this symptom-disease pair (dizziness-stroke) is a real dyad26 28 or merely coincidental. We would note that, biologically speaking, dizziness/vertigo can be a manifestation of minor stroke or transient ischaemic attack (TIA).29 With untreated TIA and minor stroke, there is a marked increased short-term risk of major stroke in the subsequent 30 days that tapers off by 90 days.29–31 A clinically relevant and statistically significant temporal association between ED discharge for supposedly ‘benign’ vertigo followed by a stroke diagnosis within 30 days is therefore a biologically plausible marker of diagnostic error.21 If this missed diagnosis of cerebral ischaemia resulted in a clinically meaningful adverse health outcome (eg, stroke hospitalisation), this would suggest misdiagnosis-related harm.
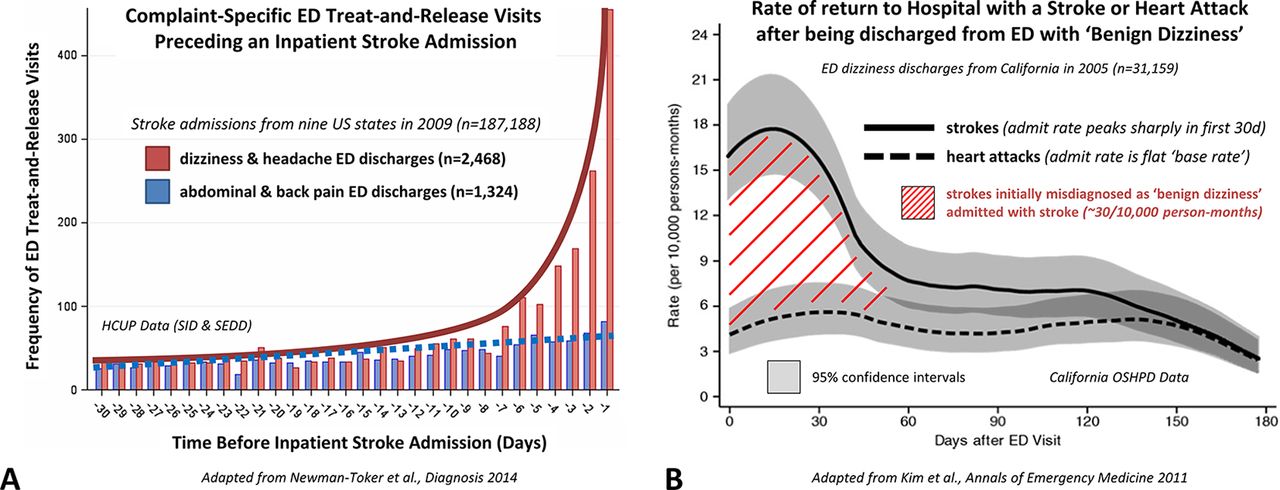
The association of treat-and-release visits for ‘benign’ vertigo and subsequent hospitalisations for stroke can readily be measured using information collected in administrative claims or large EHR data sets.21 22 25 We can employ a bidirectional analysis (figure 3). Using the look-back method, we start with a disease cohort of hospitalised patients with stroke and look back in time to prior treat-and-release ED visits for vertigo.25 We analyse the observed to expected treat-and-release visit frequency and temporal distribution of such visits during a reasonable time window. We employ positive (headache) and negative (abdominal/back pain) symptom controls, finding that vertigo is the most over-represented prestroke admission treat-and-release ED visit (figure 3A).25 Using the look-forward method, we start with a vertigo symptom cohort of discharged ED patients and look forward in time to subsequent stroke admissions. We can employ positive (intracerebral haemorrhage) and negative (MI) disease controls, finding that only short-term cerebrovascular event rates are elevated above the base rate, suggesting that a ‘benign’ vertigo discharge is a meaningful risk factor for missed stroke but not missed MI (figure 3B).21

Bidirectional Symptom-Disease Pair Analysis of Diagnostic Error (SPADE) analysis applied to the dizziness-stroke dyad. (A) Patients hospitalised for stroke (n~190 000) are more likely to have had a treat-and-release ED visit for so-called ‘benign’ dizziness within the prior 14 days. Using the ‘look-back’ approach, dizziness is an over-represented symptom (ie, among patients with inpatient stroke admissions, high odds of a recent ED discharge). Treat-and-release ED dizziness discharges occur disproportionately in the days and weeks immediately prior to stroke admission, in a biologically plausible and clinically sensible temporal profile (exponential curve before admission, shown in red) paralleling the natural history of major stroke following minor stroke or transient ischaemic attack (TIA). In contrast, abdominal and back pain discharges are under-represented (ie, among strokes, low odds of a recent ED discharge) and temporally unassociated to the stroke admission (Adapted from Newman-Toker et al 17). (B) ‘Benign’ dizziness treat-and-release discharges from the ED (n~30 000) are more likely to return for an inpatient stroke admission within the subsequent 30 days. Using the ‘look-forward’ approach, stroke turns out to be the disease with the most elevated short-term risk profile (ie, among patients discharged from the ED with supposedly benign dizziness, the greatest rate of subsequent stroke admission); these occur disproportionately in the days and weeks immediately following the dizziness discharge from the ED, again in a biologically plausible temporal profile (‘hump’ seen after discharge, shown as red hatched area) paralleling the natural history of major stroke following minor stroke or TIA. By contrast, heart attack risk remains at baseline (ie, among dizziness discharges, there is a low, stable rate of myocardial infarction admissions over time) and is temporally unassociated to the initial ED dizziness discharge (Adapted from Kim et al 21). ED, emergency department; HCUP, Healthcare Cost and Utilization Project; OSHPD, Office of Statewide Health Planning and Development; SEDD, State Emergency Department Databases; SID, State Inpatient Databases.
Together, these analyses statistically support the symptom-disease pair of dizziness-stroke and create strong inferential evidence of an index visit diagnostic error (incorrect diagnosis of benign vertigo rendered) with subsequent misdiagnosis-related harms (worsening or recurrent cerebral ischaemia necessitating hospitalisation). Specific analyses that can be used to establish major aspects of validity and reliability for SPADE are shown in table 1.32–34 Key among these are: (1) the bidirectional relationship in an overlapping temporal profile, which establishes convergent construct validity of the association and a link to biological plausibility34; and (2) the use of negative control comparisons which establishes discriminant construct validity and makes it highly improbable that patients discharged from the ED merely have an elevated short-term risk of all adverse medical events (ie, are non-specifically ‘sick’). These statistical methods highlight the fact that valid measures of diagnostic error need not be exclusively derived from traditional approaches such as chart review, survey data or prospective studies.
Optimal measurement context for SPADE
Disease types and analytical approach
The SPADE method should apply to any condition where the short-term risk of worsening or recurrence is high. SPADE has been used for other symptoms and signs tied to missed stroke (headache-aneurysmal subarachnoid haemorrhage19; facial weakness-ischaemic stroke35); to missed cardiovascular events (eg, chest pain-MI)20 24; and to missed infections (eg, fever-meningitis/sepsis36; Bell’s palsy-acute otitis35). Since missed vascular events and infections together account for at least one-third of all misdiagnosis-related harms,37–40 using SPADE to monitor and track such errors would represent a major advance for the field.
SPADE can be used to assess a single symptom tightly linked to a single disease (headache-aneurysm,19 syncope-pulmonary embolus41), but can also be used to measure multiple related symptoms or diseases. For example, if multiple symptoms are associated with a target disease (eg, chest pain, shortness of breath, abdominal pain and syncope for MI), the symptoms may be bundled together in the analysis.20 Likewise, if a single symptom is associated with multiple target diseases (eg, fever for meningitis, toxic shock and sepsis), the diseases may be bundled together in the analysis.36 As proof of concept, a recent SPADE-style analysis of over 10 million ED discharges used multiple symptoms-to-disease mappings to identify misdiagnosis (figure 4).42

Linking multiple symptoms to multiple diseases using a Symptom-Disease Pair Analysis of Diagnostic Error (SPADE) framework. Sankey diagram (adapted from Obermeyer et al 42) demonstrating discharge diagnoses from index ED visit (left) and their association with documented causes of death (right) within 7 days of discharge in a subset of Medicare fee-for-service beneficiaries. These results were obtained using a SPADE-style analysis of over 10 million ED discharges and used multiple symptom-disease pairs to identify likely diagnostic errors. Each index and outcome diagnosis category represents an aggregation of related codes (coding details found in ref 42), and line thickness is proportional to the number of beneficiaries. Statistical analyses found excess, potentially preventable deaths based on hospital admission fraction from the ED. These results highlight the viability of using symptom and disease bundling and statistical analysis of visit patterns to track misdiagnosis-related harms—specifically, in this example, mortality associated with diagnostic errors. ED, emergency department.
Some diseases are less well suited to SPADE. For example, chronic diseases for which the risk of misdiagnosis-related harms is either constant or very slowly increasing over time (eg, diabetes, hypertension) will make patterns of diagnostic error difficult to discern via SPADE. For diseases with a subacute time course presenting non-specific symptoms (eg, tuberculosis8 and cancer43), a more complex analytical approach is required. For example, it might be necessary to bundle symptoms and combine with visit/test ordering patterns over time (eg, increased odds of general practitioner visits for new complaints/tests in the 6 months before a cancer diagnosis43).
Ideal data sets
Large enough data sets are needed to draw statistically valid inferences. Most prior studies using aspects of the SPADE approach have examined data sets containing 20 000–190 000 visits to identify misdiagnosis-related harm rates of ~0.2%–2%.21 25 35 From a statistical standpoint, the total number of diagnostic error-related outcome events (eg, admissions) should ideally not be fewer than 50–100, so this implies minimal sample sizes of 5000–50 000 visits for event rates in the 0.2%–2% range. Thus, even for common symptoms or diseases, data must generally be drawn from a large health system or region over a short period (eg, 6 months) or a small health system or hospital over a longer period (eg, 5 years). Constraints on the spatial and temporal resolution of SPADE make it unlikely that this approach could be used for provider-level feedback. This constraint, however, relates to the frequency of harm, not the SPADE method—in other words, any method that assesses infrequent harms will have to draw from a large sample.
Data sets that include ‘out-of-network’ follow-up provide the most robust estimates of diagnostic error, avoiding the problem of hospital crossover (ie, patient goes to one centre at the index visit but returns to an unaffiliated centre at the outcome visit). In a 1-year study of crossover in ED populations across five health systems, 25% of patients who revisited crossed over.44 In a large study of missed subarachnoid haemorrhage in the ED that used regional health data, hospital crossover occurred in 37% of misdiagnosed patients.19 Taken together, these data suggest that patients who are misdiagnosed may be disproportionately likely to cross over. Thus, SPADE will likely provide the strongest inferences when used with data sets that include crossovers (eg, regional health information exchanges like the Chesapeake Regional Information System for our Patients) or from health systems with integrated insurance plans where patients are tracked when they use outside healthcare facilities (eg, Kaiser Permanente22). Nevertheless, even without data on crossovers, health systems can still track error rates over time—measured rates may be lower than the true rates, but rate changes should still reflect temporal trends.
The best data sets for SPADE will have information on visits and admissions, and on other events, such as intrahospital care escalations (eg, ward to ICU transfers) and deaths. Recently, pairing of non-life-threatening ED discharge diagnoses to subsequent death among Medicare beneficiaries was used to identify misdiagnoses (figure 4).42 However, even without death (or other outcome) data, tracking to monitor diagnostic quality and safety trends and intervene to improve them remains possible. This is because root causes (eg, cognitive biases, knowledge deficits) and process failures (eg, exam findings not elicited, tests not ordered) leading to misdiagnosis of specific dangerous diseases probably do not differ based on the severity of subsequent harms (eg, hospital readmission vs out-of-hospital death). Even for conditions with very high mortality (eg, aortic dissection), many patients would still be captured by a delayed admission-only approach.45 Thus, a diagnostic intervention to improve diagnosis of aortic dissection that reduced misdiagnosis-related readmissions would presumably also reduce misdiagnosis-related deaths.
Having systematically coded EHR data on presenting symptoms (as opposed to inferring these from index visit discharge diagnoses) can enrich a SPADE analysis. However, it is not essential, since it is the benign or non-specific nature of the index visit discharge diagnosis (rather than the presenting symptom, per se) that reflects the diagnostic error. Furthermore, many of the index visit diagnoses are coded as non-specific symptoms (eg, dizziness, not otherwise specified25).
Using SPADE to assess preventable harms from diagnostic process failures
SPADE measures the frequency of diagnostic errors causing misdiagnosis-related harms, rather than all diagnostic errors. This concept is most intuitive using the look-forward approach. Isolated vertigo of vascular aetiology is the most common early manifestation of brainstem or cerebellar ischaemia and is often missed initially as a stroke sign.29 Since it is unlikely that a patient sent home with an index diagnosis of ‘benign’ vertigo also had other obvious neurological signs (eg, hemiparesis or aphasia), their subsequent hospitalisation for stroke suggests clinical worsening or recurrent ischaemia (eg, major stroke after minor stroke or TIA).31 Thus, graphically, the ‘hump’ (hatched area) shown in figure 3B more accurately reflects misdiagnosis-related harms rather than diagnostic error, per se. Fewer than 20% of patients with TIA or minor stroke go on to suffer a major stroke within 90 days,46 47 so there are likely to be at least fivefold more diagnostic errors (misidentifications of TIA or minor stroke at the index visit) than misdiagnosis-related harms (subsequent, delayed major stroke admissions).
When diagnostic process data (eg, use of imaging, lab tests or consults) are also available, it is possible to identify process failures and test their association with misdiagnosis-related harms. For example, guidelines indicate that benign paroxysmal positional vertigo (BPPV), an inner ear disease, should be diagnosed and treated at the bedside without neuroimaging.48 49 Frequent use of neuroimaging in patients discharged with BPPV suggests knowledge or skill gaps in bedside diagnosis of vertigo.26 50 Such process failures may correlate to misdiagnosis-related harms (eg, use of neuroimaging in ‘benign’ dizziness/vertigo is linked to increased odds of stroke readmission after discharge51). For cancers, process failures can be identified by measuring diagnostic intervals (eg, time from index visit to advanced testing or specialty consultation to treatment)43 52; diagnostic delays can be correlated to outcomes and targeted for disease-specific process improvement.53
The SPADE approach can also facilitate identification of symptom-independent system factors that contribute to misdiagnosis. For example, in the study described above looking at short-term mortality after ED discharge, low hospital admission fraction at the index ED visit was associated with death postdischarge.42 Other studies have found triage to low acuity care is linked to misdiagnosis.19 Healthcare settings can be compared for risk of misdiagnosis and harms—for example, the risk for missed stroke is greater in ED than primary care, but the magnitude of harms is similar because of greater patient volumes in primary care.22 Important demographic and racial disparities in care can also be measured using SPADE.24 25
Using SPADE to measure diagnostic performance and impact of interventions
The operational quality and safety goal is ongoing measurement of diagnostic performance in actual clinical practice.9 A major advantage of SPADE is that the core, essential administrative data are already being collected and could be easily used to track diagnostic performance without significant financial burdens. Because these data are also available from past years, internal performance trend lines could be readily constructed. For relatively common diagnostic problems such as chest pain-MI or vertigo-stroke, health systems could probably monitor their performance semiannually or quarterly using a rolling window of 6–12 months of data. Such monitoring would facilitate assessment of interventions to improve diagnostic performance.
In 2017, a National Quality Forum expert panel highlighted SPADE methods as a key measure concept to assess ‘harms from diagnostic error based on unexpected change in health status’ that holds promise for operational use because of the ready availability of administrative data.54 Relevant data for applying SPADE are already gathered in standard, structured formats (eg, International Classification of Diseases diagnostic codes); thus, cross-institutional benchmarking is a realistic possibility if data are curated through an ‘honest broker’.55 Geographic or institutional variation in diagnostic accuracy could also be detected.25 56 Eventually, SPADE-derived metrics could be incorporated into operational diagnostic performance dashboards.22
Differences between SPADE and electronic trigger tools
Electronic trigger tools seek to identify missed diagnostic opportunities or failed diagnostic processes.57–59 Trigger tools use specific predetermined EHR events (eg, unplanned revisits to primary care) to ‘trigger’ medical record review by trained personnel.60 These ‘trigger’ events can be similar to outcome events used in SPADE, but trigger tools rely on human chart review for adjudication of diagnostic errors, while SPADE combines biological plausibility with statistical analysis of large data sets to verify errors. Also, trigger tools are typically used to find individual patient errors for process analysis and remediation, while SPADE would be used to understand the overall landscape of misdiagnosis-related harms to prioritise problems for solution-making and to operationally track performance over time, including to assess impact of interventions.
Limitations of SPADE
SPADE will not solve all problems in measuring diagnostic errors.17 61–64 The method probably substantially understates the frequency of NAM-defined diagnostic errors, since it focuses on misdiagnosis-related harms. It is also not readily applied to all disease states, including chronic conditions where adverse outcomes are evenly distributed over time. The spatial and temporal resolutions are too low to provide individual provider feedback. Correlating SPADE outcome measurements directly to bedside process failures (eg, flawed history or examination) will still require free-text analysis of records or other granular data. When using coded diagnoses for index and outcome visits, SPADE is potentially susceptible to various types of coding error and bias, including intentional gaming such as mis-specification, unbundling and upcoding.65 Because SPADE uses large data sets to identify diagnostic error patterns, it risks apophenia,66 so appropriate statistical validation checks and controls are critical when using SPADE (table 1).
Finally, SPADE has not been directly validated against an independent ‘gold standard’. The method is strongly supported by the fact that the dizziness-stroke dyad has an extensive body of remarkably coherent and consistent scientific literature26 28 that includes chart reviews,15 16 67 surveys,68 69 cross-sectional health services research studies,50 51 56 70 prospective cohort studies71 72 and SPADE-type studies using look-back25 and look-forward21–23 methods. Problems inherent in human chart reviews, particularly hindsight and observer biases,12–14 and flawed underlying documentation15 suggest that this is probably not an ideal reference standard for SPADE. A better validation strategy might be to vet coding and classification accuracy against review of videotaped encounters or gold-standard randomised trial data, as from AVERT (Acute Video-oculography for Vertigo in Emergency Rooms for Rapid Triage; ClinicalTrials.gov NCT02483429). The most compelling validation of the SPADE method would probably be to ‘flatten the hump’ (figure 3B) through diagnostic quality and safety interventions—this would demonstrate predictive validity of SPADE-based metrics.
Conclusions
We have elaborated a conceptual framework, SPADE, that could be used to measure and monitor a key subset of misdiagnosis-related harms using pre-existing, administrative ‘big data’. This directly addresses a major patient safety and public health need1 9 which we believe could be transformational for improving diagnosis in healthcare by surfacing otherwise hidden diagnostic errors. The SPADE approach leverages symptom-disease pairs and uses statistically controlled inferential analyses of large data sets to construct operational outcome metrics that could be incorporated into diagnostic performance dashboards.22 When tested, these metrics have demonstrated multiple aspects of validity and reliability. Broad application of the SPADE approach could facilitate local operational improvements, and large-scale, epidemiological research to assess the breadth and distribution of misdiagnosis-related harms, and international/national benchmarking efforts that establish standards for diagnostic quality and safety. Future research should seek to validate SPADE across a wide range of clinical problems.
References
Footnotes
Funding National Institute on Deafness and Communication Disorders (grant #U01 DC013778) and the Armstrong Institute Center for Diagnostic Excellence.
Competing interests None declared.
Provenance and peer review Not commissioned; externally peer reviewed.