Article Text

Abstract
Background To assess the specificity of an algorithm designed to detect look-alike/sound-alike (LASA) medication prescribing errors in electronic health record (EHR) data.
Setting Urban, academic medical centre, comprising a 495-bed hospital and outpatient clinic running on the Cerner EHR. We extracted 8 years of medication orders and diagnostic claims. We licensed a database of medication indications, refined it and merged it with the medication data. We developed an algorithm that triggered for LASA errors based on name similarity, the frequency with which a patient received a medication and whether the medication was justified by a diagnostic claim. We stratified triggers by similarity. Two clinicians reviewed a sample of charts for the presence of a true error, with disagreements resolved by a third reviewer. We computed specificity, positive predictive value (PPV) and yield.
Results The algorithm analysed 488 481 orders and generated 2404 triggers (0.5% rate). Clinicians reviewed 506 cases and confirmed the presence of 61 errors, for an overall PPV of 12.1% (95% CI 10.7% to 13.5%). It was not possible to measure sensitivity or the false-negative rate. The specificity of the algorithm varied as a function of name similarity and whether the intended and dispensed drugs shared the same route of administration.
Conclusion Automated detection of LASA medication errors is feasible and can reveal errors not currently detected by other means. Real-time error detection is not possible with the current system, the main barrier being the real-time availability of accurate diagnostic information. Further development should replicate this analysis in other health systems and on a larger set of medications and should decrease clinician time spent reviewing false-positive triggers by increasing specificity.
- medication safety
- decision support, computerized
- patient safety
- quality improvement
This is an open access article distributed in accordance with the Creative Commons Attribution Non Commercial (CC BY-NC 4.0) license, which permits others to distribute, remix, adapt, build upon this work non-commercially, and license their derivative works on different terms, provided the original work is properly cited, appropriate credit is given, any changes made indicated, and the use is non-commercial. See: http://creativecommons.org/licenses/by-nc/4.0/.
Statistics from Altmetric.com
Introduction
A wrong-drug error occurs if a patient receives one drug when a different drug was intended. Wrong-drug errors are common, costly and harmful.1–4 It is difficult to know precisely how often they occur because, like most medical errors, the majority are not reported. Evidence from several sources suggests the rate is roughly one per thousand prescriptions.2 5 6 One identifiable cause of these errors is similarity between drug names (eg, hydroxyzine/hydralazine, Kapidex (dexlansoprazole)/Casodex (bicalutamide), Bidex (guaifenesin)/Videx (didanosine) etc).7–9 Similarity in packaging can also be a cause, as can being stored adjacent to one another on a pharmacy shelf.10 In computerised physician order entry (CPOE) systems, poor user interface designs can cause a prescriber to pick the wrong drug from among adjacent items on a drop-down menu, and truncation of names in CPOE text fields can lead to errors.11–13 The severity of harm of a wrong-drug error depends on the toxicity of the drug received, the necessity of the drug that the patient did not get, the frailty of the patient, the timing of the discovery of the error and the reversibility of the harm once the error is discovered. Some errors are relatively harmless (eg, lorazepam/alprazolam, Cardene (nicardipine)/Cardizem (diltiazem), fluoxetine/duloxetine). Some cause permanent harm (eg, Durasal (salicylic acid)/Durezol (difluprednate)). Some are potentially fatal (eg, cisplatin/carboplatin, morphine/hydromorphone).14–16
Clinicians and researchers have known about wrong-drug errors for many years, yet it has been difficult to reduce their frequency or to minimise the harm they cause. In 2004, the U.S. Food and Drug Administration (FDA) published a regulation to require that certain human drug and biological product labels contain a bar code consisting of, at a minimum, the National Drug Code number. When bar code scanning is used in every step of the medication use process, it can be effective.17 Certain kinds of clinical decision support alerts also show promise, such as alerting clinicians when the medication they are about to order does not match any problem on the patient’s problem list.6 Other methods have been tried, though with limited evidence as to their effectiveness, including Tall Man lettering,18 19 pre-approval testing of drug names for confusability,20 separate storage for drugs with similar names,21 22 various warnings in CPOE and drug dispensing systems,6 23 24 posted lists of confusing names,25 label and packaging changes,10 26 and exhortations for clinicians to be more careful.27
Wrong-drug errors may happen at any stage of the drug use process, including prescribing, transcribing, dispensing and administration. The present project focuses only on wrong-drug prescribing errors.
Automated detection is a new approach to addressing the risks posed by wrong-drug prescribing errors. The process is to run computer algorithms on electronic health record (EHR) and administrative claims data to identify when a medication order for a given patient does not seem to match with all of the available clinical and demographic information.24 28–31 One approach is to design algorithms to detect a mismatch between a drug’s indications and a patient’s active problems. When a provider orders metformin for a patient who has neither diabetes nor polycystic ovarian syndrome on her problem list, either the problem list is incomplete or the medication was ordered in error. If the patient has bacterial vaginosis on the problem list, the probability of a confusion with metronidazole is increased. In a recently published paper, we showed how an algorithm like this detected a series of confusions between cycloserine and ciclosporin.24 This approach has promise in light of a recent analysis showing that for the majority of pairs of confusing drug names in the Institute for Safe Medication Practices’ (ISMP) list, the two drugs have different indications.32 (ISMP is a medication safety organisation headquartered in the USA.)
We sought to determine how automated look-alike/sound-alike (LASA) detection algorithms perform more generally. The purpose of this study was to evaluate the usefulness (ie, positive predictive value (PPV) and yield) of an automated system for detecting wrong-drug prescribing errors across a large number of medication orders and a large set of possibly confusing drug names. Based on previous research, we hypothesised that the method would detect errors that may have gone undetected by other methods, but it was not clear whether the system would do so with a low enough false-positive rate to make it practically useful as a measurement and a patient safety learning tool.
Methods
Design
This was a retrospective, observational study involving computerised analysis of EHR and administrative claims data to detect possible wrong-drug errors, followed by clinician chart review for validation.
Setting
Part of the University of Illinois at Chicago, UI Health comprises a clinical enterprise that includes a 495-bed tertiary care hospital, 22 outpatient clinics and 13 Federally Qualified Health Centers. UI Health serves a large patient population, with approximately 50 000 emergency room visits, 20 000 hospital admissions and 500 000 clinic visits per year across all sites. The inpatient, ambulatory and emergency department settings use the same commercially available EHR, Cerner Millennium, to house all patient data and enter all medication orders using CPOE.
In addition to generating medication orders and prescriptions, and in order to facilitate medication reconciliation, the CPOE system also documents medications by history, allowing clinicians to record medications in the chart without generating a corresponding prescription or order. UI Health allows several types of clinicians to perform some of the actions of adding, discontinuing, renewing or modifying medication orders within the EHR. Attending and resident physicians perform these actions freely for their patients. Clinical pharmacists and nurses perform these actions either per protocol or by verbal, telephone or written order. In the inpatient setting, the majority of orders are entered by medical residents during the patient’s stay or by a clinical pharmacist or nurse who aids in medication reconciliation. Attending physicians infrequently order medications in the inpatient setting. In the outpatient setting, both attending and resident physicians complete order entry, along with clinical pharmacists and nurses aiding in order modification and prescription refills. Medical students have the authority to enter orders that licensed physicians review before being processed.
Medication order sets exist for various clinical scenarios, and providers are able to select ‘favourites’ so that frequently prescribed medications are easily accessible. Although the system displays medications alphabetically by default, additional features can cause medications to appear near each other even if they are not similar alphabetically. One example is metformin and metronidazole. Though alphabetically these would not be adjacent, in the favourites list of a primary care provider who sees many women and many diabetics, they could be adjacent. Another example would be nimodipine and famotidine. These two medications were on an inpatient neurosurgical order set and were adjacent due to the way that order set arranged drug classes.
Data
Patients, drugs and diagnosis claims
We extracted all patient-level data from the EHR and administrative data systems at UI Health. This included all inpatient medication orders and outpatient prescriptions, over a roughly 8-year period from 1 April 2004 to 31 January 2012: 5 689 707 orders/prescriptions for 197 810 unique patients. Medication data included medical record number, admission and discharge date, gender, race, drug name, order type, order date and time, ordering clinician, dose, frequency, and administration date and time (for inpatient orders). We extracted and combined all diagnostic claims for this same period, including date of service, medical record number and ICD-9 codes.
Drug indications
We licensed the 2012 DrugPoints database from Micromedex (Truven Health Analytics, Ann Arbor, Michigan, USA). This database provides FDA-approved and non–FDA-approved indications for drugs in common use in the USA. The database included brand and generic drug names, therapeutic category, indication, FDA approval status of indication and age group for the indication (adult vs paediatric). Its 10 550 records included 2870 unique indications on 1582 unique products. DrugPoints provided indications as plain text (eg, hypertension, ventricular arrhythmia, dysmenorrhoea, fever and headache).
Administrative claims data at UI Health recorded diagnoses as ICD-9 codes, so we needed to create a map that would link the free-text indications in the DrugPoints database to the ICD-9 codes in the administrative data. The process began by using automated matching to link DrugPoints free text with ICD-9 text descriptors and proceeded through multiple rounds of revision by physician and pharmacist members of the research team who, in addition to creating the indication map, simultaneously checked the indication database for correctness and completeness.
Next, we excluded drugs from the indication database that, according to expert judgement, had too many indications to be useful given our method of error detection. Our method relies on detecting mismatches between a patient’s diagnoses and a drug’s indications. Drugs with many indications (eg, steroids, pain relievers) are poorly suited to this task, whereas drugs with few indications (eg, metformin) are well suited. We also excluded drugs whose indications were rarely documented during this timeframe (eg, docusate for constipation or acetaminophen (paracetamol) for pain), and we removed non-drug supplies such as materials used for drug administration (eg, alcohol swabs, syringes).
Inclusion and exclusion criteria for drug orders during the detection phase
To be included, drugs had to be in the indication database. Of the more than 5.6 million orders, only 3 513 891 (61.8%) involved drugs that were in the indication map. To improve specificity, we excluded drugs prescribed more than once for the same patient, based on the assumption that prescribers are unlikely to refill wrong-drug orders. To be included, patients had to have diagnostic claims (ie, ICD-9 billing codes) on at least seven different days. This 7-day rule increased our confidence that we had sufficient data to determine whether or not a drug was justified by existing diagnoses. After these exclusions, the final data set had 488 481 records (8.6% of all extracted records), comprising 509 drugs for 99 343 unique patients from 10 September 2002 to 13 July 2012. After all exclusions, the main analysis included 14% of the total number of orders and 50% of the unique patients.
Detection algorithm
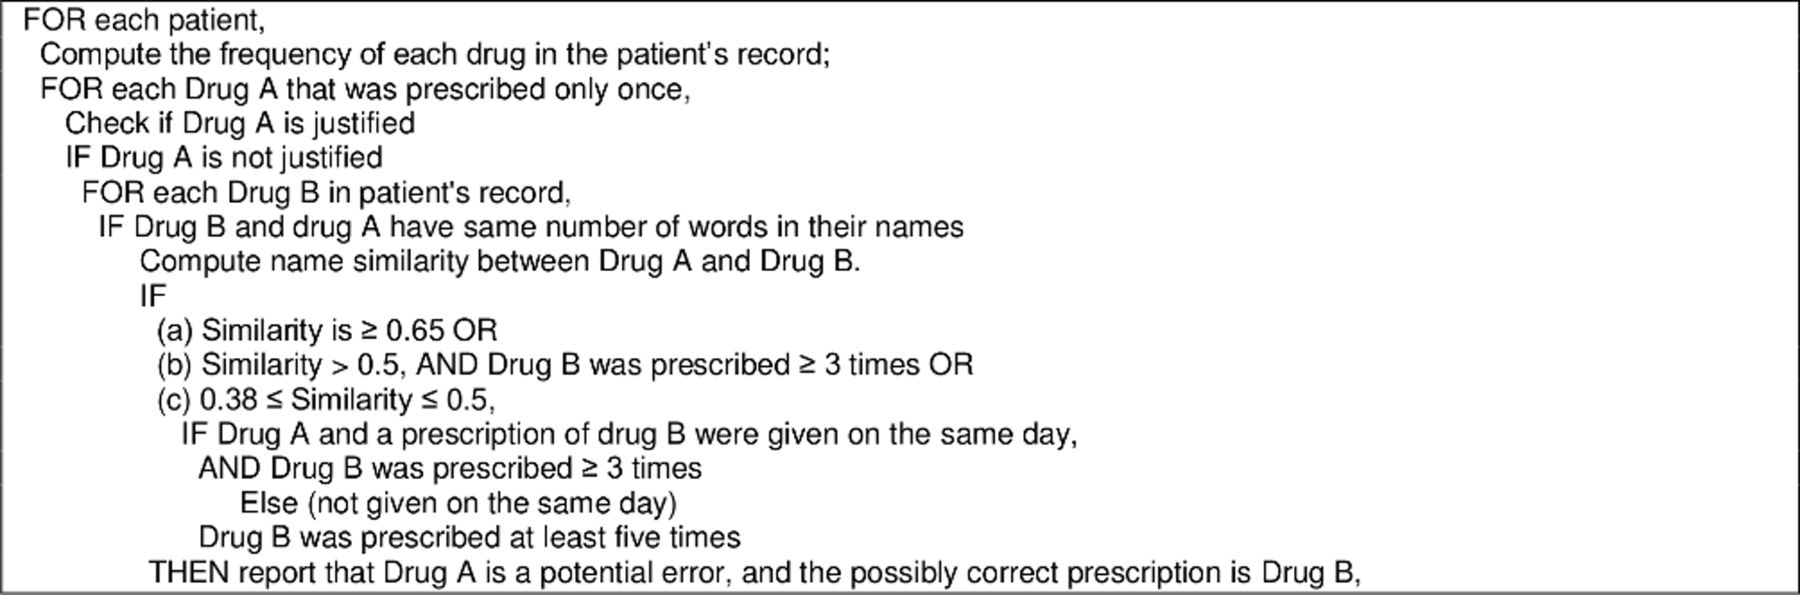
Figure 1 displays the algorithm for error detection. For the purpose of this algorithm, a drug is justified if (1) an indication appears in the patient’s diagnosis record, or (2) a drug with the same indication as the prescribed drug is present in the patient’s medication history. Two drugs (eg, drug A and drug B) were said to have the ‘same’ indication if more than 60% of the indications of drug A are shared with drug B. We computed LASA similarity between drug names as the mean of 10 different similarity measures used in previous research.8 33

Pseudo-code for the error detection algorithm.
Chart review
Two physicians and two clinical pharmacists reviewed charts to validate potential LASA medication ordering errors. Triggered cases were computer generated as described above. Each trigger provided a patient identifier, the name of the ordered medication, including date and time, as well as the name of the drug identified algorithmically as the likely intended medication. Two clinicians, blinded to each other’s evaluations, independently reviewed the patient’s chart to assess whether the prescriber ordered the medication intentionally or whether another LASA medication was likely to have been the intended order.
If chart review did not make it clear whether the order was appropriate, the procedure instructed reviewers to give the benefit of the doubt to the prescriber and conclude that the order was intentional (ie, not in error). If the reviewer disagreed with the medication that the algorithm suggested as the intended drug, they could provide an alternative confused drug name. When the two primary reviewers disagreed, a third clinician adjudicated the disagreement, blinded to their role as an adjudicator. If a reviewer suggested a non–algorithm-generated LASA medication, this was only considered a likely confusion error if the other reviewer suggested precisely the same alternative medication. For each confirmed error, we searched the literature to determine whether the specific error had appeared previously in a published case report and whether it was on the ISMP list of high-alert medications.34
Analysis
We applied the algorithm to the medication order data and generated a set of triggers. Each trigger included the name of an ordered drug and the name of drug that the algorithm identified as the intended drug. For each pair of ordered and intended drugs, we computed a numerical similarity score based on the mean of 10 different similarity scores as described above. We then segmented the triggers into 10 similarity levels that each spanned an equal-sized range of similarity scores. Each range did not contain an equal number of triggers. We conducted manual chart review on each trigger as described above. Where a similarity range contained greater than 50 pairs, we reviewed at least 50 pairs. Where there were fewer than 50 in a range, we reviewed them all. At each level of similarity, we then computed the PPV and the yield of the trigger, along with the SE of proportion for PPV. We defined yield as the PPV times the number of triggered orders in a given similarity range. We timed a small sample of the chart reviews to assess the reviewer burden associated with validating each trigger.
Results
Number of triggers
The algorithm generated 2404 triggers. Clinicians reviewed 506 cases and confirmed the presence of 61 errors, for an overall PPV of 12.1% (SE 1.4%, 95% CI 9.2% to 14.9). Based on two reviewers each timing their review of 22 cases, it took 3.3 min to review each case. In 6.1% of the cases (31 of 506), the primary reviewers disagreed and the adjudicator made the final decision. Nine of the 29 confusing name pairs (31%) had never before appeared in published case reports.
Table 1 shows contains information about total cases, cases reviewed, confirmed errors, PPV and yield.
Similarity, number of confirmed errors, positive predictive value (PPV) and alert yield
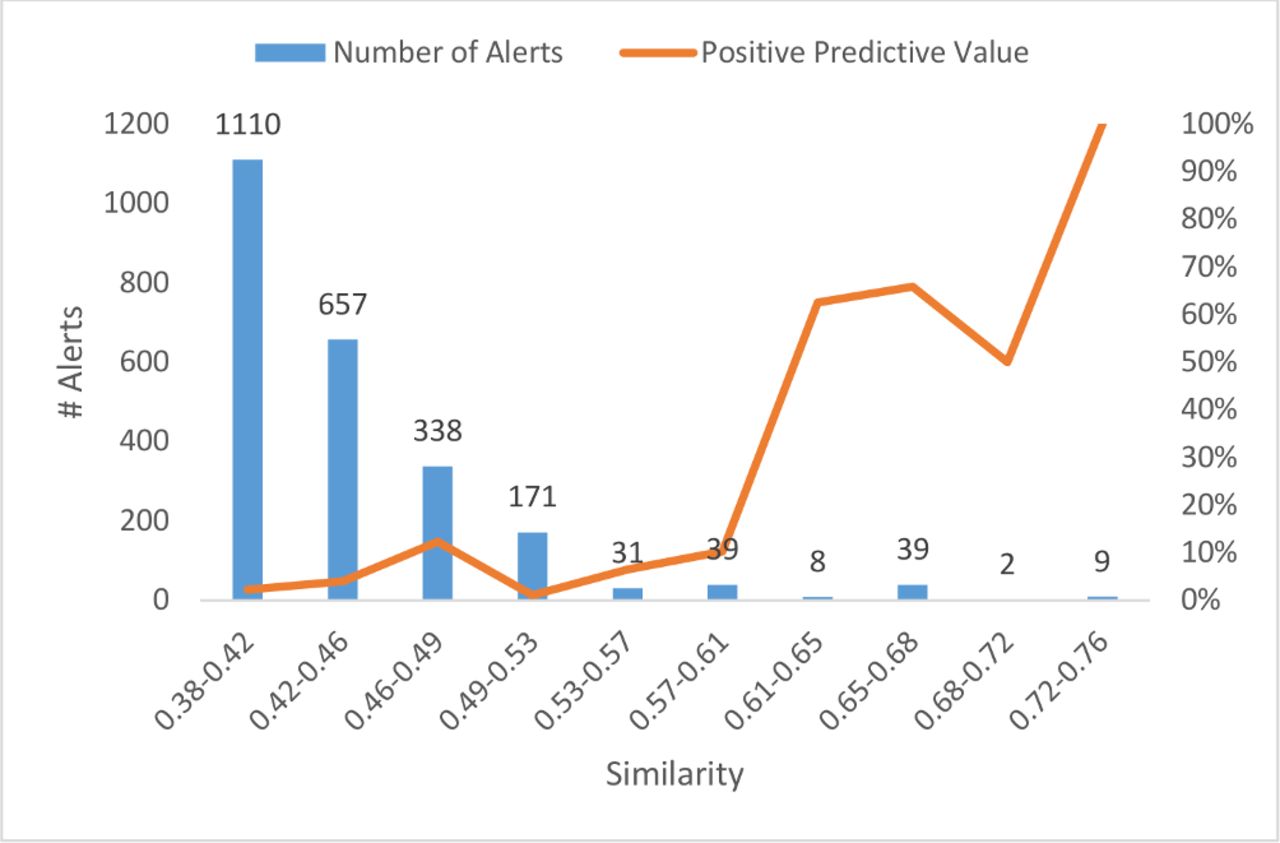
Figure 2 charts the relationship between similarity range and the number of triggers generated by the automated detection algorithm.

Number of alerts and positive predictive value as a function of similarity level.
Table 2 lists all of the true errors, along with their frequency of occurrence and whether or not they were on ISMP’s list of high-alert medications.
Confirmed errors, with suspected intended medication, similarity level and number of occurrences
Post hoc analysis
During the chart review process, reviewers noticed an association between the routes of administration of the drugs thought to be confused and the likelihood of a true error. Specifically, if an ordered drug and a (likely) intended drug did not have matching routes of administration, chart review was unlikely to classify the case as a true error. For instance, the algorithm scores the names timolol and tramadol as similar. The algorithm might generate triggers involving this pair of drugs. However, an order for timolol ophthalmic is unlikely to be confused with tramadol because tramadol is not available as an ophthalmic product.
To test this hypothesis, we coded the 506 reviewed triggers for the presence or absence of a potential route mismatch. We defined a route mismatch as occurring when the suggested medication (ie, the one the algorithm predicted was the intended drug) was not available in the same route of administration as the drug that was actually ordered. For example, as noted above, we coded timolol ophthalmic/tramadol as a pair with a route mismatch.
Table 3 shows results of this analysis. Triggered orders with a route mismatch were not associated with any true errors. Excluding route mismatches from the set of triggered orders reduced the number of charts to review by 27%, thus increasing the PPV of the sample to 16.5% (as compared with 12% without the route mismatch rule).
Effect of route of administration mismatch on positive predictive value
Discussion
An automated detection algorithm identified verified drug name confusion errors that were not self-intercepted and may not have been detected by other means. The PPV was 12.1% using the initial algorithm. Post hoc analysis excluding triggered orders that reflected mismatched routes of administration improved performance to a PPV of 17.0%. With a false-positive rate of over 75%, it is not likely that health systems should use this tool at this time as a quality measurement because this is lower than what systems typically use for medication safety measurement tools.
However, the detection algorithm can be useful as a trigger tool to find wrong-drug errors. These errors are relatively rare (eg, 1 in 1000 orders) and are difficult to find by existing reporting or surveillance methods. Some automated methods now exist to find such errors, but those methods only work for self-intercepted errors.6 23 35 The method described in this paper can find errors that, at least initially, are not intercepted. Using our time estimate of roughly 3 min per chart, it would take a clinician doing safety audits 15–20 min of chart review to find each error (assuming one true error for every 5–6 triggers). Put another way, a clinician should be able to review about 20 triggers per hour and find 3–4 errors. This strikes us as a worthwhile trade-off to detect rare, elusive, but potentially harmful errors.
Our method may pose constraints on the number of triggers yielded. Using the absence of a documented indication as a trigger requires (1) the use of medications that have a manageable number of indications and (2) reliable documentation of these indications in the underlying data source. Because we used professional claims data, the indications of interest had to be present in professional bills. There are many classes of medications that treat indications which are not routinely documented in billing, especially in the inpatient setting, for example, constipation, insomnia, itching, gastro-oesophageal reflux, pain, cramps, headaches and so on. As a result, our detection algorithm will never detect errors involving common medications used for these undocumented indications, for example, diphenhydramine, docusate, proton pump inhibitors and so on.
In addition, when medications (eg, corticosteroids) have a very large number of potential indications, the high likelihood that one of these indications is present in the billing data for a given patient makes its presence relatively uninformative. Other medications falling into this category include commonly ordered pain medications such as acetaminophen (paracetamol), non-steroidal anti-inflammatories and opioids.
The combination of the presumed low base rate of the type of error we were trying to detect and the exclusion of many commonly used medications combine to produce a trigger with relatively low yield. Thus, our finding only 61 errors is not that surprising. Nevertheless, the errors we did find were unlikely to be detected by any other means used today, and we found many pairs of confused medications that had not previously been reported to be confusing, that is, they did not appear on the ISMP list.25 The ability of our algorithm to detect previously unreported errors speaks both to the power of the method and to the limitations of existing mechanisms for surveillance, especially voluntary reporting.
The PPV of the triggers increased as the similarity of the names increases, not surprisingly, since similarity is a known risk factor for LASA errors.8 9 36 But since the drug name lexicon is intentionally designed to have few similar names,37 38 the yield at high similarity levels will be low. As a result, one method to improve the PPV (at the expense of yield) is to focus on higher similarity triggers.
Route mismatch
That triggered orders with route of administration mismatches did not contribute any true positive errors suggests that a protective cognitive process is in force when clinicians select an incorrect medication that does not have the route that they intended to use. The availability of the intended route may enhance situation awareness and produce an increased likelihood of self-interception of the error, thus reducing the likelihood of completed wrong-drug errors involving the wrong drug and the wrong route. We did not design our study to investigate this specific process, and future work will need to evaluate whether our speculative hypothesis about error interception is correct.
With regard to the performance of our detection algorithm, the exclusion of triggered orders that include a route mismatch should improve performance without loss of sensitivity. We could not measure the actual loss of sensitivity because, in our sample, there were no true errors among the triggered orders with mismatching routes, and thus no loss of yield occurred. We recommend this modification of the algorithm in future use.
Another use of this tool is to help find errors that may benefit from CPOE alerts. During the development cycle of our tool, we found confusion between ciclosporin and cycloserine.24 After detecting these errors, we designed a real-time alert to help prevent confusion between these medicines, which mainly involved ordering cycloserine when ciclosporin was intended. As a tertiary medical centre with an active transplant programme, this error may have occurred more often than at a centre with fewer transplant patients, but using our tool can help identify pairs that may be more of a problem locally and serve as the basis for further interventions.
In the future, natural language processing, in combination with machine learning and other artificial intelligence techniques, should improve some performance limitations of our method. It would increase the number of indications available for analysis, particularly those that do not appear in structured billing data but are present in free-text clinical documentation. In addition, indications detected via natural language processing would become available sooner than indications in billing data, allowing for real-time or near real-time alerts, whereas our method cannot function until diagnostic claims appear in billing data. Thus, we would expect that this method could be modified to a higher yield, higher PPV real-time or near real-time tool in the future by integrating natural language processing.
Limitations
This was a retrospective, single-centred study, focusing only on a small subset of medication orders and indications. We excluded many medications, including commonly used ones (eg, analgesics, antibiotics and corticosteroids) that had too many indications to be useful in our system. It was not possible to measure the sensitivity of the detection algorithm because there is no feasible way to identify all true cases of LASA error in the system. We did the study off-line on retrospective data. No information was available about the nature or causes of the errors (other than the general assumption that name confusion caused them). We did not assess the severity of the errors. Error detection, analysis and follow-up should be done in real time or near real time to maximise benefit for patient safety and to enable rapid follow-up with physicians who can shed light on the potential causes of error. We based the thresholds in the algorithm and the exclusion criteria used to narrow down the drug and indication database on expert opinion. We may have missed real errors because we excluded refilled drugs that had indications similar to those that patients received previously. The algorithm requires integration of several data sources (medication orders and administrative claims), and it includes natural language processing code to compute similarities between drug names. These complexities will likely make it harder to reproduce the system at other sites.
Conclusions
Large-scale, automated detection of LASA medication errors is feasible and can detect a modest number of medication errors that were previously undetected by any other method. Both patient safety and quality improvement could benefit from such a system. Further work should replicate the findings in other health systems, improve specificity to decrease clinician time spent reviewing false-positive triggers and increase sensitivity by using natural language processing to detect drug indications from free-text notes.
References
Footnotes
Funding This project was supported by grant number U19HS021093 from the Agency for Healthcare Research and Quality.
Disclaimer The content is solely the responsibility of the authors and does not necessarily represent the official views of the Agency for Healthcare Research and Quality.
Competing interests BLL has an ownership interest in two companies that provide software and consulting services related to the detection and prevention of drug name confusions. BLL’s companies had no role in the conduct of the studies described here.
Patient consent for publication Not required.
Ethics approval The institutional review boards at the participating institutions reviewed and approved of the project.
Provenance and peer review Not commissioned; externally peer reviewed.
Data availability statement All data relevant to the study are included in the article or uploaded as online supplementary information.