Article Text

Abstract
Background In eligible patients with acute ischaemic stroke, rapid revascularisation is crucial for good outcome. At our treatment centre, we had achieved and sustained a median door-to-needle time of under 30 min. We hypothesised that further improvement could be achieved through implementing a revised treatment protocol and in situ simulation-based team training sessions. This report describes a quality improvement project aiming to reduce door-to-needle times in stroke thrombolysis.
Methods All members of the acute stroke treatment team were surveyed to tailor the interventions to local conditions. Through a review of responses and available literature, the improvement team suggested changes to streamline the protocol and designed in situ simulation-based team training sessions. Implementation of interventions started in February 2017. We completed 14 simulation sessions from February to June 2017 and an additional 12 sessions from November 2017 to March 2018. Applying Kirkpatrick’s four-level training evaluation model, participant reactions, clinical behaviour and patient outcomes were measured. Statistical process control charts were used to demonstrate changes in treatment times and patient outcomes.
Results A total of 650 consecutive patients, including a 3-year baseline, treated with intravenous thrombolysis were assessed. Median door to needle times were significantly reduced from 27 to 13 min and remained consistent after 13 months. Risk-adjusted cumulative sum charts indicate a reduced proportion of patients deceased or bedridden after 90 days. There was no significant change in balancing measures (stroke mimics, fatal intracranial haemorrhage and prehospital times).
Conclusions Implementing a revised treatment protocol in combination with in situ simulation-based team training sessions for stroke thrombolysis was followed by a considerable reduction in door-to-needle times and improved patient outcomes. Additional work is needed to assess sustainability and generalisability of the interventions.
- simulation
- quality improvement methodologies
- medical emergency team
- team training
Statistics from Altmetric.com
Introduction
Stroke is one of the leading causes of morbidity and mortality worldwide.1 In eligible patients with acute ischaemic stroke, intravenous thrombolysis alone or in combination with endovascular treatment is the current gold standard treatment. Clinical outcomes of therapy, however, are highly time dependent.2–5 At our treatment centre, Stavanger University Hospital, we have systematically worked towards reducing the time from arrival at the emergency room to start of thrombolysis administration (the so-called door-to-needle time (DNT)) since 2009.6 From 2014 onwards, we achieved a sustained median DNT of less than 30 min. This is well within Norwegian national target recommendations, but still omits many of our patients from treatment within the most beneficial time-window.7–9 This necessitates further reductions in DNT. Several authors have described methods to reduce treatment times through streamlining in-hospital treatment protocols.10–12 We hypothesised that streamlining protocols could contribute to further reductions in DNT at our centre.
Simulation-based team training can improve team performance through improving non-technical skills (eg, communication, teamwork and leadership).13 Improvement in simulated performance, and to some extent in clinical behaviour and patient outcomes, has been shown for several medical emergencies including acute ischaemic stroke.14–16 In a recent article regarding simulation training in acute stroke, human factors in the stroke team is suggested as the most important rate-limiting factor in acute stroke care.17 Simulation training directed at improving healthcare systems and patient care, so-called translational simulation, is particularly useful as part of quality improvement (QI) projects because of its potential both for diagnosing system performance and delivering simulation-based interventions.18 We thus hypothesised that sessions of simulation-based team training, as part of a QI project, could reduce DNT through the following mechanisms: (1) simulation-based interventions targeted at teaching the revised treatment protocol could ease the process of implementation (eg, adherence to the revised protocol) and (2) improvements in specific team non-technical skills could lead to more efficient teams providing further reductions in DNT.
To tailor interventions to local conditions, all members of the acute stroke treatment team at our hospital were surveyed prior to implementation. Direct patient transport to the CT lab and the on-call neurology registrars leadership skills were identified as potential areas of improvement. These identified areas of improvement strengthened our belief that protocol revision and simulation training would be the right tools to reduce DNT. This report describes a QI project, implemented from February 2017 at our treatment centre, aiming to reduce DNT in order to improve patient outcomes.
Methods
Context
Catchment area
Stavanger University Hospital is one of the largest stroke centres in Norway serving a population of 365 000 within Rogaland county. Approximately, 200 000 live in urban areas. Stavanger University Hospital admits close to 450 patients with acute ischaemic stroke annually, of these approximately 25%–30% receive intravenous thrombolysis.
Thrombolysis registry
All consecutive patients with a suspected acute ischaemic stroke having received intravenous thrombolysis are prospectively included in our local thrombolysis registry. The registry contains multiple variables including: Patient demographics, cerebrovascular risk factors, National Institutes of Health Stroke Scale on admission and discharge, stroke mimics (proportion of patients receiving thrombolysis that were discharged with a non-stroke diagnosis), in-hospital mortality and modified Rankin Scale (mRS) at baseline and 3 months poststroke. All relevant time points, including symptom onset, arrival at the emergency room and time of intravenous thrombolysis administration are registered. Data are collected using a form that is filled in by both stroke nurses and neurology registrars for all stroke patients in addition to the patients’ electronic medical record. Data collection and registration is overseen by a dedicated stroke research nurse.
Pre-existing treatment protocol
Patients with suspected acute ischaemic stroke are usually admitted directly to the emergency room for assessment by a round-the-clock on-call stroke treatment team (neurology registrar, two emergency room nurses, two radiographers, radiologist and phlebotomist). Procedures prior to intravenous thrombolysis administration include: National Institutes of Health Stroke Scale scoring, measurement of vital signs, peripheral venous cannulation, collection of blood samples and a non-enhanced head CT scan. After contraindications (ie, haemorrhagic stroke) are excluded, the intravenous thrombolysis is administered in the CT lab. After intravenous thrombolysis bolus-dose administration, CT angiography and perfusion scanning is performed to reveal any potential large vessel occlusions and evaluate penumbra (ie, a rim of ischaemic tissue lying between tissue that is normally perfused and the area in which infarction is evolving). After initial treatment, the patients are moved to a neuro-intensive care unit for clinical follow-up. Clinically stable patients without significant intracranial haemorrhage on a follow-up non-enhanced head-CT scan, 12–24 hours after intravenous thrombolysis, are transferred to a specialised stroke ward for diagnostics and rehabilitation. The pre-existing treatment protocol is described in greater detail in an earlier publication.6
Readiness for QI
The QI team discussed contextual factors that might affect the chance for successful implementation using the model for understanding success in quality (MUSIQ) framework .19 The total score on the MUSIQ calculator was 113 out of 168 translating to ‘Project could be successful, but possible contextual barriers’. We identified several potentially important facilitating factors. First, previous efforts to reduce DNT at our centre had focused on communicating the importance of timely stroke treatment. Second, the QI team includes members representing all professions involved in acute stroke treatment including authorities on the system being changed. Third, the thrombolysis registry in our centre had all the necessary data for this project. We can thus assume that contextual factors eased the process of getting buy-in and pulling the data needed for planning and assessing the impact of the interventions. Furthermore, in situ simulation-based training is common for other medical emergencies at our hospital (trauma, critically ill patients and cardiopulmonary resuscitation). Simulation training for stroke had not previously been applied, but a culture for simulation-based learning at our hospital might have been advantageous with regard to participants buying-in to and learning from simulation-based interventions. With regard to contextual barriers, the most important factors were adequate financial support and time to plan and implement the interventions. None of the members of the QI team had protected time for improvement work. With protected time for improvement work, we can assume that planning and implementing the interventions would have been less demanding for the team increasing the chance for success.
Interventions
Survey prior to implementing interventions
Stroke team members were surveyed through an anonymous online questionnaire (SurveyMonkey) sent via email. The survey contained two questions: (1) ‘can you suggest any improvements that would reduce the in-hospital time to treatment for stroke patients eligible for thrombolysis? (Reducing door-to-needle time)’ and (2) ‘can you suggest changes to the way the stroke team members interact that could lead to more efficient treatment?’. One hundred fifty-eight members responded to the survey. The QI team reviewed responses in a two-step process: (1) Quantitatively: counting the most frequently mentioned words and displaying these in a word cloud as the basis for further discussion. ‘CT’ and ‘Neurologist’ were the two most frequently mentioned responses to the first and second question, respectively (the neurology registrar is commonly referred to as ‘Neurologist’ in the emergency room). (2) Qualitatively: reading the responses in which these words were mentioned. Responders that had used the word ‘CT’ frequently commented that transporting the patient directly to the CT lab (as opposed to the emergency room first) would reduce DNT. Responders that had used the word ‘Neurologist’ commented on a lack of leadership skills. Specifically, suggestions that neurology registrars should be more ‘visible’ as team leaders and ‘share their thoughts’ were frequently mentioned. In a review of the remaining posts, several responders had mentioned the lack of clearly defined responsibilities for the different professions in the stroke team. Using this information along with a review of existing literature, the QI team suggested relevant changes to streamline the treatment protocol. Furthermore, we added learning objectives to the in situ simulation-based training sessions specifically for neurology registrars to address the issues raised in the survey.
Revised treatment protocol
The following changes were made to the treatment protocol: prenotification of the in-hospital stroke treatment team through a dedicated ‘stroke thrombolysis’ alarm, patient preparation during transport, direct transport to CT lab, delaying collection of blood samples to after intravenous thrombolysis administration whenever a decision regarding thrombolysis did not depend on the results (eg, patients not on anticoagulants), patient examination and administration of intravenous thrombolysis bolus dose in the CT lab. Patient preparation during transport comprised the following: focusing on important factors for in-hospital decision-making in the medical history (anticoagulant use, symptom onset, weight), peripheral venous cannulation, measuring blood pressure and removing all jewellery. The revised treatment protocol was presented as a flowchart (online supplementary material 1) with clearly defined assignments for each of the different professions in the stroke treatment team. The assignments are processed in parallel rather than sequentially (‘pit crew’ approach). The revised protocol and the rationale for the suggested changes, including word clouds from the initial survey, were communicated to all stroke team professions through meetings with each group the month prior to implementation.
Supplemental material
Simulation training
We planned two clusters of in situ simulation-based team training sessions using acute stroke scenarios simulating the in-hospital stroke care pathway from door to needle. The planned frequency was one session each week for 4 months with a 4-month pause between clusters, starting February 2017. All in-hospital stroke treatment team members and paramedics on-call the day of the session participated. The frequency of sessions allowed most members within each profession to attend at least one session per cluster. We collaborated with the local stroke patient organisation for patient participation in scenarios, thus patients with previous stroke acted as simulated patients. The key learning objectives were adherence to the revised protocol and specific non-technical skills we believed would improve team efficiency and address the neurology registrars leadership skills (ie, neurology registrars wearing team leader vests for better ‘visibility’ and ‘sharing their thoughts’ through team ‘briefs’ and ‘timeouts’). Additionally, participants were instructed to be aware of potential areas of improvement within their role and report these in the form used to assess participant reactions after simulation sessions. The QI team met regularly during the implementation phase to discuss and potentially act on feedback. With the purpose of further research in mind, all sessions were videotaped by a facilitator using a head mounted GoPro Hero 5 camera. Details of the sessions according to table 3 in the ‘Reporting guidelines for healthcare simulation research’ are given online supplemental material 2.20
Supplemental material
The QI team
The QI team was led by a neurology registrar, a senior consultant stroke physician and a consultant radiologist. The group leading the team had formal facilitator training and led the simulation scenarios. In addition, the team consisted of a paramedic, interventional radiologist, consultant neuroradiologist, two emergency room nurses and a radiographer.
Measures
Outcome measures
We used Kirkpatrick’s four-level training evaluation model to assess the interventions on a four level scale from participant reactions to patient outcome.21 Simulation training sessions were videotaped with assessment of simulated performance (level 2) in mind. Assessment of improvements in adherence to protocol or non-technical skills optimally requires participation of the same team members over several consecutive sessions. This requires data from more than the two clusters described here and simulated performance will thus be assessed in a future analysis.
Participant reactions (level 1) were assessed using anonymous online electronic questionnaires (SurveyMonkey) distributed via text to all participants during debrief. Participants were encouraged to reply immediately after the sessions. All participants, including simulated patients, were asked the following two questions: (1) ‘Was this simulation session useful to you? Rate your response from 0 (not at all useful) to 10 (very useful)’ and (2) ‘Did you succeed in treating the simulated patient? Rate your response on a scale from 0 (not successful) to 10 (perfect)’. Median scores for responses on questionnaires were reported.
Clinical behavioural change (level 3) was assessed by measuring treatment times for all consecutive patients receiving intravenous thrombolysis for a suspected acute ischaemic stroke. Our primary outcome measure was DNT. Any effort to reduce the treatment time for parts of the process that does not result in a reduction in the symptom onset-to-treatment time cannot be expected to improve patient outcomes. We therefore also reported the onset-to-treatment time. Differences in out-of-hours treatments might affect the impact of the interventions. We thus report the proportion of patients treated out-of-hours preintervention and postintervention. ‘Out-of-hours’ was defined as admission during weekends, national holidays or outside 08:00–16:00 on weekdays.
Patient outcome (level 4) was assessed by measuring degree of functional dependence and mortality using the mRS outcome 90 days after stroke onset. We analysed several dichotomisations of mRS. ‘Excellent’ outcome was defined as a score of 0 or 1 (either no symptoms or symptoms without significant disability) and ‘Good’ outcome as a score of 0–2 (functional independence). Additionally, we defined ‘Worst’ outcome as a score of 5–6 (bedridden or dead). By collapsing mRS outcome 5 and 6 into one category any improvement from dead to bedridden is neglected. Patients and caregivers on average do not consider a mRS outcome of 5 as better than 6 (some even consider a score of 5 as worse); thus, from a patient perspective, collapsing these categories makes sense.22 Furthermore, we assessed the proportion of patients with no symptoms and all-cause mortality 90 days poststroke.
In order to account for potential bias from patient-related factors both on treatment times and patient outcomes, we compared baseline characteristics (prestroke function, stroke severity, hypertension, atrial fibrillation, diabetes, previous stroke and smoking status) in the group of patients treated preintervention and postintervention. Patients with stroke onset in-hospital and missing data (time points, functional score or mortality) were excluded. Stroke mimics were excluded from the patient outcome measures. An overview of the outcome measures is provided in table 1.
Kirkpatrick levels and outcome measures
Balancing measures
The percentage of stroke mimics and fatal intracranial haemorrhage were included as balancing measures. To monitor if an emphasis on prehospital patient preparation in the revised protocol could result in increased prehospital times (time from emergency medical services contact to hospital arrival), we also included prehospital times as a balancing measure.
Analysis
We used Statistical Process Control charts as the primary means of analysis. We defined the ‘implementation phase’ as the first 6 months after start of the interventions. To assess whether significant change occurred during implementation, DNT times for consecutive patients treated in the implementation phase were compared with a 4-month baseline on an I-chart. To assess sustainability, monthly mean DNT were analysed on an X-bar chart compared with a 2-year baseline. We used established rules for detecting special causes.23 For comparability with existing studies, we presented data for DNT preintervention and postintervention as a median with IQR.
For patient outcome measures, we used risk-adjusted cumulative sum (CUSUM) charts, based on logistic regression models, to assess changes in proportions of patients within the different predefined categories of patient outcomes postintervention.24 The risk adjusted model included age, National Institute of Health Stroke Scale at admission and prestroke mRS. The parameters of the CUSUM chart were estimated from baseline data. The signal limits were calculated so that with no change from baseline there would be, on average, one false alarm per 500 procedures (ie, an average run length of 500). Both naive signal limits and signal limits including estimation error were calculated.25 26 Whenever CUSUM charts indicated improvement, we added variable life adjusted display (VLAD) charts to give an impression of the impact.27 For these variables, to compare the effect with results from existing studies (commonly using odds ratios as effect sizes), we also present proportions preintervention and postintervention with adjusted ORs and p values derived from a binary logistic regression model.
Onset-to-treatment time and balancing measures (stroke mimics, fatal intracranial haemorrhage and prehospital times) were analysed preintervention and postintervention. A one-way analysis of variance test was used to compare groups with continuous data. Equality of variances was assessed using Levene’s test. Welch’s analysis of variance was used whenever the assumption of homogenous variances was violated. Pearson χ2 was used to compare proportions. Statistical significance was set at p<0.05 (two-sided). The calculations were performed using IBM SPSS Statistics V.24.0.0.1, R V.3.5.3 including the R package ‘spcadjust’ and QI-Macros for Excel V.2019.04.26 28
Results
Evolution of the interventions
During the implementation phase, changes were made to the interventions as a result of feedback from participants in simulation-training sessions. First, some patients admitted through the new ‘stroke thrombolysis alarm’ had findings on arrival that immediately reduced the suspicion of a stroke diagnosis (eg, fever and confusion interpreted as aphasia). For most of these patients, a head CT scan is not warranted. To not waste time moving these patients from the stretcher to the CT lab and back we changed the procedure so that patients with unclear symptoms were received outside the entrance of the CT lab. If the stroke team still suspected a stroke after a quick examination, they continued following the revised treatment protocol. Second, as a result of the ‘pit-crew’ approach, some of the simulated patients reported that arriving at the emergency room with a whole team performing parallel assignments (eg, blood pressure and intravenous needle while performing a physical examination) felt overwhelming. The simulated patients suggested that this might feel less overwhelming if the paramedics explained what to expect in the emergency room during prehospital transport. Third, simulated patients suggested a more careful explanation of findings and suspected diagnosis before administration of intravenous thrombolysis. The suggestion was to use the 1 to 2 min time window, while the bolus was being titrated prior to administration to give this information. The above changes were implemented in an updated revised treatment protocol.
Simulated performance
Participant reactions (Kirkpatrick level 1)
We completed 14 in situ simulation-based team training sessions from February to June 2017 and an additional 12 sessions from November 2017 to March 2018. A total of six sessions were cancelled, all due to patients who had real stroke arriving concurrently. Each of the 12 neurology residents and most members of the remaining professions had participated in at least one session. In total, 118 responses of about 210 participants from 26 sessions were analysed with regard to self-perceived usefulness and treatment success. Self-perceived usefulness received a median score of 9 (IQR 8–10). Self-perceived treatment success received a median score of 8 (IQR 7–9).
Clinical performance
Time intervals (Kirkpatrick level 3)
From January 2014 to March 2018, 650 patients who had acute ischaemic stroke were treated with intravenous thrombolysis at Stavanger University Hospital. Of these, 446 patients were treated preintervention from January 2014 to January 2017 and 204 postintervention from February 2017 to March 2018. A total of 61 patients were excluded due to in-hospital onset or missing data (figure 1). There was no significant difference between patients treated preintervention and postintervention with regard to National Institutes of Health Stroke Scale at admission, prestroke mRS, age, out-of-hours admission and ischaemic stroke risk factors (table 2).
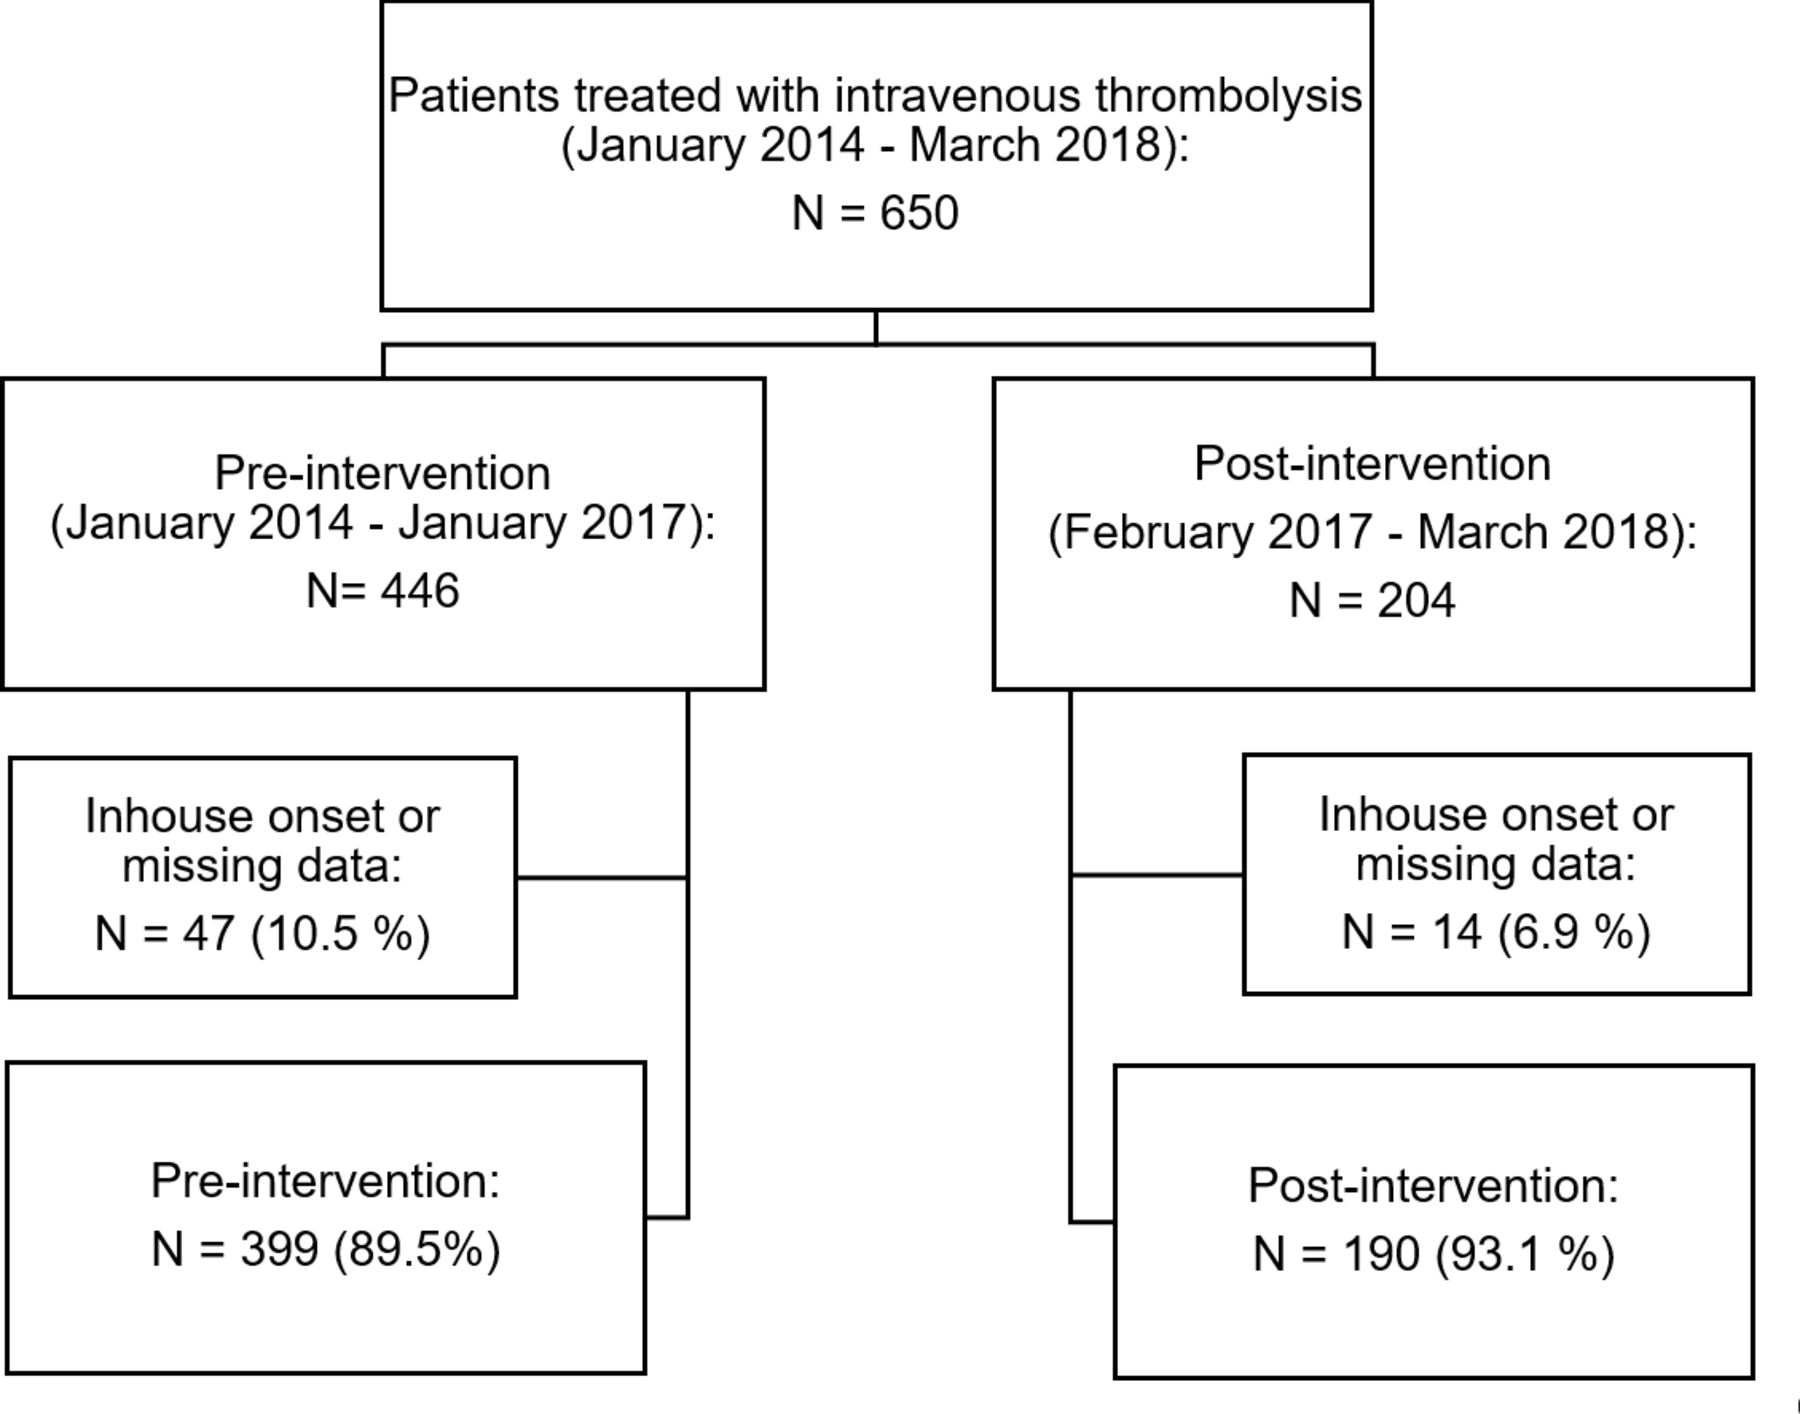
Overview of patients included.
Baseline characteristics
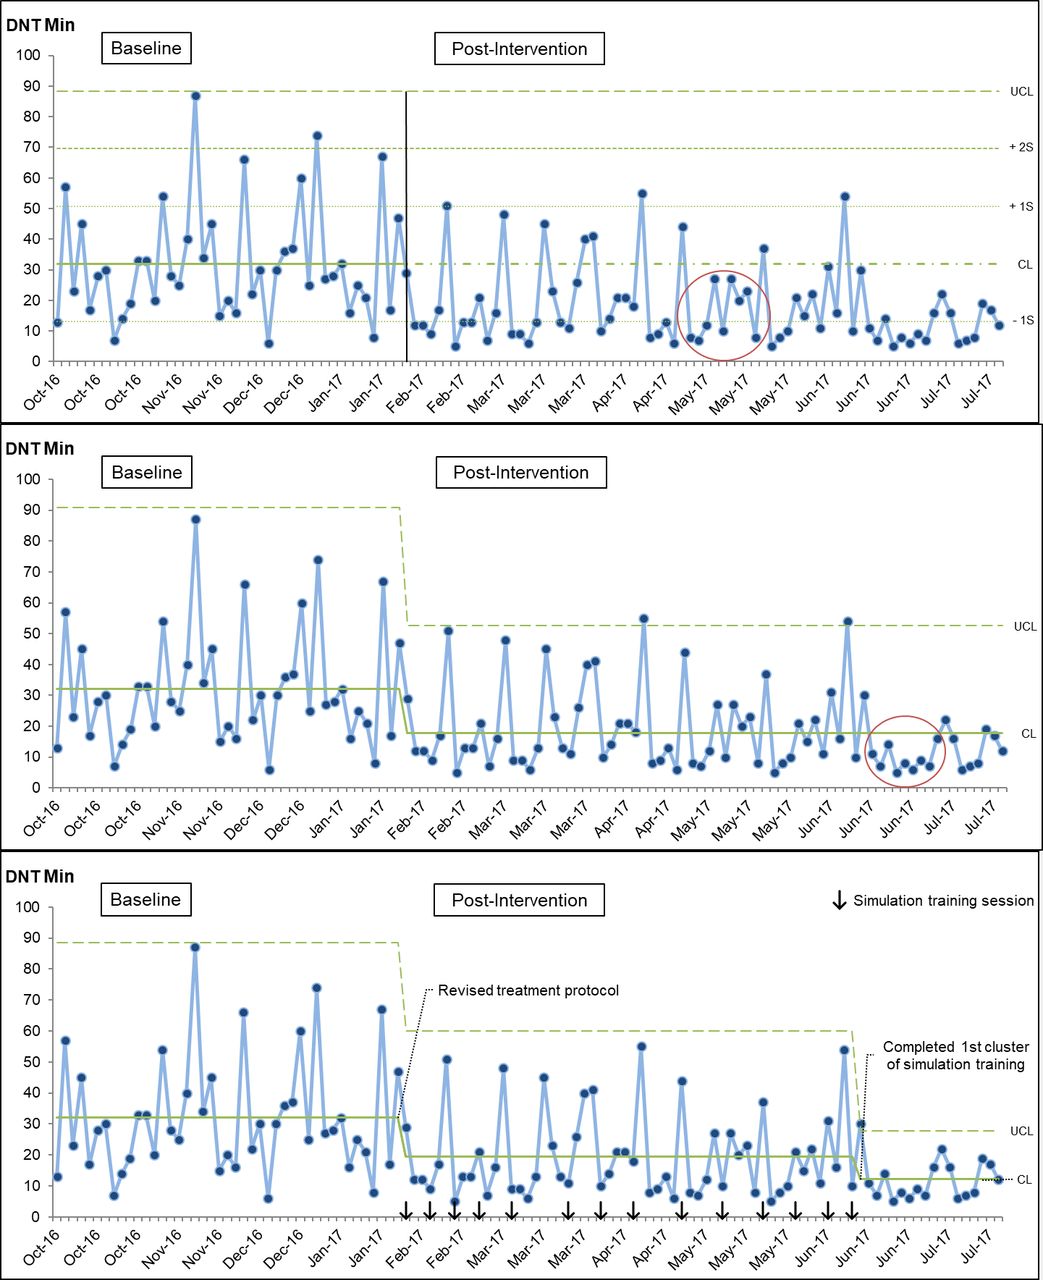
During the implementation phase, the I-chart indicated a shift towards lower DNT around 3 months postintervention. After revising control limits for this phase, a second shift is evident at the end of the implementation phase. A second recalculation of limits was done and revealed a gradual reduction in treatment times and variability throughout the implementation phase (figure 2). The X-bar chart shows an immediate shift and sustained reduction of monthly mean DNT 13 months postintervention (figure 3). Median DNT was reduced from 27 min (IQR 19–41) preintervention to 13 min (IQR 9–23) postintervention. This translated to a symptom onset to treatment time reduction from 110 (IQR 77–168) to 96 (IQR 68–146) min. The results remained significant regardless of admission time (out of hours).

‘Implementation phase’: I-chart: individual DNT 6 months postintervention. Top: control and sigma lines extended from baseline and first special cause encircled. Middle: recalculated limits and special cause within the implementation phase. Bottom: recalculated limits and timing of the interventions annotated.CL, centre line; DNT, door-to-needle times; S, sigma; UCl, upper control limit.

'Sustainability assessment’ Xbar chart: monthly average DNT 13 months postintervention. Top: extended control limits and central line postintervention. Bottom: recalculated limits and timing of simulation training clusters shown. CL, centre line; DNT, door-to-needle times; LCL, lower control limit; UCL, upper control limit.
Patient outcome (Kirkpatrick level 4)
For 90-day mRS scores, stroke mimics and missing data (n=80 preintervention, n=49 postintervention) were excluded from the cohort described in figure 1. Missing data was mostly due to incomplete registration on discharge or patients lost to follow-up at 90 days. The risk-adjusted CUSUM chart for patients with no symptoms shows a signal of improvement June–November 2017 (online supplemental material 3: chart A). This is followed by a deterioration from December 2017 to February 2018. The associated VLAD plot shows that throughout the postintervention period approximately two more patients in our cohort had no symptoms rather than any other outcome on the mRS 90 days poststroke compared with if baseline performance had continued (online supplemental material 3: chart B). Risk-adjusted CUSUM charts gave no signal of improvement with regards to patients with ‘Excellent’ or ‘Good’ outcome 90 days poststroke (online supplemental material 3: chart C-D). The risk adjusted CUSUM chart for patients with a ‘worst’ outcome shows a signal of improvement starting April 17 throughout the postintervention period (online supplemental material 3: chart E). The associated VLAD plot indicates that approximately eight patients in our cohort avoided a ‘worst’ outcome compared with if baseline performance had continued (online supplemental material 3: chart F). The risk-adjusted CUSUM chart for 90-day mortality assumes a similar pattern of improvement (online supplemental material 3: chart G). The associated VLAD plot (online supplemental material 3: chart H), translates to six excess survivors postintervention.
Supplemental material
Considering the possibility of estimation error, only the signal of improvement with regard to patients with a ‘worst’ outcome crosses the estimation error limit (online supplemental material 3: chart E). The adjusted ORs and corresponding p values are shown for all patient outcome measures in which CUSUM charts showed a signal of improvement (table 3). A visual representation of the mRS scores with the count and proportion of patients within all outcome categories preintervention and postintervention is shown in figure 4.
Patient outcome measures with a signal of improvement on risk-adjusted CUSUM charts

Distribution of modified Rankin scale scores* at 90 days preintervention and postintervention. *Scores range from no symptoms (0) to death (6). 1=no clinically significant disability, 2=slight disability (patient isunable to carry out all previous activities but is able to look after own affairs without assistance), 3=moderate disability (patient requires some help but can walk unassisted), 4=moderately severe disability (patient is unable to walk unassisted and requires assistance to attend to bodily needs) and 5=severe disability (patient requires constant nursing care and attention).
Balancing measures
Median prehospital time was 38 min (IQR 27–54) preintervention and 37 min (IQR 25–50) postintervention (p=0.200). The proportion of stroke mimics was 14.3% (n=57) preintervention and 17.9% (n=34) postintervention (p=0.257). Prevalence of fatal intracranial haemorrhage was 1.5% (n=6) preintervention and 0.5% (n=1) postintervention (p=0.306). There were no statistically significant changes in any of the balancing measures.
Discussion
We achieved a significant and sustained reduction in median door-to-needle times for stroke thrombolysis from 27 to 13 min after introducing clusters of in-situ simulation-based team training sessions in combination with a revised treatment protocol. The proportion of deceased or bedridden patients at 90 days was reduced from 12.2% preintervention to 3.5% postintervention. There were no significant changes in balancing measures.
We assessed the interventions using Kirkpatrick’s training evaluation model and the presented results reflect participant reactions (level 1), clinical behavioural change (level 3) and patient outcomes (level 4). Participant reactions were very positive. This might indicate that we managed to create an environment in the simulation sessions that favours learning, but whether learning has occurred requires assessment on higher levels. The primary aim of this study was to produce clinical behavioural change reducing DNT. The figure 2 illustrates changes in DNT relative to the interventions in the implementation phase. Reductions in both DNT and variation occurred gradually with two shifts occurring throughout the implementation phase on the I-chart. A possible explanation for this pattern is an immediate reduction attributable to implementing the revised treatment protocol and a further contribution of simulation training sessions with a more pronounced effect as larger proportions of stroke team members attended at least one session. These findings support our hypothesis that the combination of a revised treatment protocol and simulation training would reduce DNT. The sustained and pronounced effects over time (figure 3) indicate lasting clinical behavioural change due to the interventions.
Both the degree and the timing of DNT reductions surpassed our expectations. This might be partly due to contextual factors at our centre. In our opinion, previous improvement efforts were among the most important factors. Most stakeholders were familiar with the importance of time in stroke thrombolysis and thus creating a sense of urgency and getting ‘buy-in’ might have been easier. Another important factor was having all the stroke team professions represented in the QI team. We feel that this increased ownership within the different professions. Increased ownership might have improved the chance of all professions within the stroke team adhering to the revised protocol. These factors might have contributed both to the degree and the speed with which we achieved DNT reductions.
Several of the patient outcome measures (level 4) pointed towards improved outcomes. The proportion of patients with no symptoms increased from 32.9% to 38.3% postintervention and a signal of improvement was detected during the postintervention period from June to November 2017 (online supplemental material 3: chart A). However, to relate this to the interventions, we would expect some covariation between low DNTs and improved patient outcomes. This is largely lacking, even though variation in patient-related factors (ie, stroke severity) might blur covariation, a causal relationship cannot be inferred from Chart A (online supplemental material 3). The proportion of patients with ‘worst’ outcome decreased from 12.2%–3.5% and a signal of improvement is evident; starting around April 2017 continuing throughout the postintervention period (online supplemental material 3: chart E). Here, the period of improved performance seems to be closely related to low DNTs and thus a causal relationship between interventions and improvement seems more likely. The all-cause mortality at 90 days assumes a similar pattern (not surprisingly as this group of patients largely overlaps with the former) with an evident signal of improvement (online supplemental material 3: chart F) and an overall reduction from 9.1% to 3.5%. As the ‘worst’ outcome is the only special cause crossing the estimation error line, estimation error as a reason for special cause cannot be ruled out for the other patient outcome measures. Overall, the analysis of patient outcome measures indicate that improvement occurred primarily towards the higher end of the 90-day mRS. This is also apparent from the distribution of mRS scores preintervention and postintervention in figure 4.
Given the mild stroke severity in this cohort, we would expect potential changes to occur primarily in the lower end of mRS scores. However, the changes seen in the higher end are supported by findings in a study that estimated the effects on patient outcome of ‘Ultra-Early’ thrombolysis (onset to treatment below 70 min).7 This study found significantly reduced mortality for patients treated ‘Ultra Early’. The effect of time on patient outcomes was most pronounced for moderate and severe strokes. Patients with moderate and severe stroke typically make up the population towards the higher mRS scores (people rarely die or become bedridden from less severe strokes). If the effect of shortened treatment time is most pronounced for moderate and severe strokes in our cohort, it could explain the results presented here. Another possible contribution might be a reduction in the risk of intracranial haemorrhage (typically associated with adverse outcomes) due to lower DNT.29 Causality between the interventions and improved patient outcomes is theoretically plausible as other studies show that even smaller reductions in treatment times resulted in improved patient outcomes.30 In a large Finnish and Australian cohort, a 15 min reduction in DNT resulted on average in one extra month of disability-free life.31 Consequently, there is reason to believe that the reductions in DNT presented here might have led to better patient outcomes.
The protocol changes described in this paper have been described in other DNT improvement efforts.10 11 An important difference between this QI project and several others is the additional use of simulation-based training. Combining simulation training and building on the works of others, we were able to achieve lower median DNT than those demonstrated with protocol changes alone.6 11 32 We experienced several relevant advantages of simulation-based team training sessions. First, we were able to use the sessions to address specific issues proposed by participants in our initial survey (ie, the neurology registrars leadership skills). Second, inviting simulated patients that had a previous stroke proved a useful method of patient involvement. Some of the tasks in the revised treatment protocol are directly attributable to feedback from simulated patients. This can be considered a method of co-production and thus a useful opportunity for empowering patients.33 Third, we found simulation training helpful as a means of further revising and implementing the new protocol. A potential pitfall in introducing a new treatment protocol is the lack of adherence in clinical practice. A multifaceted approach including educational programmes, in our case simulation training, has been shown to increase adherence to protocol in similar acute medical settings.34
Our study has several limitations. First, this is a single-centre study and unknown factors beyond the contextual factors discussed above might limit generalisability. Second, inferences regarding cause and effect, particularly for patient outcome measures, will be limited by the pre–post study design due to confounding by secular trends or other confounding factors we might have been unable to adjust for (ie, concurrent improvement in treatment of vascular risk-factors like hypertension reducing mortality). Third, due to a low response rate on the survey used to assess participant reactions, we cannot rule out non-response bias. Fourth, we hypothesised that simulation-based training could reduce DNT through improving specific team non-technical skills producing more efficient teams. Whether this is truly the mechanism for DNT reduction cannot be fully tested without a video-review of simulated treatments, or optimally video-review of real patient encounters. Thus, the lack of assessment of simulated performance (level 2) is a limitation with regard to understanding the role of simulation-based training in this study. Finally, we implemented the interventions concurrently rather than testing the effects of each intervention in a controlled setting. We can thus conclude that combining protocol change and simulation-based training influenced treatment times, but we cannot infer whether protocol change, or simulation training alone would have produced similar results. In our experience, however, doing one without the other would have meant either simulating an inefficient treatment protocol or inefficiently implementing an efficient one. In our opinion, the combination of protocol changes and simulation-based training eased the process of clinical implementation producing behavioural changes.
Conclusion
Implementing a revised treatment protocol in combination with in situ simulation-based team training sessions was followed by a considerable and sustained reduction of median DNT and improved patient outcomes. In addition to confirming the effects of several known time-saving interventions, this work describes the methodology of planning, implementing and measuring the effects of a simulation-based training intervention in stroke thrombolysis. Furthermore, we have shown that even for centres with low baseline DNT, additional meaningful and safe reductions in treatment times might be feasible. Further work is needed to understand the mechanism through which simulation training sessions might have worked and to measure the effects of repeated simulation clusters to analyse long-term sustainability.
Reporting
This report follows the proposed Standards for Quality Improvement Reporting Excellence Guidelines.35
Acknowledgments
The authors would like to acknowledge Linn Haraldseid for acquisition and registration of data; Stian Bergby for supervising personnel and providing technical assistance and Ingvild Dalen for aiding with statistical analysis. The authors would also like to acknowledge the cooperation of the local patient organization for stroke victims (LHL) and all members of the stroke team in the study hospital. Furthermore, the authors would like to thank the reviewers and editorial team for their constructive and helpful feedback in preparing this manuscript.
References
Footnotes
Contributors SCA is the corresponding author RA, TL, HE, MG and MK contributed to the drafting and revising the manuscript. LF, KDK and SAQ contributed to the design and conceptualisation of the study and revising the manuscript. TL, HE contributed to the design of the study. JTK contributed to the statistics, calculating, analysing and contributing to interpreting data and revising the manuscript. MK contributed to the design of the study and interpretation of the data including statistics.
Funding The authors have not declared a specific grant for this research from any funding agency in the public, commercial or not-for-profit sectors.
Competing interests SCA is a research fellow funded by a Safer Healthcare Grant (University Research Fund). MG has a consulting agreement with Mentice, the remaining authors report no disclosures.
Patient consent for publication Not required.
Ethics approval This study was performed with the approval of the regional ethics committee (Regional Etisk Komite).
Provenance and peer review Not commissioned; externally peer reviewed.
Data availability statement Data are available upon reasonable request.