Article Text

Abstract
Objective Hospital-acquired pressure injuries are localised skin injuries that cause significant mortality and are costly. Nursing best practices prevent pressure injuries, including time-consuming, complex tasks that lack payment incentives. The Braden Scale is an evidence-based stratification tool nurses use daily to assess pressure-injury risk. Our objective was to analyse the cost-utility of performing repeated risk-assessment for pressure-injury prevention in all patients or high-risk groups.
Design Cost-utility analysis using Markov modelling from US societal and healthcare sector perspectives within a 1-year time horizon.
Setting Patient-level longitudinal data on 34 787 encounters from an academic hospital electronic health record (EHR) between 2011 and 2014, including daily Braden scores. Supervised machine learning simulated age-adjusted transition probabilities between risk levels and pressure injuries.
Participants Hospitalised adults with Braden scores classified into five risk levels: very high risk (6–9), high risk (10–11), moderate risk (12–14), at-risk (15–18), minimal risk (19–23).
Interventions Standard care, repeated risk assessment in all risk levels or only repeated risk assessment in high-risk strata based on machine-learning simulations.
Main outcome measures Costs (2016 $US) of pressure-injury treatment and prevention, and quality-adjusted life years (QALYs) related to pressure injuries were weighted by transition probabilities to calculate the incremental cost-effectiveness ratio (ICER) at $100 000/QALY willingness-to-pay. Univariate and probabilistic sensitivity analyses tested model uncertainty.
Results Simulating prevention for all patients yielded greater QALYs at higher cost from societal and healthcare sector perspectives, equating to ICERs of $2000/QALY and $2142/QALY, respectively. Risk-stratified follow-up in patients with Braden scores <15 dominated standard care. Prevention for all patients was cost-effective in >99% of probabilistic simulations.
Conclusion Our analysis using EHR data maintains that pressure-injury prevention for all inpatients is cost-effective. Hospitals should invest in nursing compliance with international prevention guidelines.
- cost-effectiveness
- nurses
- health services research
This is an open access article distributed in accordance with the Creative Commons Attribution Non Commercial (CC BY-NC 4.0) license, which permits others to distribute, remix, adapt, build upon this work non-commercially, and license their derivative works on different terms, provided the original work is properly cited, appropriate credit is given, any changes made indicated, and the use is non-commercial. See: http://creativecommons.org/licenses/by-nc/4.0/.
Statistics from Altmetric.com
Introduction
Hospital-acquired pressure injuries (HAPIs) are harmful to patients. In the USA, HAPIs affect over 2.5 million individuals resulting in 60 000 deaths, and similarly impact 700 000 in the UK resulting in 29 000 deaths.1 HAPIs develop from sequelae of inpatient therapy and are widely used as an indicator of hospital quality.2 Nurses can prevent most HAPIs by consistently initiating international best practice guidelines.3 Recent changes in governmental payment policies have pressured hospitals to standardise nursing best practices for HAPI prevention. For instance, the Centers for Medicare and Medicaid Services (CMS) modified its Inpatient Prospective Payment System in 2008 to reduce hospital reimbursements for pressure injuries not present-on-admission (POA).4 And in 2015, CMS began penalising reimbursements by 1% for the lowest performing quartile of hospitals with respect to composite rates of HAPIs and other hospital-acquired conditions.5 Nonetheless, HAPI rates remain high in many hospitals.6
Nursing best practices for HAPI prevention, such as risk assessment using the Braden Scale are time-consuming and complex tasks that require nursing diligence in order to be completed daily and entered into a patient’s electronic health record (EHR).7 While the National Pressure Ulcer Advisory Panel (NPUAP) and European Pressure Ulcer Advisory Panel (EPUAP) recommend the Braden Scale as a component of best practices, there is no explicit guidance on whether clinicians should respond differently to any particular Braden score at the patient level. Compliance with best practices may therefore be lower when patients have acute needs or require other procedural interventions for which nursing time is reimbursed. Additionally, there is little research on the comparative effectiveness or value of repeated Braden Scale completion.8–13 Given that HAPIs cost hospitals an estimated $9.1 to $11.6 billion annually, the valuation of prevention guidelines represents a promising area to explore the efficiency of hospital spending to improve quality.14
A previous economic evaluation determined that hospital compliance with best practices for HAPI prevention was cost-saving relative to the prospect of poor completion rates noted prior to CMS reimbursement changes.15 However, this raises additional concern about the value of directing nursing resources to initiate best practices such as risk assessments to all patients if only about 4%– 7% of patients are high risk for developing a HAPI.16–18 A prevention model targeting every patient as described in previous economic literature would direct most of the nursing time and labour devoted to HAPI prevention to patients who will never be high risk.
In this study, we analysed the cost-utility of performing daily follow-up risk assessment for pressure-injury prevention in all patients, or only in select high-risk cohorts based on their Braden score. Information for the analysis was generated from a heterogeneous, real-world sample of individual patient encounters by applying novel machine-learning methods to a hospital EHR in order to simulate the effectiveness of prevention on select patient risk cohorts. From the US societal and healthcare sector perspectives, we hypothesised that risk-stratified prevention guided with machine learning would be cost-effective at a willingness-to-pay (WTP) threshold of $100 000 per quality-adjusted life year (QALY).
Methods
Study design
We analysed the cost-effectiveness of three different pressure-injury prevention strategies using a Markov simulation, including: (a) prevention guidelines applied to all patients daily (ie, ‘prevention-for-all patients’); (b) providing ‘risk-stratified prevention’ only to patients below certain categorical Braden score thresholds (eg, minimal-risk, moderate-risk, high-risk); and (c) standard care for all patients in which compliance is variable as noted previously by Padula and colleagues.15 By definition, standard care is the intent to prevent pressure injuries at the hospital level without introducing a specific quality-improvement strategy to standardise a prevention protocol between all patients in acute care. An incremental cost-effectiveness ratio (ICER) was calculated to compare the different arms. All costs were expressed in US$ (2016) and discounted at a rate of 3%. Health utilities were expressed in terms of QALYs. This study was conducted from US societal and healthcare sector perspectives in accordance with new recommendations from the Second Panel on Cost-effectiveness in Health and Medicine over a 1-year time horizon at a WTP threshold of $100 000/QALY.19
The Braden Scale
Prevention begins with patient risk assessment using the Braden Scale as recommended in NPUAP/EPUAP International Guidelines.3 By risk stratifying patients before initiating prevention guidelines, hospitals may be able to target high-risk patients and avoid superfluous spending on prevention for patients at low risk for developing a HAPI. The Braden Scale is helpful in this regard. Patients are scored on this scale with points ranging from highest risk, 6, to lowest risk, 23. Braden scoring can be broken into five strata: very high risk (6–9), high risk (9–11), moderate risk (12–14), at risk (15–18) and minimal risk (19–23).7
Model
A Markov model was constructed in TreeAge Pro suite 2016 (TreeAge Software, Williamstown, Massachusetts, USA; 2009) to compare the cost and effectiveness of prevention-for-all, risk-stratified prevention and standard care in 1-day cycles for up to 365 days (figure 1). The Markov approach is a useful structure to capture time-dependent transitions between different health states, or in this case, the transition between risk states and sequelae such as pressure injury; it is typically used with longitudinal, time-series data. The model simulated patients entering through one of six different comparative arms: (1) prevention-for-all, (2) risk-stratified prevention (Braden <19), (3) risk-stratified prevention (Braden <15), (4) risk-stratified prevention (Braden <13), (5) risk-stratified prevention (Braden <10) or (6) standard care (ie, lower odds of prevention compliance in any patient). Simulations were initiated in a certain risk category for developing a HAPI based on the observed sample distribution of risk prevalence. Patients were tunnelled for 5 days in each comparator arm within a baseline risk group, under which patients could not develop a HAPI. The process of tunnelling means to prevent a simulation from moving between multiple health states. After the fifth day, patients in these arms could then potentially develop stage 3, 4 or unstageable HAPIs, transition to another Braden score risk level, discharge or die. For patients that later developed a HAPI, they could either undergo surgery or acute and chronic care in accordance with Padula and colleagues’ prior model.15 Death could occur in patients as they underwent surgery, or during periods of acute and chronic care. Patients recovering from care were discharged.
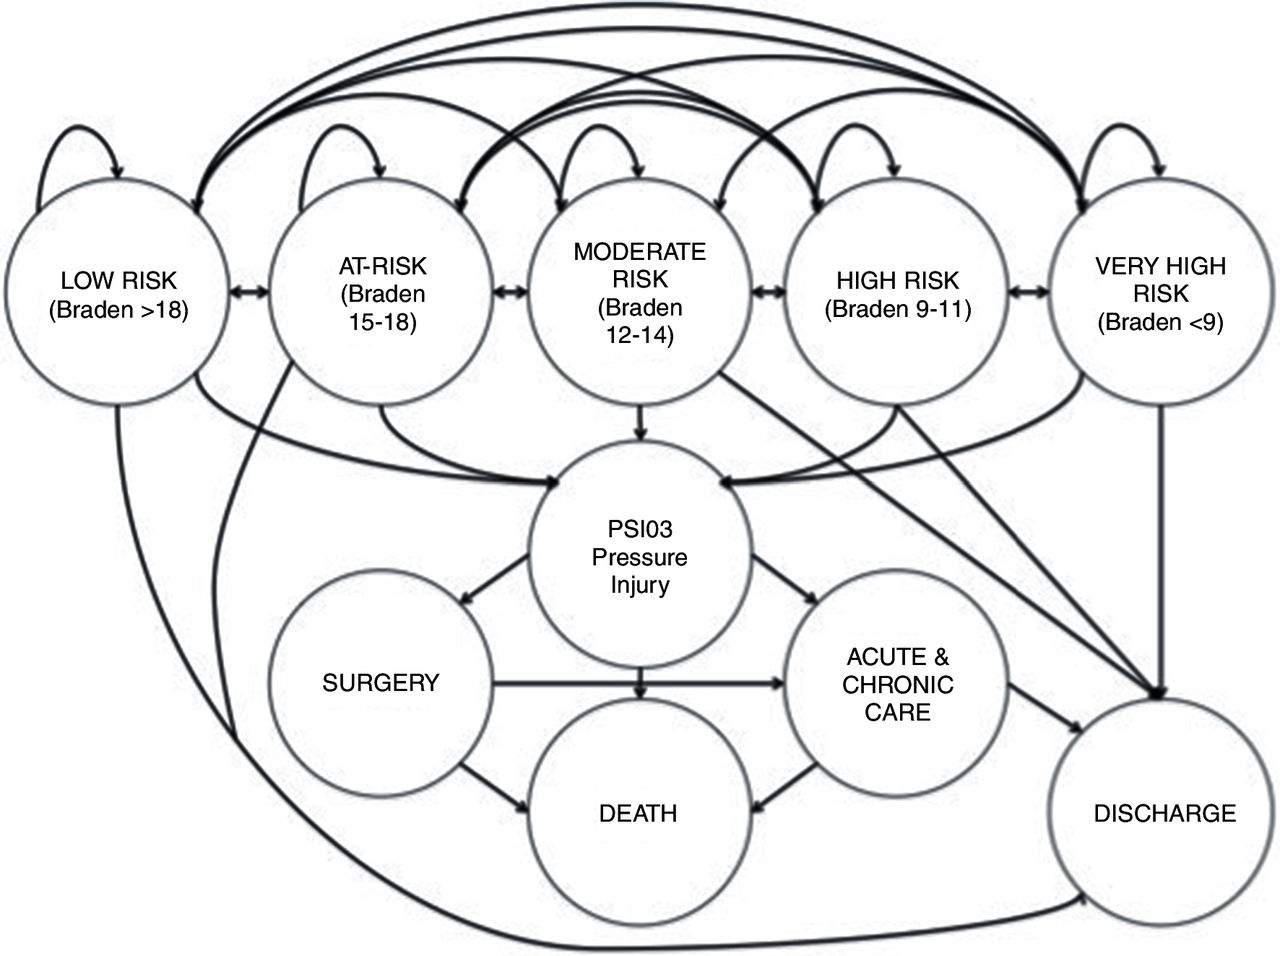
State transition diagram of the Markov model. Patients are admitted to the hospital and determined to be one of five risk states for pressure injury using the Braden score. They then transition through different risk categories until they are safely discharged. Patients who develop a pressure injury (ie, Patient-Safety Indicator #3, PSI03) require acute and chronic care, and potentially surgery to safely exit the model, otherwise the pressure injury could be fatal.
For this study, we only considered stage 3, 4 and unstageable pressure injuries not POA in adult inpatients (18 years or older) after 5 days length-of-stay (LOS) according to Agency for Healthcare Research and Quality Patient-Safety Indicator #3 (PSI03). These stages were the most clinically relevant in terms of leading to endpoints with significant morbidity and measurable costs such as surgery or death. High-staged pressure injuries were also more reliably coded in the EHR.20 21
Data management
Deidentified encounter-level Braden scores, PSI03 pressure-injury diagnoses and demographics were obtained from the Clinical Research Data Warehouse (CRDW) at University of Chicago Medicine, a state-of-the-art clinical data repository for patient-level EHR archives of >1.5 million hospitalised encounters. CRDW patient records had ≥2 completed Braden scores and a LOS ≥5 days. Only pressure ulcers in the EHR resembling a PSI03 were preserved. Several other criteria of PSI03 were replicated during data management. Pressure injuries had to appear as a secondary diagnosis to emulate HAPI status as not POA; primary diagnoses of pressure injuries or a POA status indicator were excluded. We only included stages 3, 4 and unstageable pressure ulcers (ie, International Classification of Diseases Ninth Revision codes 707.23, 707.24 and 707.25) in patients age ≥18.
CRDW data were managed longitudinally by patient shift for each updated Braden score, up to 10 total shifts representing 5 days LOS, and merged with patient diagnosis for HAPI along with age. Braden scores were time-stamped by the hour which was rounded off to the nearest day for 5 days, and managed categorically according to the risk levels defined above. Since data on transition probabilities only represent the first 5 days of patient history, we assumed that these trajectories were consistent for additional LOS and simulated total patient hospitalisation based on these initial data.
Machine learning and transition probability generation
Patient records totalling 34 787 met inclusion criteria to create a matrix for illustrating the probability of moving between risk levels during each day of hospitalisation. A multistate Markov model was developed using the supervised machine-learning R package ‘msm’ (The R Project for Statistical Computing, Institute for Statistics and Mathematics, Vienna, Austria) to calculate transition probabilities from risk levels to discharge or HAPI development.22 The Markov model was chosen since it best depicted the transitional nature of Braden score risk states for patients while hospitalised.23 The Markov model applied up to 10 Braden scores for each patient encounter recorded in the first 5 days after admission, and tracked these transitions. Wherever the patient was by the fifth day, the model placed them in an endpoint to illustrate the eventual end state.
This approach was advantageous for observing transitions of HAPI risk in a real hospital. By comparison, most cost-effectiveness analyses reference data on treatment effect through randomised clinical trials (RCT). Given the costliness of collecting surveillance data on Braden scores through an RCT, the CRDW presented an affordable alternative for data collection and provided insight into the real-world variability of patient risk that may not have been observed in an RCT. Furthermore, machine learning offers a methodology for statistical prediction through cross validity, as these data were tested in a parallel study.11 The disadvantage of this approach is that we could not observe true transition probabilities affected by comparative prevention strategies in each study arm.
Following a patient’s placement in a baseline risk state, the probability that a patient transitioned to another health state was based on values extracted from the literature, including probability of surgery, acute and chronic care and death (table 1). Parameters for the probability of death and OR of reduced pressure injury risk with prevention were cited from previous studies; patients who received preventive interventions were deemed to have 0.335 reduced OR of developing a HAPI.15 24 The baseline probability of developing a pressure injury was the remainder between the sum of all other probabilities in the model and 100%.
Model parameters
Costs
Costs were expressed in terms of the societal value of reimbursement for patient care, rather than being limited only to hospital charges. Healthcare sector costs included the costs reflected through average reimbursement between a government or commercial payer and hospital in addition to patient out-of-pocket copays. Societal costs included these healthcare transaction costs plus time-costs to the patient for additional hospitalisation caused by a HAPI, and opportunity costs incurred by the clinician for time spent repeating risk assessments. Patient costs for hospitalisation varied by the entry point into the model (table 1). There was a global cost of $2122 per day applied to all patients for an inpatient stay. The cost of prevention was obtained by literature review. For patients in the prevention-for-all and risk-stratified prevention arms, a global cost of $99.44 per day per patient for preventive care was based on International Guidelines.3 This cost included the nursing time for skin checks and repositioning, a group-II hospital bed, a chair cushion, managing moisture and incontinence, nutrition and nursing education, as well as an additional 25% for unforeseen costs.15 25 26 A cost for performing risk stratification was also included for all prevention comparators. Finally, a cost of lost patient productivity per day of hospitalisation was also included in the model. Productivity loss was calculated as a function of US average yearly wage data from 2015 weighted by the disutility of a particular health state.25
Utilities
The utilities used in this model were based on EQ-5D Index scores ranging from 0.0 QALYs (death) to 1.0 QALYs (full health).27 All patient simulations gained weighted QALYs when entering inpatient care. Inpatients who developed a HAPI had reduced QALYs. The model also incorporated disutility for patients who required surgery or acute and chronic care and a final utility reward for patients who were successfully discharged in the model (table 1).
Assumptions
First, we assumed that pressure-injury prevention compliance was uniform across patients with different levels of risk. This assumption was supported by qualitative interviews with Certified Wound, Ostomy and Continence Nurses at facilities we studied.28 Second, we assumed consistent inter-rater reliability between Braden scores entered into the EHR by different nurses. Third, we assumed that risk scores reflected consistent adjustments for risk factors that are not explicitly classified in the Braden Scale. Fourth, we assumed the time cost of lost productivity while hospitalised was applied to all patients, regardless of whether they were of working age; thus, all patients had increased costs from the societal perspective the longer they remained hospitalised with a HAPI. Fifth, we assumed that mean daily cost of inpatient hospitalisation was fixed within our model cohort. Sixth, we assumed that transition probabilities were fixed between comparator arms, adjusting for a constant OR regardless of initial risk at admission. Seventh, we assumed that this OR was equal between treatment arms (ie, patients receiving prevention received the same risk reduction of a pressure injury). This assumption is based on the fact that existing literature lacks information on risk reduction stratified by risk cohort.
Sensitivity analysis
Univariate one-way and two-way sensitivity analyses were used to test model uncertainty over the 1-year time horizon. These sensitivity analyses were performed by varying all base case estimates by reported distributions (eg, CIs, SDs) or by varying estimates±15% of the mean when distributions were not reported. We ran one set of univariate analyses for the five cohort models by varying the OR for HAPI incidence after prevention in 0.025 increments across the five risk groups such that low-risk patients had reduced HAPI incidence: minimal risk=0.385; at risk=0.360; moderate risk=0.335; high risk=0.310; very high risk=0.285.
We also performed a Bayesian multivariate probabilistic sensitivity analysis (PSA) with 10 000 Monte Carlo simulations, using standard care as the reference arm. Beta distributions were applied to probabilities and utilities (ie, parameters between 0.0 and 1.0) and gamma distributions were for costs (ie, parameters >0.0).
Results
We generated an age-adjusted transition probability matrix across 10 Braden scores for all patient encounters using supervised machine learning. Very high-risk patients had about 10 times the risk of developing a HAPI compared with minimal-risk patients (table 2). These data were then used to populate the economic model. Prevention-for-all was cost-effective compared with standard care and risk-stratified prevention from both societal and healthcare sector perspectives. Prevention-for-all yielded higher QALYs at slightly higher cost compared with standard care, resulting in a societal ICER of $2000/QALY and healthcare sector ICER of $2142/QALY (table 3). Both ICERs were below the $100 000/QALY WTP threshold, suggesting that good quality care for patients dominated poor quality. Additionally, most other scenarios of risk-stratified prevention dominated standard care when patients with Braden scores of <10, <13 and <15 were provided with follow-up preventive care.
Transition probabilities with variances of Braden scores to endpoints for a multistate Markov model (n=34 787)
Expected results of the base case cost-effectiveness analysis
No costs, utilities or probabilities impacted model results individually from the univariate sensitivity analyses. If the cost of nursing time was excluded from the cost of prevention ($23.72 for skin checks, repositioning and education), the ICER comparing prevention-for-all to standard care was reduced to $1029/QALY. Nursing cost exclusions are justifiable opportunity costs to hospital financing since nursing time could be redistributed towards other tasks. Furthermore, if at-risk and minimal-risk patients were screened once every 3 days instead of daily, the cost was reduced by only $4 per patient. Finally, adjusting the OR of HAPI incidence with prevention between risk groups did not result in significant ICER variability such that standard care would be cost-effective.
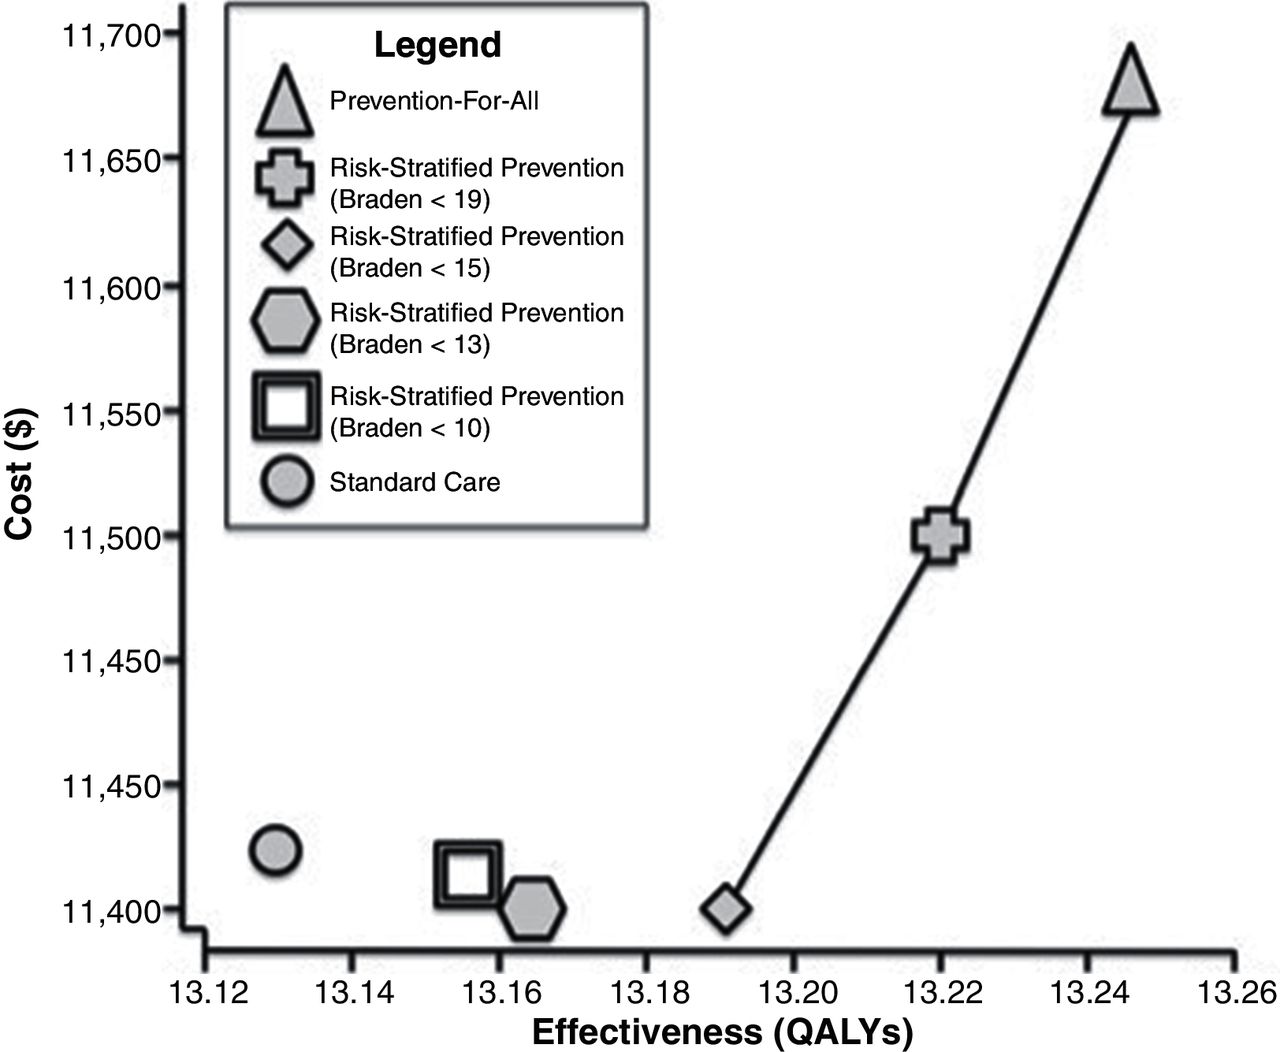
PSA from the societal perspective revealed that prevention-for-all was cost-effective compared with standard care in 99.99% of simulations and was dominant in 97.2%. A cost-effectiveness acceptability curve illustrated that prevention-for-all had a >50% probability of being cost-effective above a WTP threshold of approximately $9000/QALY. This suggests that prevention-for-all would be a cost-effective strategy for most Western societies since prevention-for-all was the most costly but also the most effective strategy. Risk-stratified prevention (Braden <15) was least expensive and the most likely cost-effective strategy between $0/QALY and $3000/QALY thresholds, and risk-stratified prevention (Braden <19) was the most likely cost-effective strategy between $3000/QALY and $9000/QALY thresholds (figure 2).

Cost-effectiveness acceptability frontier for three risk-assessment strategies related to pressure-injury prevention best practices from a US societal perspective: (a) standard care, (b) repeated risk assessment in all patients or (c) repeated risk assessment in high-risk patients according to the Braden Scale. QALY, quality-adjusted life-year.
Discussion
We evaluated the cost-effectiveness of risk-stratified pressure injury prevention and an all-inclusive prevention strategy compared with standard care. We hypothesised that stratifying high-risk patients with lower Braden scores for follow-up and suspending follow-up compliance for minimal-risk patients would improve health outcomes at reduced costs by focusing prevention efforts on patients of highest need. However, we found that the most cost-effective strategy remained prevention-for-all based on utility gains. Risk stratifying patients and providing pressure-injury prevention only to patients with Braden scores <15 was both less costly and more effective than standard care. Nonetheless, simply remaining diligent to perform follow-up risk assessment in all hospitalised patients appears to be of good value and improve quality compared with providing risk-stratified prevention to only higher-risk patients.
One reason why it might not be particularly cost-effective to only provide prevention for patients at highest risk (lowest Braden scores) is because patients who are low risk for a pressure injury still have a reasonable chance of transitioning to a higher risk level according to the transition matrix developed using machine learning. Thus, a patient who is at minimal risk on admission, but on a trajectory for greater risk on subsequent days possibly due to an unanticipated procedure or change of health status may benefit from continual follow-up in the first 48–72 hours. Additionally, it may also be true that by applying the same care process to all patients, the process becomes standardised, done more efficiently and easier to monitor and assure improved process reliability. These two concepts make all patients important, not simply those stratified by the Braden Scale.
These data highlight an ongoing conversation about the cost of quality. Based on these findings, the cost of good quality is relatively equal, if not cost-saving compared with low quality care. The costs of HAPI prevention balance out with internal failure costs (eg, uncompensated treatment), external failure costs (eg, potential penalties and litigation) and appraisal costs. Therefore, it makes sense for health systems to invest in quality-improvement infrastructure so that, in the long run, patients are better off in addition to health systems performing more efficiently.
Health system administrators may find themselves in a financial predicament to adopt these results. For a typical 500-bed hospital, the International Guidelines represent over 150 nursing hours per day spent on HAPI prevention, fixed costs including pressure-distributing beds that can cost $10 000 each, and skin care and moisture management products that we estimate can cost $30–50 per patient-day. This could consume over $250 000 in startup costs in the first month alone to improve compliance. While these costs add up, the cost of a stage 3, 4 or unstageable pressure ulcer is much more extraordinary. The cost of one HAPI out of 100 inpatients, offset by the cost of prevention results in a societal budget impact for a 500-bed hospital of about $0.24 per patient-day, assuming a health system (eg, accountable care organisation) has 500 000 covered lives. Put in this perspective, asking the public to invest ¢24 per day in an infrastructure to prevent HAPIs is good value considering the morbidity these conditions cause. In addition, it is likely that over time hospitals will become more efficient at preventing HAPIs and other hospital-acquired conditions as a result. Avoiding conditions impacted by the threat of immobilising patients, such as deep vein thrombosis, catheter-associated urinary tract infection and, subsequently, sepsis all add value to HAPI prevention and are not modelled in this study.29
Our study has several limitations. First, EHR data are used to simulate transitions of patient risk in each comparator arm, compared with most economic evaluations which depend on measured treatment effects from RCTs. While we believe that this is the best source of real-world data, we are uncertain whether these are true transition probabilities between comparators, and rely on the assumption that the OR of risk reduction is equal for any patient regardless of initial risk. Second, these data may be limited by variability in inter-rater reliability between Braden scores reported during separate nursing shifts since EHR data collection was retrospective. It remains unclear whether all nurses provided consistent Braden scores given the subjectivity of risk adjustment in Braden scores based on patient age, body mass index, codiagnoses and so on, as well as potential confounding introduced through unmeasured aspects of provider behaviour or documentation practices. Because of this concern, we used age-adjusted transition probabilities based on categorical shifts in Braden scoring to reduce model sensitivity to potential bias between Braden scores. Third, although transition probabilities were calculated using a large sample cohort, these probabilities reflect outcomes from a single health system and may not be generalisable to other types of facilities such as non-academic, small or suburban/rural systems. A future study could apply this machine-learning technique to other hospital settings to produce probabilities based on a larger, more diverse patient population. Fourth, some pressure injury prevention tactics may have been performed in this patient population that influenced the probabilities of developing a HAPI during the hospital stay that were not documented in the CRDW. Fifth, we did not examine the possibility of offering different preventive interventions to patients at different levels of risk. It is possible that if we had focused prevention efforts to be more aligned with patient risk, risk-stratified prevention may have held greater value. Sixth, the CRDW did not consistently record POA flags associated with diagnosis of some pressure injuries, so there may be overinclusion of pressure injuries that were POA in the study dataset. This issue was addressed by testing a univariate sensitivity analysis on the incidence rate of HAPI which did not affect the results. Sixth, costing elements such as time cost of lost productivity were applied to all patients which may be an overestimate for elderly patients. Guidance from the US Panel on Cost-effectiveness supports this approach, however alternative methods for economic modelling such as patient-level simulation could provide insight into the value of prevention stratified by the population heterogeneity of working age versus elderly patients.
Seventh, costs for patient care in the real world are likely skewed between cohorts and based on the fact that some patients can remain hospitalised for extended periods. Data to explore the exact distributions of LOS beyond a normal range were not analysed, so we were unable to calibrate the model to patients of long-term acuity. Furthermore, by assuming fixed inpatient costs within cohort for this model, more complex patients (eg, transplant patients) would likely have more expensive stays for longer periods. These combined assumptions and limitation suggest that our ICER likely represents a lower-bound estimate of the value of prevention in more complex cases. The sensitivity analyses attempted to address these concerns regarding skew of higher-cost patients.
The cost of HAPI prevention continues to rise as seen when comparing previous economic evaluations over the past decade.15 30–32 The technology to prevent HAPIs has improved through beds, dressings, sensors and so on but these are all expensive to implement.33 Additionally, the cost of nursing time has also increased. While our study suggests that it might be best to provide basic preventive pressure injury care to all hospitalised patients, hospitals still need to invest in technologies and people that enhance preventive efforts. Otherwise, cost-cutting may be necessary, and risk-stratified prevention can support this approach.
Ultimately, pressure-injury prevention in all hospitalised patients remains the highest value alternative, but requires investment in a quality-improvement infrastructure of nursing time and technology to remain compliant. This concept could be helpful in guiding CMS towards its next payment reform since hospitals can little afford this investment to improve if constantly being penalised for previous mistakes. A payment system in the US that supports hospitals to invest and apply prevention guidelines could be more beneficial to patients. Pressure injuries are preventable hospital-acquired conditions, and investments made towards pressure-injury prevention are akin to low hanging fruit in the battle against rising healthcare costs. In a healthcare environment that penalises hospitals for preventable hospital-acquired diseases, providing pressure-ulcer prevention represents a very cost-effective strategy for reducing HAPIs and improving patient outcomes.
References
Footnotes
Contributors All authors contributed equally to the development of this manuscript.
Funding This study was funded by Agency for Healthcare Research and Quality (grant no: 1-F32-HS023710-01).
Competing interests None declared.
Patient consent Not required.
Ethics approval University of Chicago Biological Sciences Division IRB.
Provenance and peer review Not commissioned; externally peer reviewed.
Data sharing statement The data for this analysis were available to all study authors. They are available to editors and reviewers on request made to WVP.