Article Text

Abstract
Background Reducing costs while increasing or maintaining quality is crucial to delivering high value care.
Objective To assess the impact of a hospital value-based management programme on cost and quality.
Design Time series analysis of non-psychiatric, non-rehabilitation, non-newborn patients discharged between 1 September 2011 and 31 December 2017 from a US urban, academic medical centre.
Intervention NYU Langone Health instituted an institution-wide programme in April 2014 to increase value of healthcare, defined as health outcomes achieved per dollar spent. Key features included joint clinical and operational leadership; granular and transparent cost accounting; dedicated project support staff; information technology support; and a departmental shared savings programme.
Measurements Change in variable direct costs; secondary outcomes included changes in length of stay, readmission and in-hospital mortality.
Results The programme chartered 74 projects targeting opportunities in supply chain management (eg, surgical trays), operational efficiency (eg, discharge optimisation), care of outlier patients (eg, those at end of life) and resource utilisation (eg, blood management). The study cohort included 160 434 hospitalisations. Adjusted variable costs decreased 7.7% over the study period. Admissions with medical diagnosis related groups (DRG) declined an average 0.20% per month relative to baseline. Admissions with surgical DRGs had an early increase in costs of 2.7% followed by 0.37% decrease in costs per month. Mean expense per hospitalisation improved from 13% above median for teaching hospitals to 2% above median. Length of stay decreased by 0.25% per month relative to prior trends (95% CI −0.34 to 0.17): approximately half a day by the end of the study period. There were no significant changes in 30-day same-hospital readmission or in-hospital mortality. Estimated institutional savings after intervention costs were approximately $53.9 million.
Limitations Observational analysis.
Conclusion A systematic programme to increase healthcare value by lowering the cost of care without compromising quality is achievable and sustainable over several years.
- health services research
- cost-effectiveness
- hospital medicine
- management
This is an open access article distributed in accordance with the Creative Commons Attribution Non Commercial (CC BY-NC 4.0) license, which permits others to distribute, remix, adapt, build upon this work non-commercially, and license their derivative works on different terms, provided the original work is properly cited, appropriate credit is given, any changes made indicated, and the use is non-commercial. See: http://creativecommons.org/licenses/by-nc/4.0
Statistics from Altmetric.com
Introduction
Healthcare spending in the USA has increased from 4.4% of the gross domestic product in 1950 to nearly 18% in 2016, reaching $3.3 trillion.1 Per-capita healthcare spending is higher than any other industrialised nation,2 but healthcare quality ranks last.3
In response, focus on value in the US healthcare system, defined as health outcomes achieved per dollar spent, has been intensifying.4 In 2015, the Centers for Medicare & Medicaid Services set a goal to have 90% of healthcare reimbursement be value based by 2018, and commercial payers are following suit.5 6 Health systems are beginning to respond by publishing their approaches to value-based care.7–9
By the beginning of 2014 it had become apparent that our own health system, NYU Langone Health (NYULH), had substantial opportunity to improve value. From 2010 to 2013, our institutional losses on Medicare patients had more than doubled. In 2013, we had been ranked number 1 in quality and accountability by the University Healthcare Consortium (now Vizient)10; however, the American Association of Medical Colleges-Council of Teaching Hospitals (COTH) quarterly survey of hospital operations and financial performance showed we were nearly at the 75th percentile for expense per discharge even after standardising for case mix index (CMI) and Wage Index.11 Analytics from Cleverly and Associates, an external consultant, indicated that our CMI-adjusted Medicare loss per case was the highest among all academic medical centres.12 It was in this environment that the Dean and Chief Executive Officer (CEO), a single role at NYULH, formed a Value-Based Management (VBM) Task Force to ensure that NYULH not only provided the highest quality but did so at an affordable cost.
This paper describes the formation and evolution of the VBM programme and its impact on total variable direct cost per case and quality.
Methods
Study setting
NYULH is an academic health system in New York, NY that included two inpatient hospitals (Tisch Hospital, 844 beds; NYU Langone Hospital - Brooklyn, 225 beds) when the VBM project began. Because Tisch Hospitalaccounted for 85% of total admissions and 80% of total inpatient variable direct costs, VBM projects in the first years focused on this hospital. Accordingly, this analysis is restricted to Tisch discharges.
VBM Task Force
The Dean of the NYU School of Medicine serves also as CEO of NYULH, enabling the institution to align academic, clinical and operational priorities. In November 2013, the Dean convened hospital leaders to recommend a road map to value improvement. The programme formally launched in April 2014 with the kick-off of the inaugural VBM Task Force. The Task Force was led by the chief medical officer (RAP), a senior clinician with over 30 years of clinical experience at NYULH. Directly reporting to the VBM Chair were a project lead with a Master's of Business Administration (SCC), and a clinical lead who was a practising hospitalist (FMV), who took joint responsibility for prioritisation and oversight of projects, and for initial meetings with stakeholders for new projects. Other members included all hospital-based vice deans and senior vice presidents. The Task Force was supported by 10 project managers, each of whom was assigned responsibility for two to three projects, in addition to their hospital-based responsibilities. VBM project managers had 3–5 years of experience at the institution, a master’s degree either in hospital administration or business administration, and worked within hospital operations, strategy, planning, business development or finance.
Cost accounting
The VBM team used variable direct cost data fromNYULH’s customised activity-based costing system (EPSi, Allscripts), which was implemented in September 2011, for cost accounting (see online supplementary appendix A for variable direct cost components). This customised system includes several unique features that facilitated identification of opportunities for improved value. First, it is based on actual costs (ie, acquisition costs of drugs and supplies) rather than the ratio of cost to charge, thus eliminating influence of charges and insurance contracts. Second, it incorporates both inpatient physician and hospital billing so that collective impact of clinical care could be assessed: for instance, the Task Force could assess whether certain types of consults or care by certain types of physicians affected outcomes. Third, it includes patient-level quality data such as expected mortality, readmissions and length of stay (LOS); and hospital-acquired conditions, facilitating a focus on value. For instance, the Task Force used embedded quality data to calculate additional costs of hospital-acquired conditions in considering value opportunities. The expected quality outcomes were obtained from the Vizient Clinical Data Base/Resource Manager (CDB/RM), which creates risk-adjustment models based on admissions from hundreds of academic medical centres. Fourth, it includes ‘expense groupings’ that match clinical intuition rather than administrative categories like payor or service line: blood, laboratory, pharmacy, radiology, implants and supplies, intensive care and operating room. Finally, additional fields were added as needed to support individual projects—for instance, a field for comanagement was added to track value of hospitalist comanagement of surgical patients.
Supplemental material
Opportunity identification
The VBM Task Force focused on six main areas of potential opportunity: operational efficiency (as measured by labour efficiency and patient throughput metrics); resource utilisation (as measured by variable direct cost/case); supply chain management (as measured by wasted materials, price and utilisation); revenue cycle (as measured by appropriate coding and documentation); outliers (as identified by highest cost patients); and corporate services (measured by administrative and overhead costs). Over time, the Task Force identified areas of opportunity within each of these categories through analysis of those metrics, in-person feedback from clinicians, a web-based idea submission form and comparison to performance of seven hospitals identified by Vizient as being high quality and low cost (table 1).
Taxonomy of selected VBM projects
Each area of opportunity was assessed by the project and clinical leads to prioritise high-potential projects. For the first round of value projects, a sign-off from the Dean was required. High-potential projects were selected based on projected impact and ease of implementation.
Interventions
Using a standardised process improvement model, a dedicated, time-limited project committee was created for each new project. Each committee was co-led by a clinical lead and a project manager. A formal project charter was developed in the first two meetings of each project and approved by the Task Force. The Task Force met monthly to review overall VBM metrics and hear reports of individual projects. Once initial interventions were developed, implemented and refined, continuing oversight was turned over to existing institutional committees.
In addition to implementing specific projects, the VBM Task Force made data widely available throughout the institution. In October 2014, an interactive dashboard containing up-to-date and historical data on inpatient Medicare activity (visible by department, attending physician, diagnosis related group (DRG) family and expense grouping) was rolled out to the Task Force and 1 month later to clinical chairs and their designees (online supplementary appendix B). In January 2015, CMI-adjusted variable direct cost per case was added to the dashboard (visible by department, physician and expense grouping), and in February 2015, data on the top quartile of Vizient performers were added (online supplementary appendix C). Filters could be applied in real time to any data display, with drill-down to individual patient records.
In the second year of the VBM initiative, the Task Force created a departmental incentive programme. On a semiannual basis, actual versus prior year costs were calculated for each clinical department, adjusted for CMI and healthcare inflation. Departments were given cost targets and quality thresholds, and chairs were held accountable to their goals in semiannual meetings with the Dean, during which VBM performance was specifically reviewed and requests for improvements made if necessary. Targets were adjusted dynamically as institutional priorities and objectives evolved. Departments with costs below expected received a fraction of the savings (between 10% and 40%, averaging 25%) depending on operational performance metrics such as observed/expected LOS and on quality metrics such as healthcare-associated conditions or patient experience. These funds could be used at chair discretion but were expected to be used to support departmental-specific value improvement initiatives, including supporting physician salary time for projects. Costs for patients spanning multiple departments (such as surgical patients comanaged by hospitalists) were calculated separately and any savings versus expected costs were divided between departments to encourage cross-departmental collaboration (75% to the primary department and 25% to the secondary department). Patients were attributed to department based on discharging physician. Departments were encouraged to use shared savings funds to identify and implement new value-focused initiatives. Departments could view their expected costs and savings to date in real time on the VBM dashboard. The VBM Task Force tracked these projects and provided analytic and logistical support.
Study cohort and data sources
We defined our baseline period as the start of our new fiscal accounting system (September 2011) through launch of the VBM initiative (April 2014). However, Tisch Hospital was closed from 29 October 2012 to 27 December 2012 because of catastrophic damage to its emergency department, some radiology equipment and mechanical systems from Superstorm Sandy and underwent a phased reopening over the next few months, with most services including urgent care reopening 14 January 2013. The emergency department reopened in April 2014 at three times the predisaster size. Since this disaster skewed cost data during fiscal year 2012 (September 2012 to August 2013), we excluded that period from analysis. Of note, the baseline period for readmission began in January 2012, because prior Vizient data were unavailable.
The postintervention period was May 2014 to December 2017.
Our cohort was all inpatient admissions to Tisch Hospital. We excluded admissions for rehabilitation and inpatient psychiatric treatment, which are not paid on a DRG basis, and excluded normal newborns as is standard in American Hospital Association and Centers for Medicare & Medicaid Services cost accounting. We also excluded cases with no DRG weight assigned or assigned to Medicare Severity Diagnosis Related Group (MS-DRG) 998 (invalid discharge diagnosis) or 999 (ungroupable diagnosis). We divided cases into medicine and surgery cohorts based on the CMS DRG groupings.
All data for statistical analysis were obtained from the cost accounting system, which incorporated the Vizient CDB/RM data on readmission. Data from COTH and from Cleverly and Associates were obtained from reports provided to the institution. Data for publicly reported Medicare measures were obtained from Hospital Compare.
Outcomes
Rather than attempt to individually quantify and sum the effect of each individual intervention, which may either double-count savings or undercount spillover effects, we assessed the global impact of the programme on total variable direct cost per case (online supplementary appendix C). A secondary outcome was LOS, as it was targeted by several of the interventions. We assessed two counterbalancing measures to identify potential unintended consequences: 30-day same-hospital readmission rate and in-hospital mortality rate. We also tracked summary statistics on cost, readmissions and mortality from COTH; Cleverly and Associates; and Medicare (via Hospital Compare) to qualitatively determine performance versus peers. Project-specific value metrics were designated for each chartered project but are not reported here.
Independent variables
The primary exposure variable was intervention period. To account for potential changes in patient mix over time we included as covariates: age (as indicators for 5 years age bin up to 90 and an indicator for 91 and above); sex; race/ethnicity (white, black, other and unknown); insurance (Medicare fee-for-service (FFS), Medicare Advantage, Medicaid FFS, managed Medicaid, self-pay, commercial or other insurance types); surgical patient indicator, grouped using MS-DRG type; DRG weight (in deciles); Elixhauser comorbidities; and seasonal indicators.13 Average DRG weight for all hospitalisations represents the CMI. We adjusted the cost outcomes using the seasonally adjusted consumer price index (CPI) for all urban consumers for medical care, and denominated to September 2011 dollars.
Statistical analysis
We used descriptive statistics to characterise preintervention and postintervention cohort demographics. Categorical variables were summarised as frequencies and proportions, and continuous variables as means and SDs. We examined differences in preintervention and postintervention cohorts using χ2 tests or t-tests, as appropriate. For illustrative purposes, we graphed percentage change from baseline in both unadjusted and adjusted costs (in September 2011 dollars), indicating when key interventions occurred.
For each cost outcome, we conducted two complementary analyses to determine whether postintervention costs differed from preintervention: statistical process control (SPC) charts and interrupted time series (ITS) analyses. First, we plotted the fully adjusted mean total variable direct costs per case for each month for all patients and for medical and surgical DRGs separately on SPC charts. We explored whether there was ‘special-cause variation’ in the postintervention period in DRG-weight adjusted costs: that is, whether any mean monthly costs were above or below the 3 SD (99.7%) control lines, or whether there was a run of at least eight consecutive observations above or below the mean.14 To maintain institutional confidentiality of internal cost structure, results are presented as monthly percentage changes from the baseline mean.
We then conducted ITS analyses for the main outcome and all secondary outcomes, setting the interruption at 1 May 2014. This approach is superior to a simple pre-post analysis because it accounts for underlying secular trends in the preintervention period. We conducted sequential ITS analyses, first without adjustment, then adjusted for all covariates but DRG weight (which could potentially be influenced by changes in coding over time), then fully adjusted. In addition to the covariates specified above, each ITS model included a linear monthly trend term for the preintervention period (‘Time’), an indicator variable for post-VBM months (‘Intervention’), which captures any level change in the outcome postintervention, and a linear monthly trend term only for the post-VBM months (‘Time After Intervention’), which captures any change in slope of the outcome postintervention relative to the preintervention trend.15 16 These three terms allowed us to investigate whether the level and slope of the outcome changed after intervention. We estimated generalised linear models (GLM) with the gamma family and log link for continuous outcomes; and GLMs with the binomial family and logit link for binary outcomes. Since this patient-level analysis includes a cross section of patients plausibly independently distributed across months, autocorrelation was not assumed.
To determine whether the programme had differential effects by patient population, we then stratified the ITS total variable direct cost analysis by medical versus surgical DRGs.
We calculated estimated savings by subtracting the observed cost from predicted cost for each case and summing the difference across cases in the intervention period. We generated predicted costs by estimating a fully adjusted model including ITS model parameters for just the preintervention period and then fitting intervention period observations to the model. We calculated estimated costs of the intervention by summing the project management personnel costs, including fringe.
Data management and analysis were performed using R 2017 (R Core Team, Vienna, Austria) and Stata V.13 (StataCorp, College Station, TX). The project used only non-identified data and was considered by the NYU School of Medicine Institutional Review Board not to be human subjects research; therefore informed consent for data access was not required.
Results
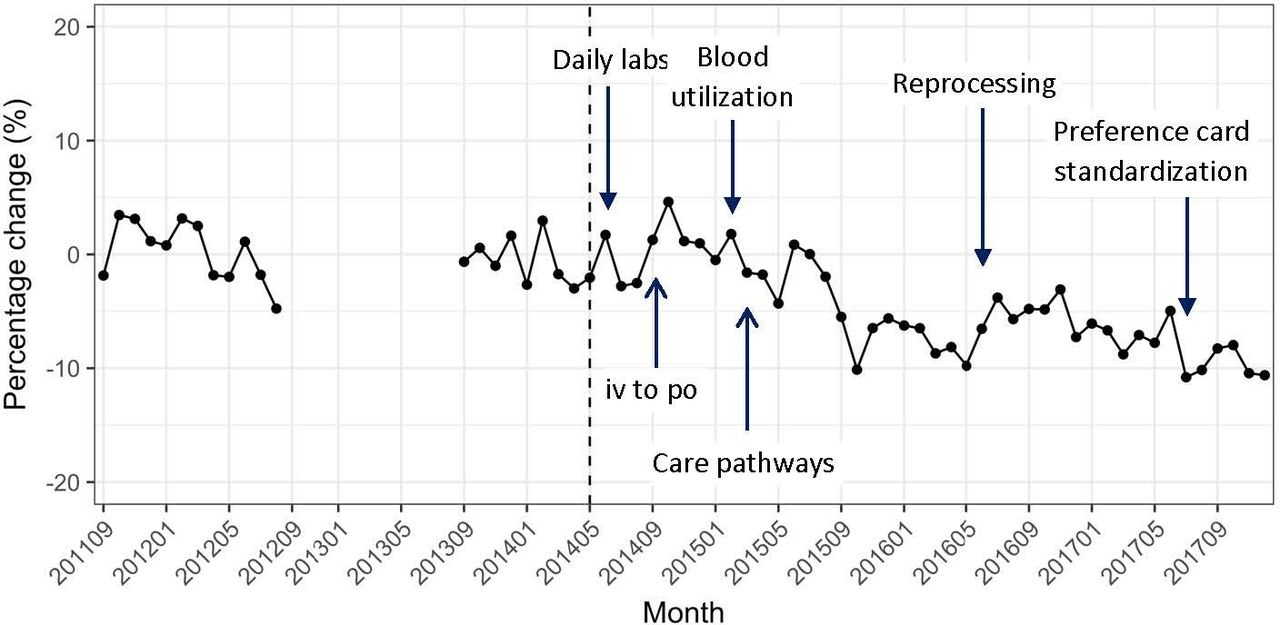
During the study period, the VBM Task Force chartered 62 projects (selected projects are shown in table 1): 36 projects were completed and are now in maintenance phase; another 26 remain in progress. An additional 12 department-led initiatives were conducted. Figure 1 shows the start dates of some of the larger projects.

Percentage change in total variable direct costs relative to the preintervention period mean. Costs adjusted for DRG weight; all costs are denominated in September 2011 dollars.
The total study cohort included 160 434 hospitalisations (47 404 preintervention and 113 030 postintervention). We excluded 11 716 rehabilitation admissions, 4511 psychiatric admissions, 21 451 normal newborn admissions and 4043 admissions that had MS-DRG of missing, 998 or 999. Characteristics of the preintervention and postintervention cohorts are shown in table 2. In the postintervention period, mean DRG weight was higher (1.86 post vs 1.72 pre, p<0.001), more patients were on the surgery service (11.0% vs 10.2%, p<0.001), fewer patients were on the medicine service (29.7% vs 32.4%, p<0.001) and substantially more patients had Medicaid insurance (15% vs 10.5%, p<0.001).
Characteristics of study cohort
The SPC chart shows 29 consecutive months in the postintervention period below the preintervention mean, and 21 months that were below the lower 3 SD control line, strongly signalling the presence of special cause variation (figure 2A). This pattern was retained for both medicine patients (34 consecutive months below mean; 19 months below lower control line; figure 2B) and surgery patients (21 consecutive months below mean; 3 below lower control line; figure 2C). In addition, the surgery cohort had 12 consecutive months above the preintervention mean in the early intervention period (3 outside the upper control line).

Statistical process control charts of adjusted total direct variable cost per discharge. (A) *Percentage change in mean adjusted total direct variable cost per discharge relative to the preintervention mean, all patients. (B) *Percentage change in mean adjusted total direct variable cost per discharge relative to the preintervention mean, medical DRGs. (C) *Percentage change in mean adjusted total direct variable cost per discharge relative to the preintervention mean, surgical DRGs. The upper and lower bounds denote the 3 SDs from the mean. The eighth consecutive point below or above the mean and all subsequent ones are indicated in yellow. Points outside the 3 SD range are indicated in red. Costs adjusted for DRG weight; all costs are denominated in September 2011 dollars. CL, center line; DRG, diagnosis related group.
In the ITS analysis, fully adjusted total variable direct costs per case declined an average of 0.22% per month relative to baseline trends (95% CI −0.31 to −0.13), which was partially offset by a non-significant early increase of 1.95% (95% CI −0.12 to 4.06) in costs. This resulted in a net overall reduction in costs of 7.7% by the end of the study period relative to the expected cost without intervention (table 3). The medical cohort declined an average 0.20% per month (95% CI −0.33 to −0.08), while the surgical cohort declined 0.37% per month (95% CI −0.48 to −0.26). In dollar terms, these savings were equivalent to approximately $59.3 million overall ($10.3 million for medicine and $49.0 million for surgery patients). Intervention costs were approximately $1.5 million per year ($5.375 million in the study period), making net savings approximately $53.9 million.
Cost outcomes from interrupted time series analysis
Our wage and CMI-adjusted expense per discharge dropped from 13% above the 50th percentile for COTH hospitals in 2014 Q1 to 2% above the 50th percentile in 2017 Q4. Cleverly and Associates data showed that by the end of 2016 our inpatient Medicare loss per case was close to average for academic medical centres.
LOS in days decreased by 0.25% per month relative to prior trends (95% CI −0.34 to 0.17), which represents an 11.8% relative decline over the course of the study period, or a decrease of approximately half a day (table 4).
Length of stay, readmission and mortality outcomes from interrupted time series analysis
We did not find any statistically significant changes in the counterbalancing outcomes of 30-day same-hospital readmission rates and in-hospital mortality rates (table 4). On Hospital Compare, NYULH currently has a better than national average hospital-wide readmission rate and better than average mortality in three of the six reported conditions. Moreover, NYULH is currently ranked five stars (the maximum) in overall Medicare quality—an aggregate of 57 quality measures.
Discussion
In this paper, we show impact of an institution-wide approach to increasing the value of healthcare provision at a large, urban academic medical centre. Over a 3-year period, NYULH chartered 62 institutional and 12 departmental value-focused projects at its flagship hospital. This initiative was associated with a 7.7% drop in mean monthly variable direct cost per case, cutting institutional expenses by $59.3 million to date, and moving NYULH from a high-cost to a median-cost institution while avoiding any negative impacts on 30-day same-hospital readmissions or in-hospital mortality. In fact, publicly reported, risk-adjusted, nationally benchmarked Medicare measures show that NYULH currently has better than average national performance on those measures and is ranked five stars for quality.
The VBM project differs from other institutional value initiatives in a few key aspects. It integrates the cost-accounting strengths of some initiatives7 with the clinician-led and front-line-driven agenda of others.8 It does not consist of a few high-profile, major projects, but rather dozens of smaller ones. Moreover, unlike most other published programmes, this initiative was institution-wide, not limited to a particular department.
A variety of factors may have contributed to our success. First, the programme was launched by the Dean and CEO and sponsored by the chief operating officer (both physicians), ensuring resource support and signalling that this was an institutional priority. Second, we took a strictly data-driven and transparent approach. We quantified and broadly shared our baseline, unsustainable growth in Medicare losses, making the need for change visible across the institution. Our rigorous cost-accounting system allowed us to accurately capture costs and revenues in buckets that were meaningful to clinicians, helping us to identify intervention opportunities, and to capture changes on a monthly basis for project-specific tracking. A centralised dashboard made results visible even down to the individual unit, patient or physician level. Third, to motivate clinicians for improvement we compared ourselves whenever possible with other high-quality but lower cost academic medical centres. Fourth, we continually focused on achieving value, not cost reduction. Every project tracked both cost and quality outcomes. These commitments enabled us to gain support from front-line clinicians. Fifth, strong support from our chief information officer and medical centre information technology (IT) group enabled rapid implementation and iteration of IT-related interventions: crucial to most of the projects. Sixth, assigning an MD and an MBA to co-lead the overall initiative, and having a physician work closely with project management for each chartered project, ensured that both a clinical and business perspective was consistently applied to each project and that results were relevant to both clinical and operational leadership. Seventh, the departmental shared savings programme aligned incentives between individual departments and the institution. Moreover, chartering many projects enabled us to involve more clinicians and promote more rapid and diffuse culture change. Finally, we invested in high-quality project managers, who are the lifeblood of our value initiative.
It is notable that cost reductions were not evident until several months into the programme. That may be because the programme involved a series of interventions launched at varying time points that each took time to take effect. It is also possible that some of the later interventions, such as the VBM dashboard made available to clinical chairs in November 2014, or the departmental incentive programme launched in September 2015, were more effective than those implemented earlier. Finally, because some costs are amortised over the course of a full year, there was also less opportunity to demonstrate major savings early in the intervention period, which began halfway into a fiscal year. Our choice of a single start date—the kick-off of the programme—therefore yields the most conservative estimate of impact, since very little happened immediately on kick-off. Had we defined the intervention period as starting later, such as in January 2015, we would have demonstrated a larger decline relative to preintervention costs. In addition, NYULH gave above-market salary increases in the intervention period, increasing variable costs more than CPI and partially obscuring savings; moreover, these increases were 19% greater than in the preperiod.
The nature of the wholesale systems redesign precluded randomisation or an untouched control group; accordingly, we cannot exclude the possibility that confounding factors such as secular trends may have influenced results. However, we account for preintervention trends and healthcare inflation, and our performance relative to peer institutions improved over time according to several sources. Average CMI increased in the postintervention period, which could be a result of artificial coding changes. However, we believe the CMI increase reflects actual increased severity of illness and expected cost for the following reasons: (1) results with and without CMI adjustment are qualitatively similar; (2) we also saw an increase in number of Medicaid patients and decrease in commercial patients: Medicaid patients tend to have higher severity of illness than commercially insured patients; (3) the intervention period included proportionally more surgical patients, who tend to have higher DRG weights because their hospitalisations are more expensive; (4) the emergency department reopening at three times its prior size overlapped with the intervention period: emergency patients are sicker and more costly than elective or urgent admissions; and (5) the Medicare two-midnight rule was implemented in October 2013, moving many low-cost short-stay admissions into observation class: this disproportionately affected the intervention period by removing low-cost patients from the denominator. An additional limitation is that this programme occurred at a single institution that began with higher costs than average; these results may not be achievable at other hospitals. Finally, we make no effort in this report to disentangle which specific projects may have been more effective than others. In part, it is difficult to assess individual projects in isolation: doing so may double-count benefits or miss spillover effects. But more importantly, the goal of this report is to illustrate the approach and infrastructure necessary to produce a systematic change in cost structure at a major academic institution, rather than to make a case for specific projects. Other institutions will likely have their own idiosyncratic opportunities for improvement, which can be applied using the overall framework illustrated here.
Overall, we were able to achieve and sustain substantive cost savings at a major academic medical centre while maintaining quality of care, thereby increasing the value of care provided. In an era of increasing value consciousness, our programme provides a template for effective conduct of similar work at other institutions.
References
Footnotes
SCC and FMV contributed equally.
Twitter @leorahorwitzmd
Contributors SCC, FMV and NMA led the intervention, obtained data and drafted and revised the paper. KK and SAJ designed the analysis, analysed the data and drafted and revised the paper. FF, PCS and RAP supervised the intervention and revised the paper. LIH designed the analysis, analysed the data, drafted and revised the paper and provided supervision for the evaluation. As the guarantor, LIH accepts full responsibility for the work and/or the conduct of the study, had access to the data and controlled the decision to publish. The corresponding author (LIH) attests that all listed authors meet authorship criteria and that no others meeting the criteria have been omitted.
Funding The authors have not declared a specific grant for this research from any funding agency in the public, commercial or not-for-profit sectors.
Competing interests All authors are employees of the institution in the study.
Patient consent for publication Not required.
Provenance and peer review Not commissioned; externally peer reviewed.