Article Text

Abstract
Objectives To determine whether sharing of routinely collected health service performance data could have predicted a critical safety failure at an Australian maternity service.
Design Observational quantitative descriptive study.
Setting A public hospital maternity service in Victoria, Australia.
Data sources A public health service; the Victorian state health quality and safety office—Safer Care Victoria; the Health Complaints Commission; Victorian Managed Insurance Authority; Consultative Council on Obstetric and Paediatric Mortality and Morbidity; Paediatric Infant Perinatal Emergency Retrieval; Australian Health Practitioner Regulation Agency.
Main outcome measures Numbers and rates for events (activity, deaths, complaints, litigation, practitioner notifications). Correlation coefficients.
Results Between 2000 and 2014 annual birth numbers at the index hospital more than doubled with no change in bed capacity, to be significantly busier than similar services as determined using an independent samples t-test (p<0.001). There were 36 newborn deaths, 11 of which were considered avoidable. Pearson correlations revealed a weak but significant relationship between number of births per birth suite room birth and perinatal mortality (r2 =0.18, p=0.003). Independent samples t-tests demonstrated that the rates of emergency neonatal and perinatal transfer were both significantly lower than similar services (both p<0.001). Direct-to-service patient complaints increased ahead of recognised excess perinatal mortality.
Conclusion While clinical activity data and direct-to-service patient complaints appear to offer promise as potential predictors of health service stress, complaints to regulators and medicolegal activity are less promising as predictors of system failure. Significant changes to how all data are handled would be required to progress such an approach to predicting health service failure.
- patient safety
- governance
- healthcare quality improvement
- incident reporting
- obstetrics and gynecology
Statistics from Altmetric.com
Summary box
What is known
There have been repeated calls for improved data sharing following critical health service failures the world over.
Medicolegal risk data including practitioner notifications, claims and patient complaints have previously been applied to patient safety risk monitoring.
What this study adds
There is an association between rapidly increasing clinical activity and safety failure.
Variation in routine clinical activities, in this case emergency transfers, may offer an alert to service failure.
The sharing of practitioner notifications, consumer complaints to statutory bodies and medicolegal activity does not appear to inform prediction of health service failure.
Introduction
As many as 1 in 1o patients suffers some sort of complication or adverse event during their hospital admission.1 The prevalence of preventable patient harm has recently been estimated as 6%.2 However, all too often these harms are not visible until either an individual incident is severe enough or a large enough series of incidents are amassed to trigger a formal review, such as that occurred in England at Bristol, Mid Staffordshire and Morecambe Bay.3–6 Similar service failures in Australia have occurred at King Edward Memorial Hospital in Western Australia, in the Queensland public hospital system, and more recently in a small Victorian maternity service.7–9 Sadly, there are some striking similarities in the findings and recommendations of the reviews that followed each of these tragedies. First, harm did not arise from health practitioners who were purposefully uncaring or who deliberately set out to injure patients. Health service failures occurred when the clinical governance systems either didn’t operate effectively or were absent. Second, in each case there was poor workforce culture. For patient safety to flourish a psychologically safe and curious workforce is required.7 9 Frequent open sharing of mistakes and inquisitive reflection on episodes of suboptimal care are necessary components of a safe health service and a so-called ‘safety culture’. Last, there was deficient or absent routine monitoring of patient safety data such as complaints or incidents.4 6 9
Most modern health services and systems monitor near misses and adverse events and attempt to learn from harm through the use of incident reports, both at local and system levels. The utility of incident reporting has been a topic of debate and incident reporting alone is not likely to be sufficient to prevent healthcare associated harm.10 Beyond incident reports, health systems, including the UK National Health Service, have long collected outcome data such as patient mortality and applied these data to detect outlier services with safety concerns.11 A review into state-wide clinical governance in Victoria, triggered by the aforementioned maternity service failure, recommended that multiple and diverse safety performance data, including medicolegal claims, patient complaints and complaints against health practitioners, and outcomes data be shared and analysed jointly to better inform preventative efforts.9 Whether such an approach can actually improve the detection of safety risks at a health service level has not yet been tested.
We set out to do just that. In the setting of a landmark maternity service failure in Victoria, Australia, we sought to ask whether sharing routinely collected, diverse patient safety data feeds could have identified the problem earlier and therefore possibly have prevented harm to patients. This service failure occurred at a small, inner regional level 3 maternity service12 13 at which a cluster of perinatal deaths occurred in 2013–2014. This cluster was detected incidentally in 2015 by the Consultative Council on Obstetric and Paediatric Mortality and Morbidity (referred to as the Consultative Council), an independent state authority charged with reviewing and classifying all perinatal deaths. In turn, the Consultative Council informed the Secretary of the Department of Health and Human Services who commissioned an independent review into the maternity service. That review identified major clinical governance deficiencies at the hospital that raised questions about quality and safety governance in Victorian public hospitals generally, leading to an assessment of safety and quality assurance across the whole Victorian public hospital system.9 14
With a view to developing harm prevention strategies, we wished to explore whether the safety failings at the maternity service could have been identified earlier had there been a collective line of sight of all available safety risk information. Specifically, we aimed to bring together existing but separate sources of quality and safety data, including patient complaints relating to maternity care, medicolegal claims, notifications of health practitioners to the medical regulator, clinical activity volume, emergency neonatal and perinatal transfers, perinatal mortality, and sentinel events, to assess whether patterns and signals exhibited by the collective data could have created an earlier awareness of impending health service failure. To do this, we reanalysed the events leading up to the first recognition of the perinatal death cluster by the Consultative Council.
Methods
In this observational descriptive study, we collected data for the years 2000–2014, representing the 15 years immediately before the recognition of the service failure. Data were collected from each source for the whole study period or from the date of establishment of the respective agency if not available from 2000. Clinical volume data were collated for other maternity services equivalent in capability and size to the index hospital, as determined by the Victorian Maternity and Newborn Capability Frameworks.12 13 15
Data sources
Seven organisations collecting and holding quality and safety data were identified using a data-sharing framework developed as a specific response to the Targeting Zero report.16 These organisations were the Health Complaints Commission, the Victorian Managed Insurance Authority (referred to as the State Insurer), the Consultative Council on Obstetric and Paediatric Mortality and Morbidity, the Victorian Department of Health and Human Services, the Paediatric Infant Perinatal Emergency Retrieval (PIPER), the Australian Health Practitioner Regulation Agency (referred to as the Professional Regulator) and complaint records from the index hospital.
Consultative Council on Obstetric and Paediatric Mortality and Morbidity
Perinatal mortality data were provided by the Consultative Council on Obstetric and Paediatric Mortality and Morbidity. The Consultative Council is a ministerial advisory council previously supported administratively by the Department of Health, and now by Safer Care Victoria. Under the Public Health and Wellbeing Act (2008), the Consultative Council is responsible for the state’s perinatal data collection and for perinatal safety risk monitoring. Annualised numbers of perinatal deaths from 2000 to 2014 were extracted and classified as either avoidable or unavoidable by two authors (EMW and TF). The Gestation Standardised Perinatal Mortality Ratio (GSPMR) was derived from the 2014–2015 Perinatal Services Performance Indicators report.17 The GSPMR is a 5-year rolling average of the ratio of the observed:expected perinatal mortality. It is published annually for all public and private Victorian maternity services. A detailed description of how the GSPMR is derived is available elsewhere.18 Briefly, it is calculated for each hospital by dividing the observed perinatal mortality rate at each completed week of gestation from 20 weeks onwards at the index hospital by the actual (state average) perinatal mortality rate for that completed week, and then combining the ratios for all weeks.18 A GSPMR of 100 indicates that a hospital’s overall perinatal mortality rate is equal to that of the state average. A ratio of 200 indicates that it is double the state average. We used the data for the 5-year epoch of 2009–2014, reflecting the epoch immediately before recognition of the problems in 2015. Avoidable and total perinatal deaths were converted to a perinatal death rate per 1000 total births for each year of the study period.
Department of Health and Human Services
Birth numbers and sentinel event notifications were obtained from Safer Care Victoria. Safer Care Victoria is an Administrative Office of the Victorian government, aligned with the Department of Health and Human Services and is responsible for healthcare quality and safety improvement in Victoria. It was established in 2017 as a specific response to the review of public hospital clinical governance.9 Numbers of births for 2000–2014, expressed as the annual total number of mothers giving birth, were derived for the index hospital and for other regional level 3 public maternity services that remain active today.12 13 Sentinel events are a nationally defined set of adverse events that result in either death or serious harm.19 20 Public health services are required to report all sentinel events to Safer Care Victoria. The number, date and description of all sentinel events reported by the index hospital for the period 2002–2014 were extracted. The number of birth suite rooms in each Victorian public maternity service was also provided by Safer Care Victoria. These data were subsequently used to calculate the rate of births per birth suite room for all level 3 maternity services for the period 2000–2014. The mean number of births and per birth suite room were calculated for level 3 services excluding the index hospital. Minimum and maximum birth numbers per year, and births per birth suite room were also calculated for these services.
Birth numbers and births per birth suite room for the year 2014 were extracted for all Victorian public maternity services and compared with GSPMR for 2009–2014.
Victorian Managed Insurance Authority
The Victorian Managed Insurance Authority is the public insurer for the state of Victoria. It underwrites all Victorian public health services. Medicolegal claims data were obtained from the State Insurer. Event counts were annualised by date of the event.
Australian Health Practitioners Regulation Agency
The Australian Health Practitioners Regulation Agency is the national regulator for 16 Australian health professions. Professional boards such as the medical and nursing and midwifery boards work in partnership with the Professional Regulator to deliver a national registration scheme set out by the Health Practitioner Regulation National Law (2009), enacted in each state and territory of Australia. Notifications made to the medical and nursing regulators against medical and midwifery personnel at the index hospital were obtained from the Professional Regulator. The total number of notifications was recorded from 2010, when the Professional Regulator was established until 2014.
Health Complaints Commission
The Health Complaints Commission is the state government body responsible for the receipt and investigation of healthcare complaints. Complaint notifications were obtained from the Health Complaints Commission through a manual file review of all maternity service related patient complaints arising from the index hospital. Event counts were annualised by incident date and charted for the entire study period.
Index hospital
Free text summaries of all complaints relating to the maternity service were provided by the index hospital. Event counts were annualised by incident date and charted for the entire study period.
PIPER service
PIPER is the Victorian emergency retrieval service for pregnant women, newborn babies and children. Emergency perinatal (in utero) and neonatal transfer data were provided by PIPER for both the index hospital and for all other level 3 maternity services. Transfer date and indication(s) for each transfer were collected. Neonatal transfer data were available for 2002–2014 and perinatal transfer data for 2006–2014. The indications for neonatal transfers were classified into 11 categories using the six-step method identified by Zhang and Wildemuth:21 intrauterine growth restriction, haematological, jaundice, hypoglycaemia, fetal compromise, infection, congenital abnormality, prematurity, respiratory complication, unknown and other. The indications for perinatal transfers were classified into 12 categories: placental complications (inc. antepartum haemorrhage and vasa praevia), postpartum haemorrhage, growth restriction, fetal compromise (including fetal death in utero), acute medical condition, multiple pregnancy, pre-eclampsia or eclampsia, preterm prelabour rupture of membranes or preterm labour, other, and unknown.
Statistical analyses
All baseline birth, notification and transfer data were compiled in MS Excel (Microsoft, Seattle, Washington, USA). All statistical analyses were conducted using SPSS Statistics (IBM, Armonk, New York, USA). An independent samples t-test was conducted to assess the difference in mean births per birth suite room between the index hospital, and the average of other level 3 maternity services. A birth rate per birth suite room was calculated for the index hospital and other level 3 maternity services. Perinatal mortality was converted to a rate per 1000 total births by baby. Simple linear regression and Pearson correlations were undertaken to examine the relationship between both birth number and GSPMR, and births per birth suite and GSPMR. Neonatal and perinatal transfers were converted to transfer rates per 1000 births. Normality of transfer rate distribution was assessed for both neonatal and perinatal transfers using Shapiro-Wilk tests for normality. Differences in mean transfer rate were assessed using independent samples t-tests. Transfer indications were assessed as a percentage of all transfers, and as a rate per 1000 births for both neonatal and perinatal transfers.
Results
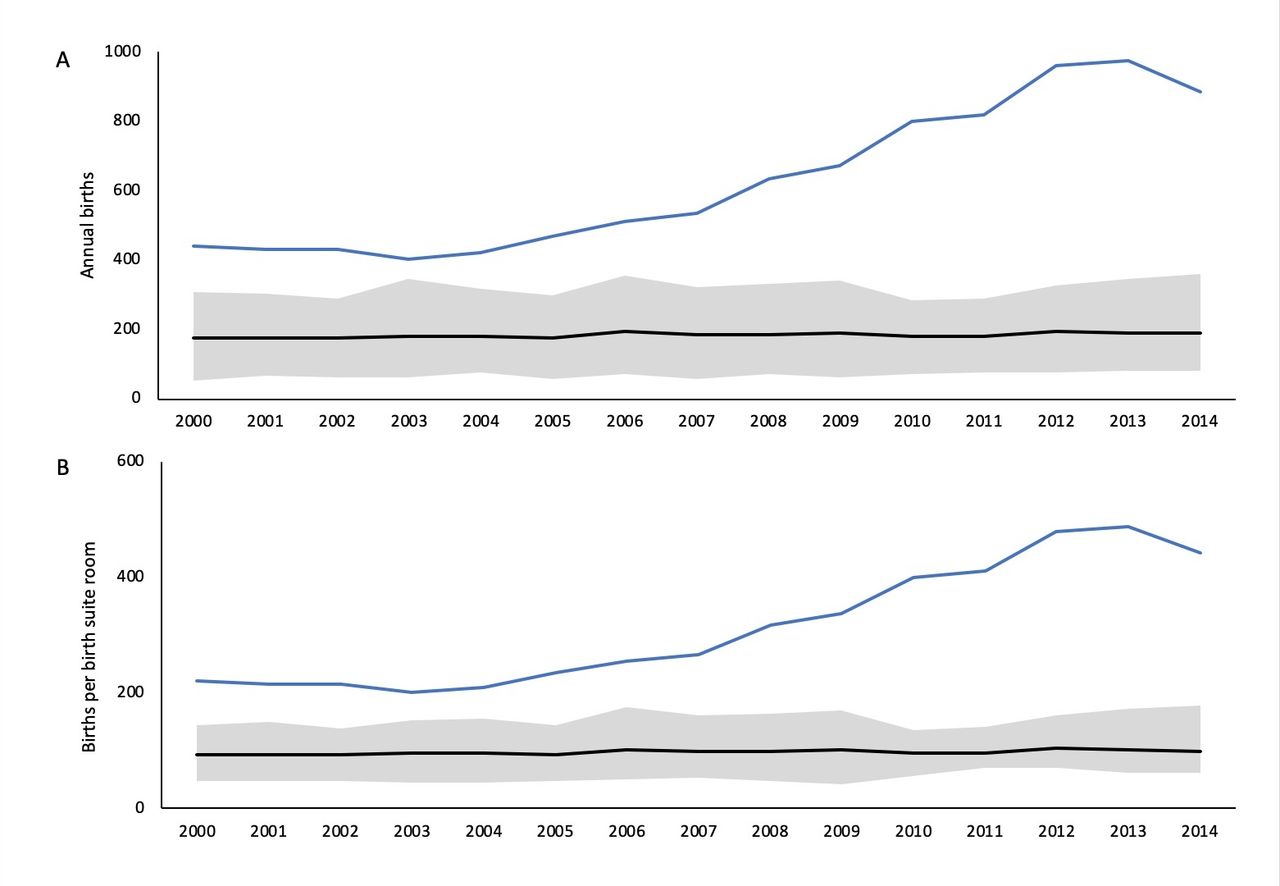
Between 2000 and 2014 there were 9401 births at the index hospital. Over this period there were 36 newborn perinatal deaths, of which 11 were assessed as being avoidable (by EMW and TF), 7 occurring in the final 2 years of the study. The overall perinatal mortality rate for the hospital from 2000 to 2014 was 3.83 per 1000 births (figure 1A). The 2010–2014 GSPMR for the index hospital was 204.6. This was the highest of any Victorian maternity service at that time (figure 1B). Between 2000 and 2014, the number of births per year at the index hospital more than doubled from 441 to 975. Much of the increase occurred between 2006 and 2013 (figure 2A). Over the same period the average number of births at the other level 3 maternity services remained stable (figure 2B). The number of births per birth suite room at the index hospital increased from 220 in 2000 to 488 in 2013, significantly higher than the average number of births per birth suite room in other level 3 services (mean 313.3 compared with 98.2, conditions t(28)=7.904, p<0.001, figure 1).
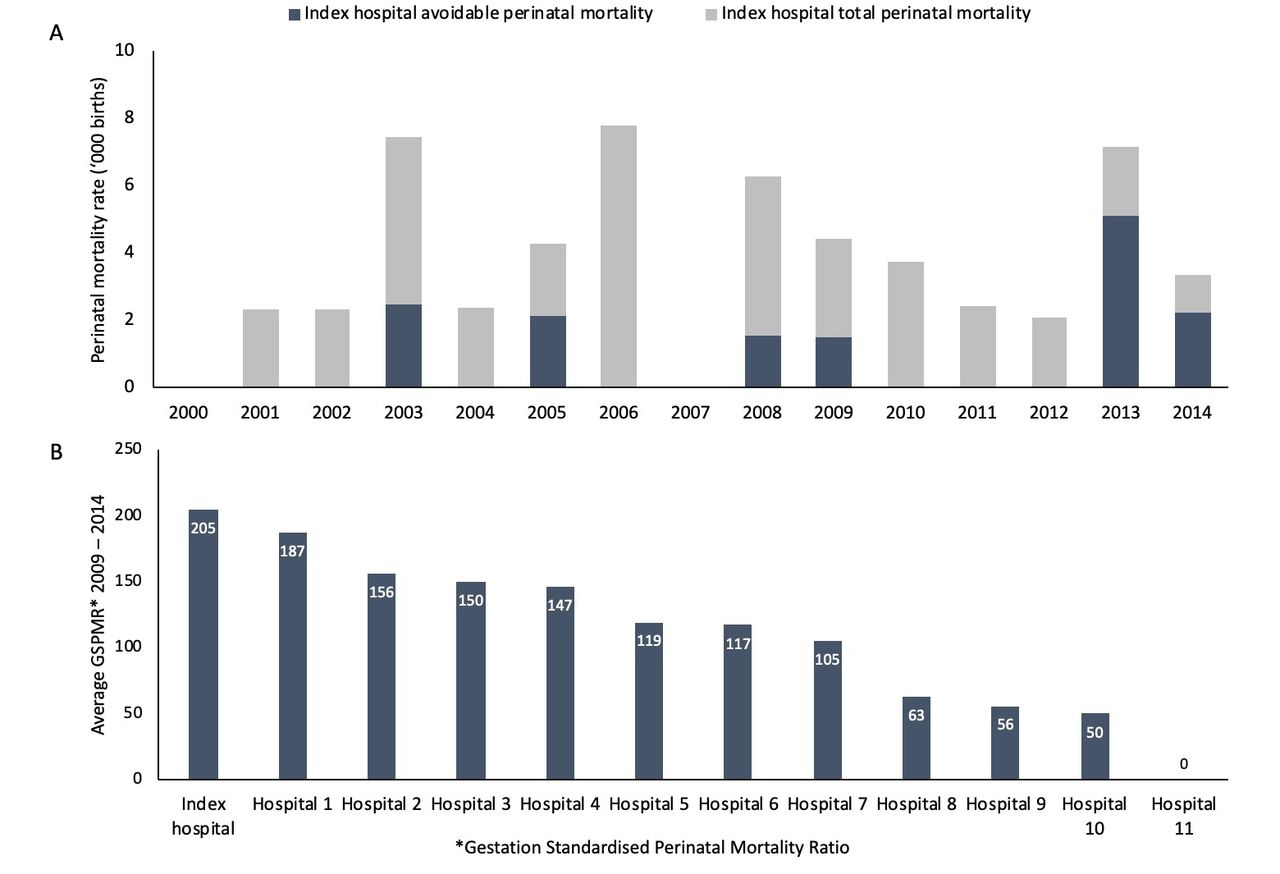
Annual perinatal mortality (A) and average annual Gestation Standardised Perinatal Mortality Ratio (GSPMR) for level 3 maternity services (B).

Annual births from 2000 to 2014 (A) and annual births per birth room (B). The blue line represents the index hospital, the black line represents the mean of other level 3 services and the grey zone represents minimum and maximum ranges.
Figure 3 summarises the 2010–2014 GSPMRs by numbers of births per hospital (figure 3A) and by births per birth suite room (figure 3B) for all Victorian maternity services. There was a wide variation in the GSPMR across services with fewer than 500 births per annum. There was no significant correlation between annual birth volume and GSPMR for all Victorian services (r2 =0.025, p=0.3) but there was a significant positive correlation between births per birth suite room and GSPMR for all maternity services (r2 =0.18, p=0.003).
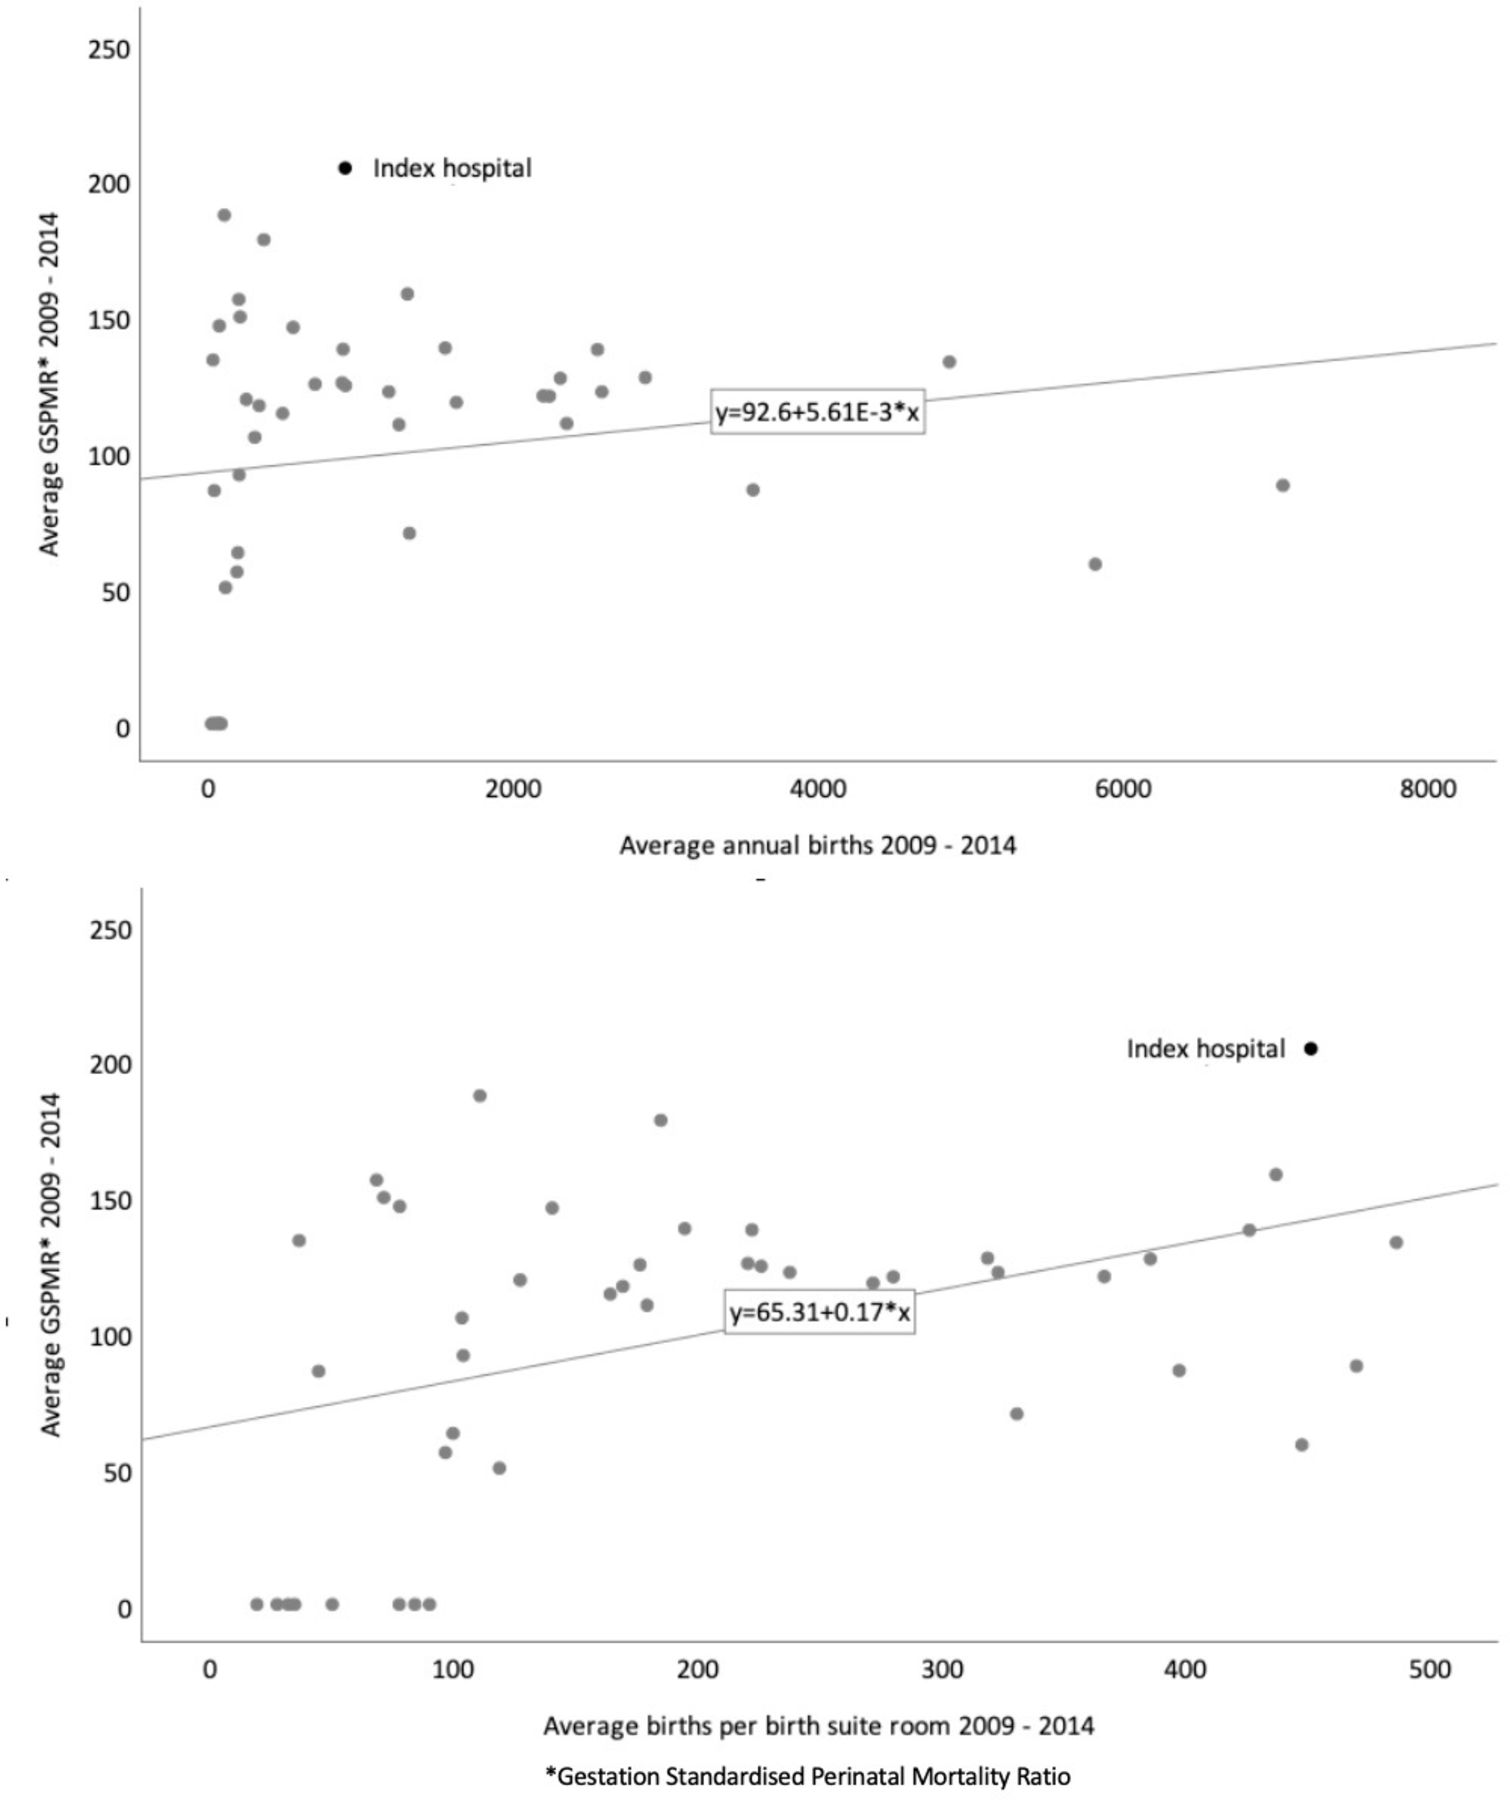
Scatter plot of average annual Gestation Standardised Perinatal Mortality Ratio (GSPMR) from 2009 to 2014 and average annual births (A) and annual births per birth room (B).
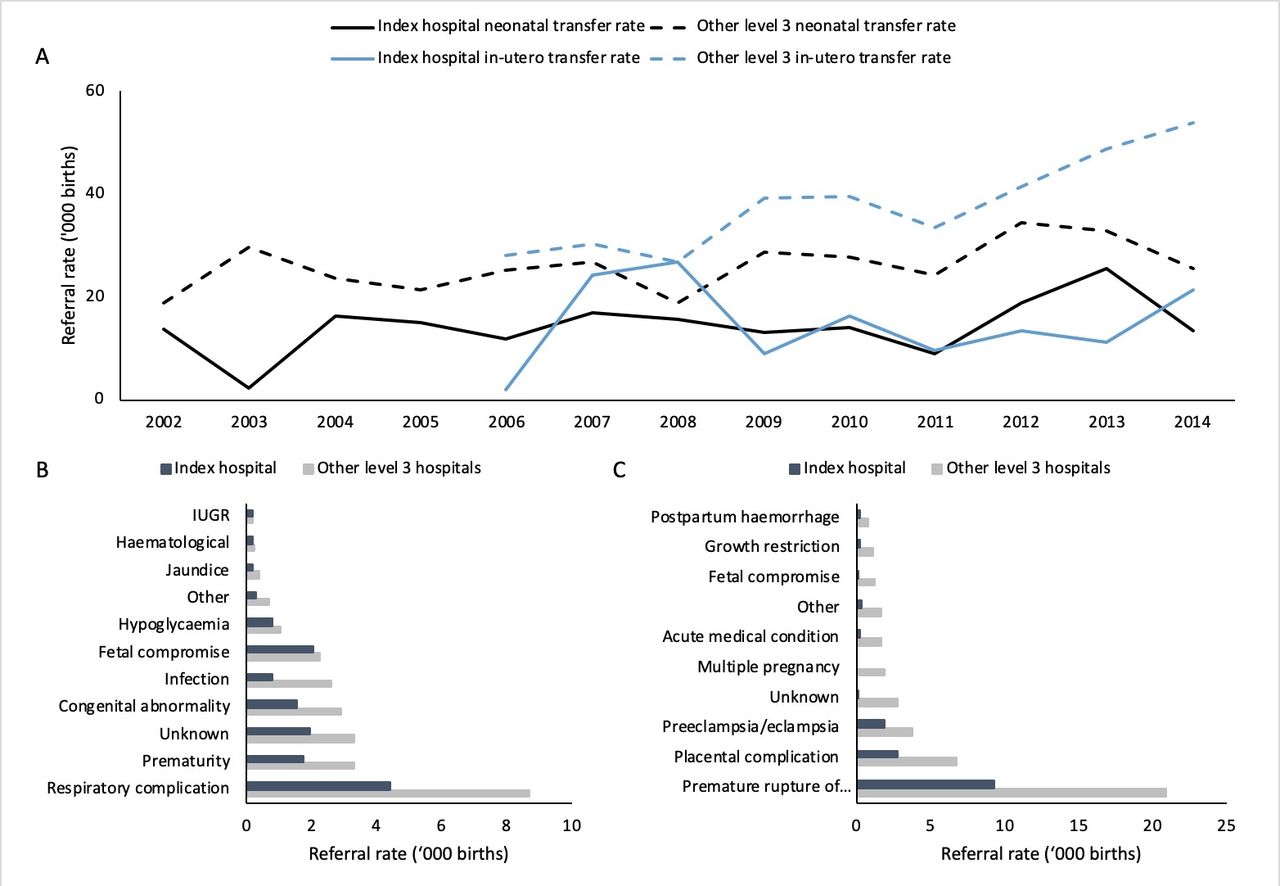
There were 112 emergency neonatal transfers between 2002 and 2014, and 101 emergency in utero transfers from 2006 to 2014. The mean (SD) rate of both emergency neonatal transfers and emergency in utero transfers from the index hospital to a higher capability service were significantly lower than that for other level 3 maternity services (14.3 (5.3) per 1000 compared with 26.0 (4.8), p<0.001; 14.9 (8.1) per 1000 compared with 38.0 (9.3), p<0.001, respectively. figure 4A). Averaged across the 12 years for neonatal transfers and the 8 years for perinatal transfers, the transfer rates at the index hospital were 45% and 61% lower, respectively, than other level 3 hospitals (both p<0.001). There were significant differences in the rates of the indications for each type of emergency transfer between the index hospital and other level 3 hospitals (figure 4B,C). The rate of neonatal transfers from the index hospital for respiratory complications, prematurity, congenital abnormalities, infection, jaundice, other and unknown indications were about half those from other level 3 hospitals. The rates for perinatal transfers for all indications from the index hospital were significantly lower than from other level 3 services.

Neonatal and perinatal transfer rates (A), neonatal transfer indications (B) and perinatal transfer indications (C). IUGR, intrauterine growth restriction.
Table 1 summarises patient complaints and medicolegal claims. There were 71 notifications related to the index hospital, including 15 medicolegal claims, 8 complaints to the Health Complaints Commission and 48 direct-to-service complaints. There was an increase in the number of direct-to-service complaints from 2011. No sentinel events were reported by the hospital in the period. There were five practitioner notifications to the Professional Regulator between 2010 and 2014, three in 2013 and two in 2014. Medicolegal claims and complaints to the Health Complaints Commission occurred sporadically throughout the duration of the study without any apparent pattern.
Medicolegal claims and complaints by year leading up to point of service failure (2013/2014)
Discussion
In Victoria there is no precedent for the sharing of patient safety data in the manner that we have tried to do here. Consequently, this was a challenging study to undertake. Understandably, there were some legislative and privacy constraints on how much data the various agencies were able to share. Of the seven different sources of data, the clinical activity (both volume and patient transfers), and direct-to-service patient complaints appeared to be the most promising as potential predictive signals. However, for direct-to-service complaints, comparator data would need to be further investigated before their predictive capacity can be assessed. The other more centralised patient safety data held by the regulators—complaints to the Health Complaints Commission, medicolegal claims to the State Insurer, notifications to the professional regulator and sentinel event reporting to Safer Care Victoria—were not informative as currently collected.
The increase in the direct-to-service patient complaints in the years immediately before the perinatal death cluster in 2013–2014 offers some promise of this as a safety signal. Perhaps this wasn’t surprising. Better integration of patient complaints data into the quality surveillance and improvement process has been a recurrent recommendation of numerous reviews of critical health service failures.3–5 8 9 It begs the question why the increasing number of maternity complaints at this service, although small in number, didn’t trigger concern locally. It would seem that, as is common in such service failures,2 3 8 a lack of governance and appropriate oversight of patient complaints at the health service level obscured the trend. We suggest that the promise of patient complaints as a safety signal will likely only be fully realised if they are reported to a central system manager, either as the primary complaints process or in addition to local reporting. This would allow patient complaint frequency and content to be collated and analysed by a central safety assurance body, adding a central assurance function to local complaint management and response activity. This would also address a key limitation of direct-to-service complaints data in our analysis—the lack of comparator data from similar health services. If one system manager had visibility of complaint behaviours across all services, it is possible, though untested, that signals of health service stress would become more visible.
We also identified that a measure of clinical volume relative to service capacity—births per birth suite room—was associated with increased perinatal mortality, particularly in the setting of the rapidly increasing workload without increasing infrastructure. By 2013 the index hospital had nearly 1.5 times more births per room than the 375 births per room per year specified by the Australasian Health Facility Guidelines.22 Increasing volume has previously been highlighted as a contributing factor to major service failure.3 6 7 However, increasing volume is not in itself inherently harmful provided infrastructure, both facility and workforce, grow in parallel. This is reflected here in the lack of a relationship between volume per se and perinatal mortality. The risk of harm appears more related to volume relative to service capacity. Including the index hospital, there are six Victorian maternity services with more than 400 births per room per year. Of these, four have a GSPMR above 130. While we have used births per birth suite room as a measure of clinical capability, capability also encompasses workforce skills and culture. We were unable to explore staffing profiles, number and skill mixes, but acknowledge that it would be useful to do so. In the very least, it would be interesting to compare the hospitals with very high numbers of births per room and a low GSPMR with similar volume services with a high GSPMR. Nonetheless, our observations suggest that it may be worthwhile to develop a small suite of measures of volume stress that could be used to prevent patient harm and service failure. In the first instance we suggest that measures could be simply based on ‘activity per room’ measures to include high-risk areas such as maternity, emergency departments and operating theatres. In time, workforce domains, number and expertise, could be added.
We were surprised that emergency neonatal and in utero transfers from the index hospital were significantly less frequent than transfers from other level 3 maternity services. We had expected that, given the known safety failures, emergency transfers of unwell newborns would have been more common from the index hospital than from other like services. This was clearly not the case and we cannot explain why. Nonetheless, the variations in both transfer rates and indications from the index hospital compared with other level 3 hospitals offers the potential for the development of a safety signal.23 To our knowledge, no one has previously suggested using neonatal transfer rates in this manner. As with patient complaints, to be effective, such data would most likely need to be reported and analysed centrally.
We only had data from the Professional Regulator from 2010, when it was established. Despite the recency of the data source, that there were five practitioner notifications in 2013–2014 and none prior, raises its potential from the perspective of developing a safety signal.24 Using data from the Professional Regulator, others have developed an effective tool to identify high-risk individual practitioners.25 26 However, due to the small number of notifications and lack of comparator data from similar services, this will require further assessment before notification frequency to identify high-risk services can be deemed reliable.
A number of the data sources we assessed did not appear to be useful as safety signals. Data from the Health Complaints Commission, the State Insurer and sentinel events weren’t useful as leading indicators. There may be a number of reasons why these particular data did not prove useful. Complaints to the Health Complaints Commission rely on consumer awareness and a culture that supports consumers to speak up about their care. Following mass publicity of healthcare harms there is typically an increase in complaints to the Health Complaints Commission. That happened in this case with a very large number of complaints being made after the hospital’s problems were made public. Similarly, the barriers to using sentinel events relate to poor reporting culture, and reporting being dependent on health service culture. The challenge in using medicolegal claim data for quality improvement is driven by the delay in claims being filed from the time of the loss or injury, a factor reported by others.24 While none of these factors preclude these data from being analysed for quality improvement lessons, they limit their use in a predictive capacity.
A strength of this study was the unprecedented access we had to a highly sensitive data, collected by diverse agencies in the healthcare system—providers, regulators, funders and insurers. Our findings are likely to be generalisable to other Australian health settings, and we believe, to other similar public healthcare systems including the UK National Health Service. The highly sensitive nature of the data we were accessing was also an important limitation of our work. Apart from the clinical activity data we did not have access to comparative data from other health services for complaints and notifications. This will be necessary if event frequency or rates are to be derived to develop safety signal thresholds. We also faced limitations in the immaturity of the measures of harm available to us. For many analyses we have used mortality as a crude measure of harm, though we acknowledge that there are many ways in which mothers can experience terrible obstetric care without dying or having their babies die. We attempted to capture some measures of morbidity using emergency neonatal transfers for this purpose. Ideally, while these data were not available to us, we would have liked to include measures of patient satisfaction and staff culture in our assessments to provide a more holistic impression of harm. Such measures are collected in Victoria through the Victorian Health Experience Survey and People Matter Survey, respectively. There is good evidence that a positive workplace culture is related to improved patient outcomes and experience,27 and that positive patient experience (as determined through Patient Reported Experience Measures) is associated with improved health outcomes.28 29 It may be worth exploring these data as additional signals for patient safety. Additionally, safety systems encompassing patient and staff experience would also benefit from the inclusion of ‘soft intelligence’ such as safety concerns raised by whistle-blowers and practitioner behaviour or performance reviews.30 31 In a perfect system we would have liked access to far more granular data, and future studies would benefit from encompassing both staff culture and satisfaction, and patient outcomes and experience into their analysis.
We suggest that our findings merit further development of the use of routinely collected safety data from a range of sources as quality assurance measures. Such development should include consideration of specificity—how weak are the signals we can tolerate?—as well as the sensitivity that we have explored here. In essence, it will be necessary to establish where alarm thresholds lie for many of the data sources we have investigated. These thresholds will likely only become clearer as we progress to a less siloed system of patient safety risk monitoring and provide the system more open access to comparator data. There will certainly need to be tolerance for poor specificity, particularly in start-up phases. It will also be important to estimate costs of establishing and running the data sharing and analytics capabilities that would be required for the approach we are suggesting. Would such an approach be more or less expensive, and more or less effective, than the extensive case-by-case reviews and investigations that are currently the foundations of safety monitoring?
There remain many challenges to implementing these findings as performance measures and regulatory signals, and we don’t yet have clear answers on what signals will be useful. Despite this, our experience is that the sharing of data between agencies has built a trust between them that has generated enthusiasm for and confidence in creating weak signals as a new dimension to system safety. A problem as complex as healthcare-associated harm will need a coordinated approach, synthesising risk information from data sources such as those presented here and must encompass both weak signals and soft intelligence. Much work remains to be done but, as is true in healthcare itself, we are convinced that prevention is better than cure.
Footnotes
Twitter @BenNowotny, @euan_wallace
Contributors BMN and EMW contributed to the conception, data collection, analysis and writing of the manuscript. MD-T, BS, MS, EC, KC, MF, ES, TF, SA and LM all contributed to the collection of data and writing of the manuscript.
Funding EMW is funded by a National Health and Medical Research Council (Australia) Program Grant.
Competing interests None declared.
Patient and public involvement statement No patient or public involvement was sought for this project.
Patient consent for publication Not required.
Ethics approval Human research ethics approval for the study was granted by Monash University Human Research Ethics Committee (HREC EC00382, project 8016). The Royal Children’s Hospital Melbourne Human Research Ethics Committee gave permission for the use of neonatal and perinatal transfer data (HREC EC00238, project 37054A).
Provenance and peer review Not commissioned; externally peer reviewed.
Data availability statement No data are available. Due to the confidentiality requirements of data source agencies and human research ethics approval we will be unable to share source data. There is no discrete patient group to whom the findings can be disseminated.