Article Text

Abstract
Objectives To evaluate whether distance and estimated travel time to hospital for patients undergoing emergency laparotomy is associated with postoperative mortality.
Design National cohort study using data from the National Emergency Laparotomy Audit.
Setting 171 National Health Service hospitals in England and Wales.
Participants 22 772 adult patients undergoing emergency surgery on the gastrointestinal tract between 2013 and 2016.
Main outcome measures Mortality from any cause and in any place at 30 and 90 days after surgery.
Results Median on-road distance between home and hospital was 8.4 km (IQR 4.7–16.7 km) with a median estimated travel time of 16 min. Median time from hospital admission to operating theatre was 12.7 hours. Older patients live on average further from hospital and patients from areas of increased socioeconomic deprivation live on average less far away.
We included estimated travel time as a continuous variable in multilevel logistic regression models adjusting for important confounders and found no evidence for an association with 30-day mortality (OR per 10 min of travel time=1.02, 95% CI 0.97 to 1.06, p=0.512) or 90-day mortality (OR 1.02, 95 % CI 0.97 to 1.06, p=0.472).
The results were similar when we limited our analysis to the subgroup of 5386 patients undergoing the most urgent surgery. 30-day mortality: OR=1.02 (95% CI 0.95 to 1.10, p=0.574) and 90-day mortality: OR=1.01 (95% CI 0.94 to 1.08, p=0.858).
Conclusions In the UK NHS, estimated travel time between home and hospital was not a primary determinant of short-term mortality following emergency gastrointestinal surgery.
- health policy
- health services research
- hospital medicine
- surgery
Data availability statement
Data may be obtained from a third party and are not publicly available. NELA’s funder and the data controller for NELA data is the Healthcare Quality Improvement Partnership. For access to NELA data see: www.nela.org.uk/NELA_Research.
This is an open access article distributed in accordance with the Creative Commons Attribution Non Commercial (CC BY-NC 4.0) license, which permits others to distribute, remix, adapt, build upon this work non-commercially, and license their derivative works on different terms, provided the original work is properly cited, appropriate credit is given, any changes made indicated, and the use is non-commercial. See: http://creativecommons.org/licenses/by-nc/4.0/.
Statistics from Altmetric.com
Introduction
Emergency laparotomy is a common surgical procedure that is associated with high rates of death, complications and prolonged length of stay.1–4 The National Emergency Laparotomy Audit (NELA) has been evaluating the care and outcomes of patients requiring this type of high-risk surgery in England and Wales since 2013. Previous analyses have found considerable variation between hospitals in the provision of structures and processes which are associated with important clinical outcomes.5
Across secondary care, consideration has been given to concentrating specialist services in fewer centres that can provide higher quality care, particularly when pathways providing rapid access to definitive diagnosis and treatment are required. For example, improved outcomes following centralisation have been demonstrated in stroke,6 vascular surgery and trauma.7 There is also a well-established association between high hospital volume and improved outcomes in many different specialties and settings8–12; the number of emergency laparotomies undertaken per year at each of the 187 hospitals contributing to NELA varies between 0 and more than 300. The care of patients undergoing emergency laparotomy may also disrupt the care pathways of elective surgical patients.13 For these reasons, centralisation of emergency general surgical services may be justifiably considered by policymakers.
Despite the potential benefits, reconfiguration of specialist services inevitably increases the distance travelled by some patients to hospital and can disproportionately affect the ability of distant patients to access care.14 Therefore, before centralisation of services can be considered, it is also important for policymakers to understand the potential risks of increasing travel time for patients. The relationship between distance to hospital (or travel time) and mortality has been investigated for several emergency15–31 and non-emergency32 conditions but not for emergency laparotomy at a national level.
We have therefore undertaken an analysis of NELA data to investigate whether there is an association between travel and mortality for patients undergoing emergency laparotomy. Since patients undergoing emergency laparotomy have time-critical pathology and delays to surgery are harmful33–35 our hypothesis was that patients who take longer to reach hospital will have increased mortality and this effect will be most apparent in patients with greater surgical urgency.
The objectives of this study were to (1) describe the distribution of distance to hospital in the population undergoing emergency laparotomy, (2) describe how hospital and patient characteristics vary by distance travelled, and to (3) investigate the relationship between travel time to hospital and risk of mortality.
Methods
Study design
Observational study performed through secondary analysis of NELA data. The findings are reported according to the Strengthening the Reporting of Observational Studies in Epidemiology statement.36
Patient involvement
Patients were not involved in the design or implementation of this study. A draft of the study manuscript was presented to a patient representative appointed by NELA. His comments have been incorporated into the discussion. The results will be disseminated to the NELA lay representative committee.
Setting
NELA is a prospective national audit that collects data from all National Health Service (NHS) hospitals in England and Wales that perform emergency abdominal surgery.37 We derived our analysis data set from the NELA cohort of patients who underwent surgery between 1 December 2013 and 30 November 2016. We identified hospital characteristics from the 2016 NELA Organisational Audit.3 Our study exposure was calculated road travel time using aggregated patient home location as the start point and hospital postcode as the endpoint.
Participants
NELA intends to include all patients aged 18 or older with an NHS number who require an unplanned abdominal procedure on the gastrointestinal tract, excluding trauma laparotomies and procedures principally conducted to treat vascular, gynaecological or renal tract pathology. Comparison with Hospital Episode Statistics indicates that more than 80% of eligible cases have prospective data recorded through NELA.3
From this initial cohort, we then aimed to identify NELA participants for whom we could estimate travel time to hospital, whose emergency surgical pathology was likely to have been the reason for their hospital presentation and of sufficient urgency to be potentially affected by a travel delay. We therefore excluded the following patients: those who had surgery in hospitals not accepting emergency general surgical admissions; those who had an emergency laparotomy as a result of a complication after elective surgery on the same hospital admission; those who were admitted for more than 2 days prior to their emergency laparotomy; and/or those who did not require surgery within 6 hours of the decision to operate (as recorded at the time of booking on the NELA online case report form). We used aggregated patient home to hospital travel calculations on the assumption that patients travelled from their home to hospital as part of their acute care episode. We therefore excluded patients who did not attend one of the five closest hospitals to their aggregated home location as their travel estimations were likely to be unreliable. We did not have available data on actual journeys travelled or secondary hospital transfers. Our sample size was determined by the number of eligible cases.
Outcomes
The joint endpoints of this analysis were all-cause 30 and 90-day mortality, derived from death registration data supplied by the Office for National Statistics.
Calculated distance and travel time
Patient postcodes in the NELA data set are aggregated for anonymity and analysed at the level of lower layer super output areas (LSOA), which are units of UK census geography containing between 1000 and 3000 individuals.38 The postcodes of participants were geocoded to the population weighted centroid of their LSOA (n=22 117, 97%) or the first part of their postcode (outcode) (n=655, 3%) if only this was available. Hospitals were located using their full postcode obtained from NHS Choices and geocodes were obtained from the Open Geography Portal.39 Estimated travel time and distance were calculated between patient and hospital locations using Google Maps Distance Matrix API40 for car travel without traffic. (The estimation of traffic effects on ambulance transit times may not be accurate using commercial geographic information systems.41) For estimation of closest hospital to patient locations we constructed a matrix of straight line (Cartesian) distances between all patient and hospital locations. Straight line distances were used instead of road distances for reasons of cost and simplicity. To estimate total population proximity to hospital we used Office for National Statistics midyear population estimates 2018.42
Selection of covariates
Our primary research aim was to estimate the relationship between estimated travel time and mortality, controlling for the patients’ risk of death but being careful not to control for mediator variables that (although related to risk of death) may be causally affected by travel delays (eg, increased heart rate due to sepsis). The hypothesised causal relationships between variables are displayed in online supplementary figure 2.
Supplemental material
Candidate covariates were identified from the NELA risk adjustment model43 that has been developed and validated on the NELA cohort. In addition to variables from the NELA risk adjustment model we included time of hospital admission, time between hospital admission and arrival in the operating theatre, and index of multiple deprivation (associated with mortality after emergency laparotomy44) that was adjusted45 to allow inclusion of data from England (2015 data) and Wales (2014 data). A full list of the included and excluded covariates is available in online supplementary table 1.
The NELA data set contains date and time stamps for admission to hospital and arrival in operating theatre, but due to frequently missing clock time we dichotomised the interval from admission to arrival in theatre into <24 hours and 24–48 hours using exact time where available otherwise by calendar date.
Statistical methods
Baseline characteristics of the study population and hospitals are described in groups by minimum calculated road distances. We grouped interhospital distances into four categories and patient-hospital distances into three categories. Baseline normally distributed continuous data were described by mean with SD and non-normally distributed continuous data by median with range or IQR. Categorical data were summarised as number and percentage and grouped to avoid small numbers in categories.
Statistical modelling
The analysis plan was developed a priori although several authors were familiar with the data set and one author had conducted preliminary analysis of the travel time variable. Our primary analysis was to estimate the association between travel time and mortality using multilevel logistic regression models with the patient at the lowest level and a random intercept for hospital.
Missing data occurred in up to four covariates for 871 (3.8%) participants. We used multiple imputation by chained equations with 10 imputed data sets to account for these missing values assuming they were missing at random.46 The imputation model included all outcome and predictor variables including those that were excluded from our main analysis. Rubin’s rules were used to pool the regression coefficients and estimate their SEs. Further details of missing data handling and complete records analysis are in online supplementary table 2.
Estimated travel time was included as a continuous variable and, along with patient age, was winsorised at the 1st and 99th centiles. We report our results per 10 min units of estimated travel time. We prespecified non-linear transformations of covariates and interaction terms by using those included in the NELA risk adjustment model where applicable, these consisted of a linear plus quadratic term for age, an age with American Society of Anesthesiologists (ASA) interaction and an ASA with respiratory signs interaction.
Non-linear effects of the travel time variable were explored using a multivariable fractional polynomial approach.47 Multivariable models containing best fitting fractional polynomial transformations were compared with models containing less complex transformations and linear models, the likelihood ratio test was used to compare the models for fit. The α level for choosing a transformation was set at 0.05. Multilevel models included all covariates from the multivariable models regardless of significance.
Sensitivity analyses
To test the hypothesis that patients requiring the most urgent surgery are more susceptible to a travel time effect on mortality, we performed preplanned separate analyses on patients undergoing surgery with an urgency of within 2 and 6 hours. We performed further sensitivity analyses to test whether exclusion of patients based on closest hospital or winsorisation of the travel time variable affected our results.
All analyses were carried out in R V.3.6.3 for Windows.48 The following packages were used: ggmap, lme4, mice, mfp, rgeos, rgdal, tableone, tidyverse and sp.
Results
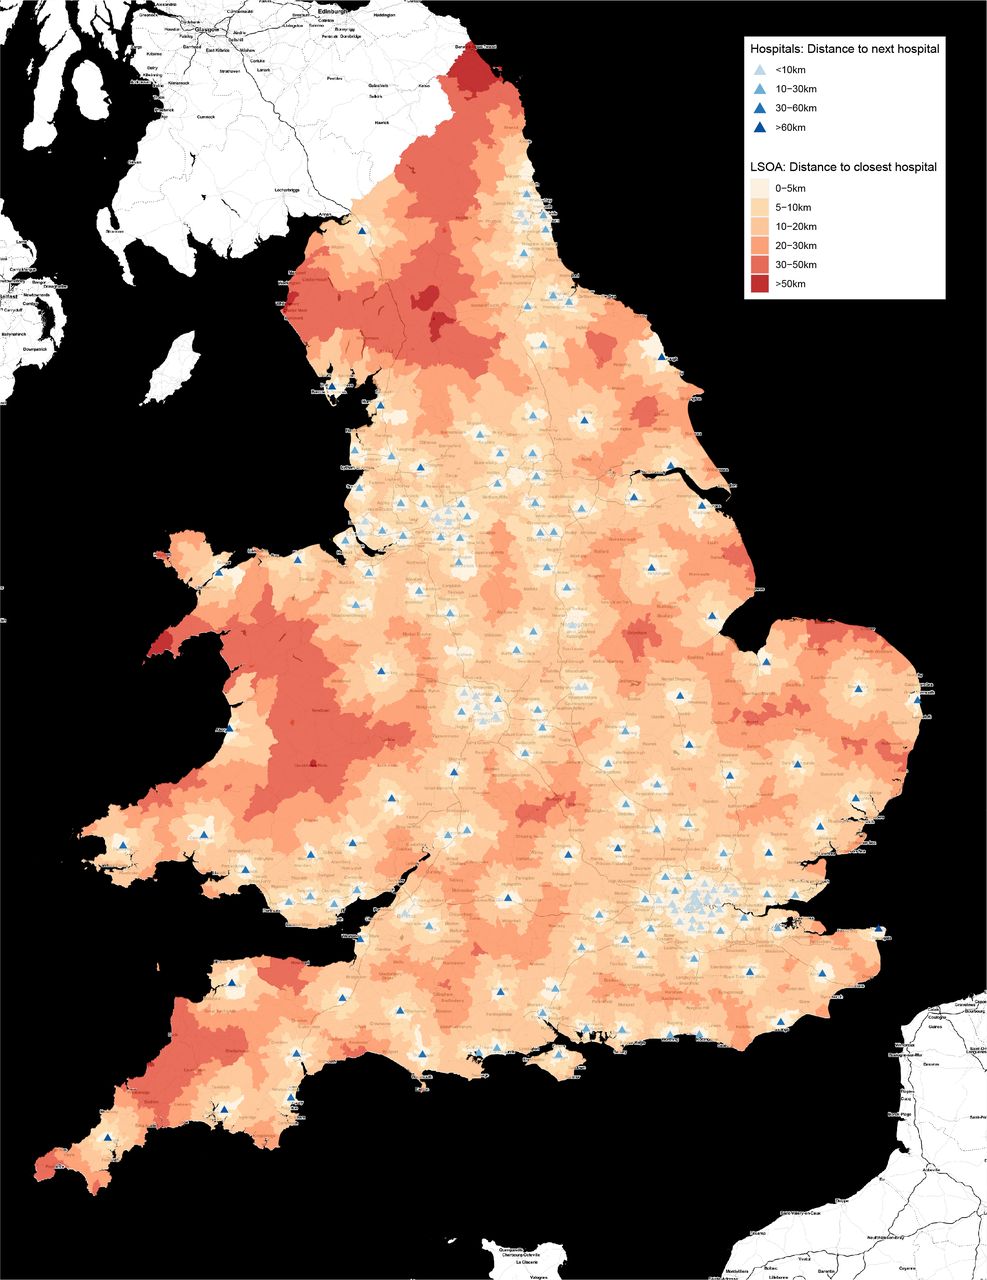
There were 171 hospitals in England and Wales that reported accepting acute general surgical admissions. Their spatial distribution is shown in figure 1 with population distance to hospital and distances between hospitals. 92.5% of the population of England and Wales live in an LSOA with centroid within 20 km of a hospital accepting acute general surgical admissions and over 99% within 40 km. Hospitals are clustered in areas of increased population density. Seventy per cent of the population have more than one hospital within 20 km of their home; 32% have five or more. Most hospitals are close to neighbouring centres. Seventy-one per cent of hospitals are located within 30 km of the next closest hospital, with only 8% having the next closest hospital more than 50 km away.

Map of the study area showing 171 hospitals in England and Wales that accept patients for emergency laparotomy. Background map image: Stamen maps. Includes Office for National Statistics data containing public sector information licensed under the Open Government License v3.0. LSOA, lower layer super output area.
The structural characteristics of hospitals arranged by road distance to nearest alternative provider are shown in online supplementary table 3. Compared with hospitals located in proximity to other centres, more remote hospitals are likely to have fewer beds and reduced case volume of emergency laparotomies. More remote hospitals are also less likely to be tertiary gastrointestinal surgery referral centres or to have ambulatory general surgical units.
The identification of cases for our study data set is described in figure 2. A total of 22 772 cases were available for analysis and of these 5386 were patients with the highest surgical urgency (surgery within 2 hours).

STROBE flow diagram. NELA, National Emergency Laparotomy Audit.
Travel distance
The median estimated patient journey distance to hospital was 9.0 km (IQR 4.9–18.0 km), the maximum (before winsorisation) was 169 km.
A total of 18 536 (81%) patients attended the closest hospital to their aggregated home location and 22 212 (93%) attended one of the three closest hospitals.
Older patients lived further from the hospitals at which they underwent surgery compared with younger patients. For patients with age greater than 80 years median distance was 9.5 km (IQR 5.0–18.8 km) compared with 7.7 km (IQR 4.2–15.8 km) for patients aged less than 50 years (p<0.001). Patients in areas of the greatest socioeconomic deprivation lived closer to the hospital at which they underwent surgery (median distance 6.0 km, IQR 3.6–10.9 km) compared with those in areas of least deprivation (10.9 km, IQR 6.1–18.0 km) (p<0.001). Table 1 shows the baseline characteristics of the study population.
Baseline characteristics of participants grouped by road distance to hospital (n=22 772)
Travel time and in-hospital time before surgery
Calculated road distance and estimated travel time were strongly correlated (Pearson’s r=0.935). The travel distances correspond to a median estimated travel time (without traffic) of 16 min (IQR 11–23 min) with a maximum of 127 min. For the 19 193 (84%) patients who had recorded and plausible timepoints, median time from admission to theatre was 12.7 hours (IQR 6.7–23.3 hours). Most of this time was between admission and decision for surgery (median 9.1 hours, IQR 4.3–19.0 hours) compared with between decision for surgery and arrival in operating theatre (median 2.3 hours, IQR 1.3–3.9 hours).
The relationship between estimated travel time to hospital and risk of mortality
Overall, 3340 (14.6%) patients died within 30 days of surgery and 4082 (17.9%) died within 90 days. The unadjusted relationship between estimated travel time and mortality is shown in online supplementary figure 1.
We found no evidence for a non-linear association between travel time and the log odds of mortality after adjusting for all covariates in a multilevel logistic regression. We therefore report estimates using a linear effect of time on the log odds of mortality. We found no evidence for an association between estimated travel time and mortality for patients undergoing surgery with an urgency of less than 6 or 2 hours in unadjusted and adjusted analyses (table 2).
Adjusted and unadjusted effects of estimated travel time on mortality expressed as OR per 10 min of travel time. Full multilevel models are shown in online supplementary tables 4 and 5
For the 22 772 patients categorised as requiring surgery within 6 hours (online supplementary table 4), the estimated adjusted OR for 30-day mortality per 10 min of travel time was 1.02 (95% CI 0.97 to 1.06, p=0.512) and for 90-day mortality the estimated adjusted OR was 1.02 (95% CI 0.97 to 1.06, p=0.472).
For the 5386 patients categorised as requiring surgery within 2 hours (online supplementary table 5) the estimated adjusted OR for 30-day mortality per 10 min of travel time was 1.02 (95% CI 0.95 to 1.10, p=0.574) and for 90-day mortality the estimated adjusted OR was 1.01 (95% CI 0.94 to 1.08, p=0.858).
The sensitivity analyses performed without limiting the inclusion to patients who had surgery in their local five hospitals (online supplementary table 6) and limiting to patients who attended their closest hospital only (online supplementary table 7) yielded similar results to the main analysis.
Discussion
Principal findings
We have conducted an analysis of 22 772 patients, controlling for important predictors, to test our hypothesis that increased travel time between patient home and hospital would be associated with reduced survival following emergency laparotomy. This hypothesis was not confirmed. Our estimates suggest that there is either no effect of travel time on short-term mortality after emergency laparotomy, or that any effect is small. This finding was unchanged when analysis was limited to the 5386 patients requiring the most urgent surgery—that is, within 2 hours of the decision to operate.
The estimated median travel time in this cohort was 16 min compared with a median time spent in hospital prior to surgery of 12 hours. This suggests travel time may be negligible compared with the time most patients spend on their overall journey to the operating theatre.
The 171 hospitals that accept emergency general surgical patients vary in their proximity to each other and in their capacity to provide structures and processes of care that are associated with improved outcomes. Evidence that contributes to understanding this variability in emergency care has implications for the ongoing reconfiguration of health services.
Strengths and weaknesses of the study
A key strength of this study is its originality and its comprehensiveness. This is the first study to examine travel time and distance for emergency laparotomy patients across England and Wales using the largest and most comprehensive prospectively collected data set available. The NELA data set contains detailed risk factor information data for patients undergoing emergency laparotomy which we were able to use for adjustment in analyses, unlike many other studies in this field.
There are also some weaknesses to this analysis. An important caveat when interpreting our findings is that NELA does not include patients who did not undergo surgery. If some patients were too unwell to be managed surgically due to delays reaching care, their exclusion would bias the estimate of the association between travel distance and mortality.
Our use of home to hospital travel calculations as a surrogate for prehospital delay also has several limitations. We did not have data on actual journeys travelled (patients may not have travelled from home) and were unable to control for potential confounders that were not in our data set including expedited ambulance transport and interhospital transfers. Prehospital delay is affected by several unmeasured factors including traffic, means of transport49 and the perceived quality of care.50 Road travel time provides only limited information about patient access to care and may not be representative of patients without private transport.51 The use of geographic information systems to estimate transport times has only moderate accuracy compared with actual recorded times52 and aggregation of patient home locations to the centroids of LSOAs or postcode outcodes further reduces the accuracy of our calculations. Since LSOAs and postcode areas are not of equal geographical size any inaccuracies in travel estimation will be greater in rural areas. It is possible that the categorisation of patients as ‘urgent’ in itself may partly depend on travel time, such that patients with longer journeys to hospital are more likely to be classified as ‘urgent’ and therefore more likely to be selected into our study cohort. However, a comparison of patients in different surgical urgency categories suggested that they had the same or similar travel times on average (online supplementary table 8). Since most travel times were short (upper quartile: 23.4 min) relative to the definition of urgency (under 2 and 6 hours, respectively), this potential selection bias is likely to be small.
Organisational and process factors such as tertiary hospital status and access to geriatrician services are associated with better outcomes, and were not controlled for in this study.5 We limited our analysis to patients undergoing urgent surgery with the expectation that many patients were likely to have been transported to hospital by ambulance; prehospital delay could also have a beneficial effect if it provided an opportunity for optimisation of deranged physiology.
We also caution that our results were obtained given the current distribution of hospitals performing emergency laparotomy. It is not clear that our results would apply in the same way after a potential service reconfiguration that might change the pattern of travel times to emergency laparotomy.
There may not be a distance effect for emergency laparotomy in England and Wales due to the distribution of hospitals and patients described. Compared with other high-income countries the UK has high population density and few hospitals that can be classified as remote.53 The findings of this study are of international relevance to populations where estimated travel is similar to the UK but are not generalisable to areas of extreme population dispersion or large geographical distances.
Although we did not find a significant distance effect on 30 or 90-day mortality, it is possible that other outcomes might be affected by distance to hospital. Associations between distance and adverse outcomes have been identified in non-emergency care, for long-term survival and quality of life.32
Meaning of the study
Compared with, for example, patients undergoing primary coronary angioplasty,16 24–26 where there is a clear time-critical pathology and treatment endpoint, it is likely that emergency general surgical patients will not have a predictable response to prehospital delay. This is because the emergency general surgical population include patients with a diverse range of pathologies.
This observational study cannot prove the null hypothesis, that travel time has no effect on short-term mortality, but suggests that any effect, if one does exist, is likely to be small. It is also important to note that we found that a significant proportion of the population live in proximity to multiple hospitals accepting acute general surgical patients. This finding is in keeping with previous reviews examining distances between home and emergency care in the UK.54 This suggests that in many cases, hospitals could be reconfigured into network arrangements without substantially impacting on the distance travelled to care. Having considered the potential risks, we can now consider the arguments for centralisation of emergency services. The main potential benefit is the concentration of care in specialist centres to improve quality and outcome. Separate analysis of NELA data5 has found interhospital variation in adjusted mortality, which can in part be explained by differences in care processes, associated structures and hospital characteristics. Another rationale for the reconfiguration of services is to separate emergency and elective care. Recent work has identified the presence of an emergency department as the single biggest risk factor for cancellation of planned inpatient surgery that may waste resources and cause harm or distress to patients.13
If quality of care can be improved by reconfiguring services, this must be balanced against any adverse effects of reduced access. Our study did not find a significant relationship between distance and mortality, but we do not know the impact on other outcomes such as inpatient complications and length of stay. Local care is often preferred by patients and they may be less likely to present for emergency care if they live further from hospital.55–57 Access is infrequently cited as a reason in reconfiguration decisions,58 and any benefits obtained might not apply to patients who live far from hospital.59 While it is true that some patients may prefer to travel further to centres that have lower perioperative mortality,60 61 on reviewing our findings, our patient representative emphasised the importance of local care for patients and their families.
Conclusion
In this study we did not identify an adverse effect of calculated travel time on short-term mortality following emergency laparotomy.
Data availability statement
Data may be obtained from a third party and are not publicly available. NELA’s funder and the data controller for NELA data is the Healthcare Quality Improvement Partnership. For access to NELA data see: www.nela.org.uk/NELA_Research.
Ethics statements
Ethics approval
NELA is approved by the Health Research Authority’'s Confidentiality Advisory Group for ‘Use of Patient Identifiable Information without Consent’' (Section 251 of NHS Act 2006 and Health Service (Control of Patient Information) Regulations 2002). This study received approval from the Healthcare Quality Improvement Partnership. Patient data are stored on a secure server and access is controlled in accordance with Caldicott principles.
Acknowledgments
Mr Russell Prestwich, NELA patient representative, for commenting on the draft manuscript; Clinical Effectiveness Unit of the Royal College of Surgeons for linking Office for National Statistics mortality data.
References
Footnotes
Twitter @CMOliver_, @RMOONESINGHE
Collaborators Members of the NELA Project Team during the data collection period of this study were: Mr Iain Anderson, Dr Mike Bassett, Mr Martin Cripps, Mr Paul Cripps, Professor David Cromwell, Mrs Emma Davies, Ms Sharon Drake, Ms Natalie Eugene, Mr James Goodwin, Professor Mike Grocott, Dr Sarah Hare, Dr Carolyn Johnston, Dr Angela Kuryba, Ms Sonia Lockwood, Mr Jose Lourtie, Professor S Ramani Moonesinghe, Dr Dave Murray, Dr Charles M Oliver, Mr Dimitri Papadimitriou, Dr Carol Peden, Dr Tom Poulton, Dr Tom Salih, Dr Kate Walker and Ms Susan Warren.
Contributors Conceptualisation: TS, SRM. Data curation: TS, TP, CMO, MGB. Methodology: TS, PM, SRM. Investigation: all authors. Formal analysis: TS, PM. Software: TS. Project administration: TS, SRM. Study supervision: PM, SRM. Validation: all authors. Visualisation: TS. Writing original draft: TS. Review/editing of manuscript: all authors. Local NELA leads and contributors to NELA data across England and Wales.
Funding The National Emergency Laparotomy Audit is commissioned by the Healthcare Quality Improvement Partnership as part of the National Clinical Audit Programme on behalf of NHS England and the Welsh government.
Map disclaimer The depiction of boundaries on this map does not imply the expression of any opinion whatsoever on the part of BMJ (or any member of its group) concerning the legal status of any country, territory, jurisdiction or area or of its authorities. This map is provided without any warranty of any kind, either express or implied.
Competing interests None declared.
Provenance and peer review Not commissioned; externally peer reviewed.