Article Text

Abstract
Objective To quantify variation of mean paediatric length of stay (LoS) among intensive care units (ICUs) in Australia and New Zealand.
Method Retrospective data from Australian and New Zealand institutions that admitted children to ICU were analysed. The data were collected between 1997 and 2006, providing a total of 123 institution years of data (an average of 6.15 years per site). Using 47 068 admissions, LoS was modelled as the outcome variable of a Γ regression with a child's risk factors entered as fixed effects (allowing adjustment for case mix) and variation among ICUs modelled using a random effect.
Results Six Australasian ICUs had an average risk-adjusted LoS for children, which was significantly shorter than average, whereas five had an average LoS that was significantly longer than average. The remaining nine sites had average LoS that were not significantly different from the average (at the 95% level). Among other risk factors, previous admission to an ICU and respiratory support within the first hour of admission were both associated with prolonged LoS.
Conclusion There was significant variation in paediatric LoS at the ICU level not accounted for by patient case-mix. This has important implications for efficiency of ICU processes and, possibly, other components of quality of patient care in those institutions with longer LoS.
- Quality indicators
- paediatrics
- length of stay
- intensive care
- healthcare quality assessment
- quality of care
- outcome
- healthcare quality
- statistics
- patient outcomes
Statistics from Altmetric.com
- Quality indicators
- paediatrics
- length of stay
- intensive care
- healthcare quality assessment
- quality of care
- outcome
- healthcare quality
- statistics
- patient outcomes
Increasingly, healthcare providers are interested in reliably measuring their performance and quality of patient care.1 2 To review quality of care, quantifiable indicators must be identified and measured.3 4
The importance of length of stay (LoS) as a performance indicator in the intensive care unit (ICU) is twofold. First, it relates to the efficiency of the intensive care process, and thus cost within the ICU and the institution overall. According to a US study, ICUs comprise 10% of hospital beds, but they consume around 20% of a hospital's budget.5 Most of the cost associated with ICU patients is related to nurse time required for patient care, which is a direct function of patient LoS.6 Second, it may serve as an indirect marker of the quality of care; more effective therapy results in more rapid recovery, whereas complications and errors potentially result in extended LoS.4 7 8
For objective comparison of performance among institutions, outcomes such as LoS require adjustment for patient case-mix.9–11 Risk-adjustment models can be used to account for much of the variability in patient case-mix as well as other admission factors, such as source of admission, and used to obtain reasonable estimates of the effect of the institution on patient LoS. Quantification of institution-level variation of patient LoS among ICUs has important implications for healthcare management. In particular, it can serve as a tool for recognition of potentially inefficient practice and suboptimal quality of patient care.
The aim of this study is to quantify the variation of mean paediatric LoS among ICUs in Australia and New Zealand.
Methods
The data
The Australian and New Zealand Paediatric Intensive Care (ANZPIC) Registry collects data from the nine dedicated paediatric ICUs (PICUs) in Australia and New Zealand and data from multiple general ICUs that admit children. Data from 11 of these general ICUs, plus the 9 PICUs, were included in this analysis. The registry comprises patient de-identified records stored in a Microsoft Access database and complies with the minimum guidelines for health registers, as developed by the National Health Information Management Group. Patient data are extracted from source data by individual ICU nurse researchers or data managers and submitted to the central registry. All data are subjected to quality checks before being approved as cleaned and uploaded into the registry. To improve data integrity further, and to reduce inter-rater discrepancy, ICUs have periodic external auditing of a random selection of source records, and data collectors participate in training sessions provided by the registry.
Cleaned data from all Australian and New Zealand ICUs participating in the registry were analysed. The data were collected between 1997 and 2006, providing a total of 123 institution years of data (an average of 8.67 years per PICU and 4 years per general ICU). For PICUs, the average number of admissions per year per facility ranged from 320 to 1121 admissions. For general ICUs, the average number of children admitted per year per facility ranged from 8 to 143 admissions.
Inclusion criteria
The records of all admissions to ICUs participating in the ANZPIC Registry were extracted. For inclusion in the study, children must have been aged less than 16 years at time of admission.
Mean LoS in the ICU might be confounded by patients who die. Given short LoS is considered as a marker of efficiency, patients who die quickly within the ICU may provide false evidence of efficiency. Patients who die in the ICU represent a distinct population that warrant separate investigation and modelling approaches. For these reasons, children who died in the ICU were excluded from this study.
Children with a LoS less than 2 h were excluded because it was considered that these did not represent true ICU stays. In addition, those children who were recorded as still in ICU or who were transferred to another ICU were excluded from this analysis as their LoS could not be reliably quantified. Finally, those children staying longer than 28 days (<1%) were excluded as these may unduly influence model parameter estimates.12 13
Variable selection
The variables used are described in table 1. Univariate analyses were performed to identify risk factors associated with LoS using the Mann–Whitney U test for binary variables14 and univariate Γ regression for categorical and continuous variables. Risk factors with an associated p value <0.2 were included in the multivariate analyses. Only variables present in at least 90% of patients were considered for inclusion in the model.
Description of variables in the ANZPIC Registry
The child's principal diagnosis at admission was assigned using the ANZPIC Registry diagnostic coding, which has been previously described.15 Given LoS is approximately lognormal, for this variable, the geometric mean LoS for each diagnostic code was determined and the conditions were grouped into quintiles. The ANZPIC Registry diagnostic coding has been provided as an appendix with the diagnostic grouping information and geometric mean LoS for each condition.
Model development
The data were split using stratified random sampling (with the ICU as the stratum) into two subsets to be used for model building and validation. The skewed distribution and heterogeneity of LoS (see fig 1) poses difficulty for statistical modelling.16 The Γ distribution has been shown to be suitable for modelling LoS17 18; it is a two-parameter probability distribution governed by a shape and scale parameter.19 A Γ distributed variable with scale θ and shape k is denoted by Γ(k,θ), where the mean is kθ, the variance is kθ2and the probability density function is given by
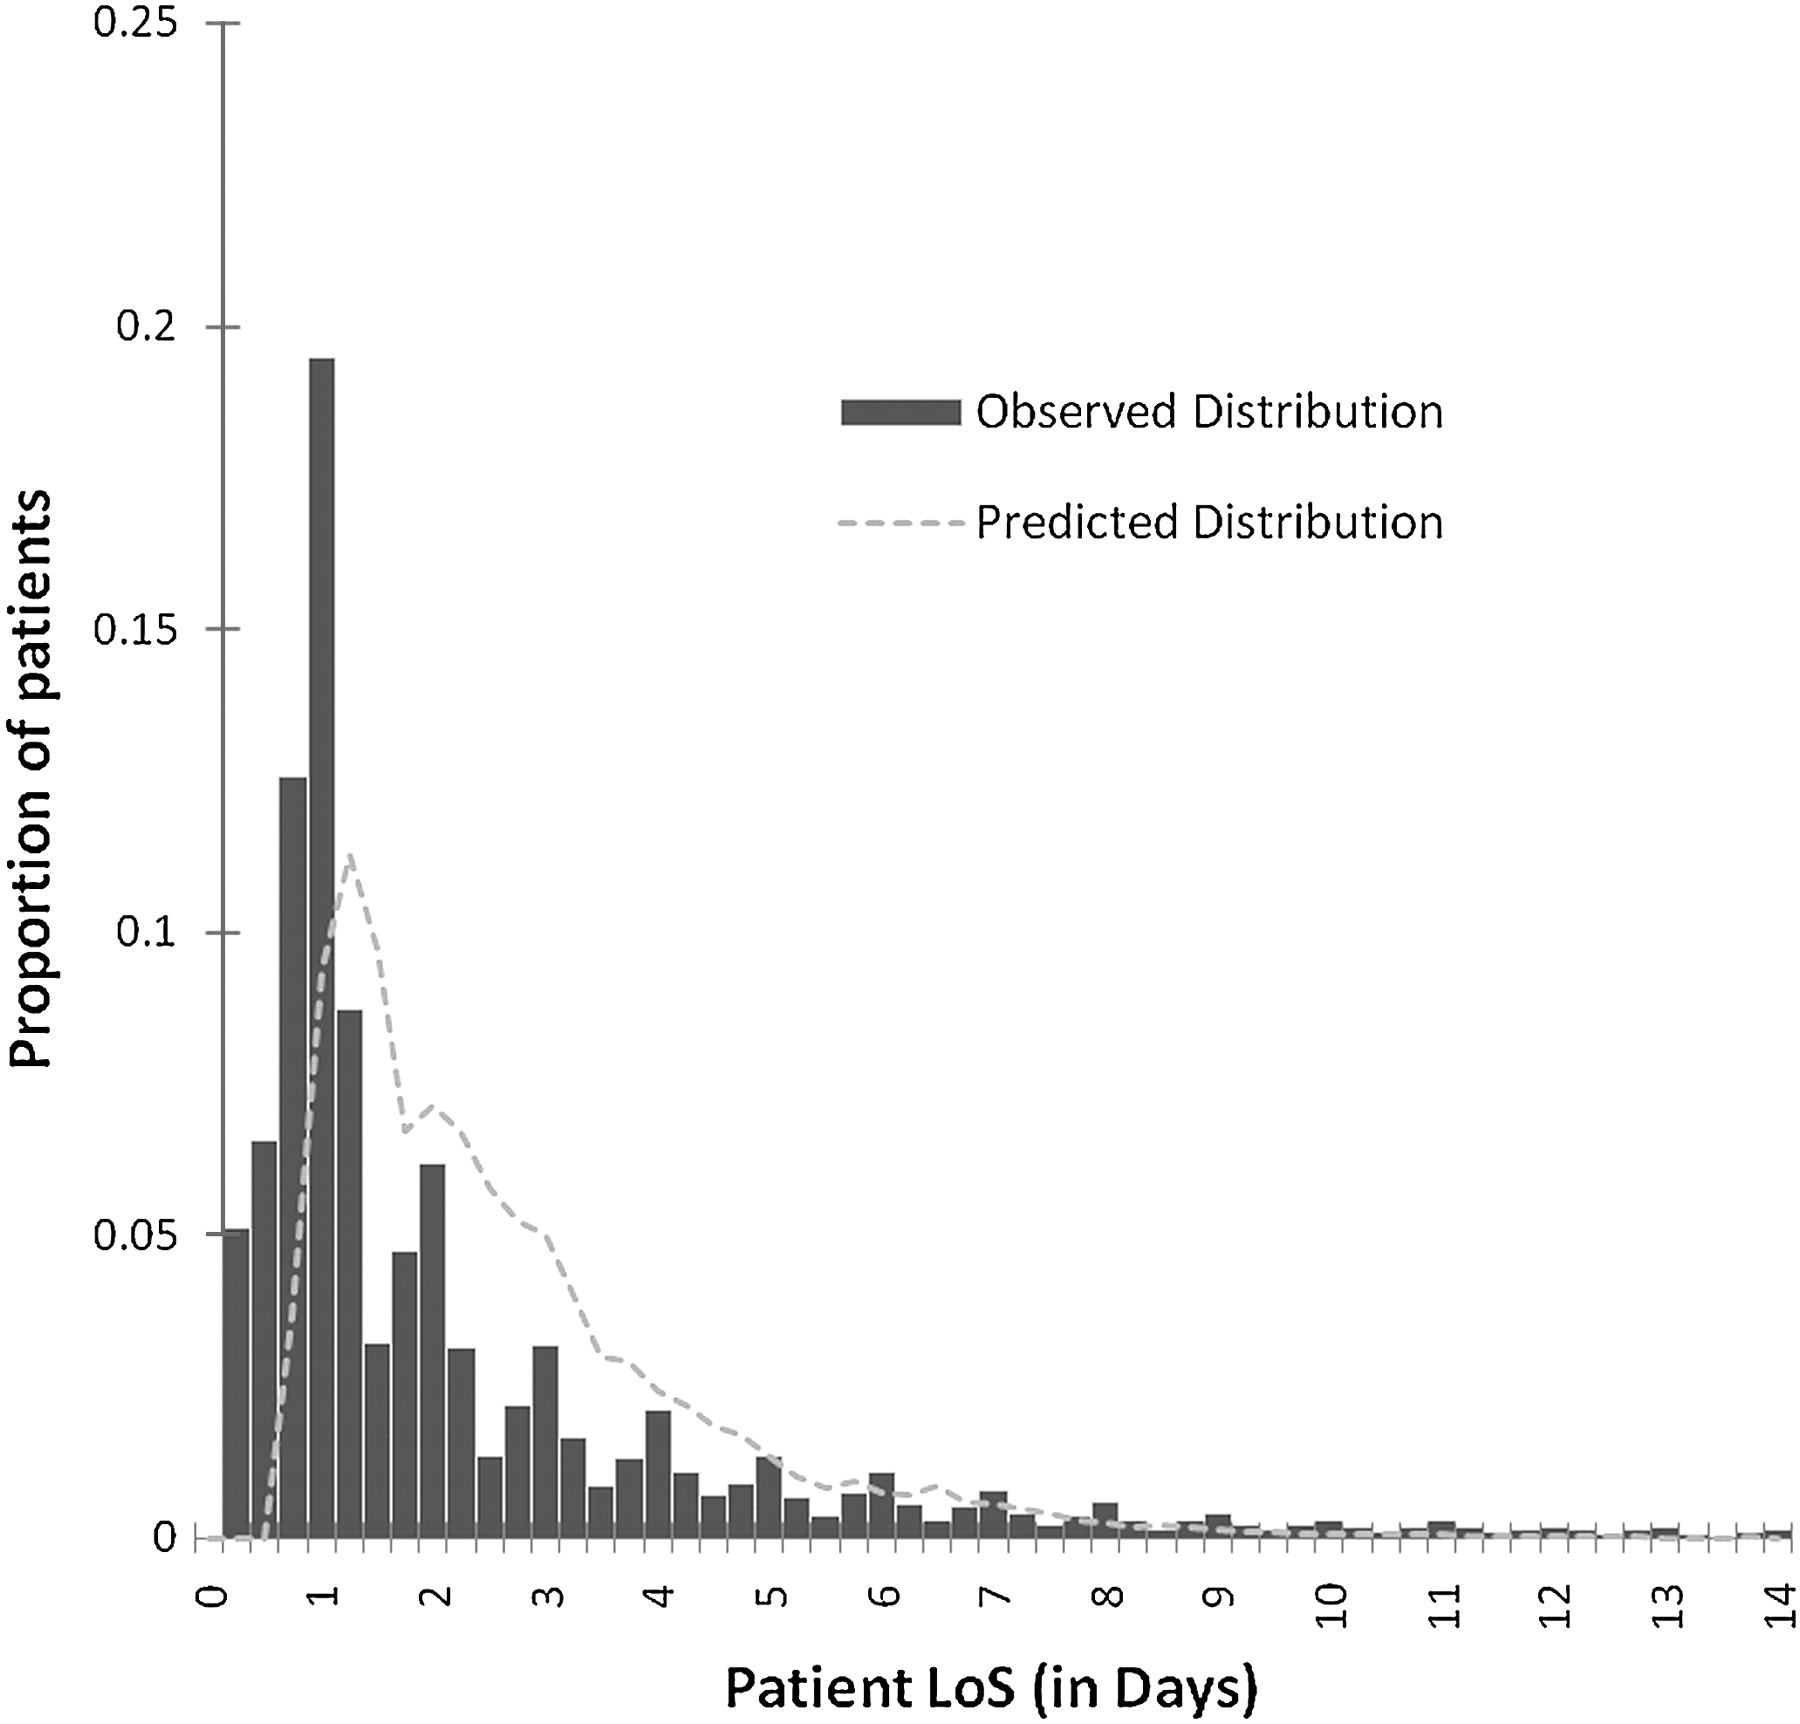
Distribution of observed and predicted length of stay (truncated at 14 days) using a mixed-effects Γ regression model for children admitted to intensive care units in Australia and New Zealand, 1997–2006.
The relationships between patient LoS and associated risk factors were modelled by a Γ mixed effects regression, where log(E(Y)) is modelled as a linear function of the covariates. To quantify variation among ICUs, random effects (u) for each site were incorporated into the model. Unlike a fixed effect, the random effect's value varies depending on the site and estimates the ICU effect on LoS after adjusting for patient factors. Let Y|;xijk represent the ICU LoS for the j‘th patient in the k‘th ICU where i represents the i‘th covariate (1, 2, 3, …, 20).
All potential variables were inserted into the saturated model, and backward elimination was used with an exit criterion of p>0.05. Sex was eliminated during this process, with all remaining predictor variables being significant.
The complete data set (including building and validation subsets) was used for the final model. Complete-case analysis used 47 068 observations (of 51 125).
Validation
Internal validation was used to assess the performance through application of the model derived from the building sample to the validation sample. In the manner of Tu and Mazer,20 the discriminatory capability of the model was assessed using a receiver operating characteristic curve. Observed LoS, dichotomised at the median (1.125 days), was taken as the comparison variable and area under the receiver operating characteristic curve of >0.7 was considered to indicate acceptable discriminatory performance.21 Lin's concordance correlation coefficient was used to quantify the correlation between the observed and predicted values at the individual patient level. The concordance correlation coefficient measures the strength of agreement along the identity line, whereby 1 indicates perfect agreement and −1 indicates perfect disagreement.22 The distribution of the observed and predicted LoS is shown in fig 1. An adjusted pseudo R2 was calculated using the method for Γ models described by Mittlbock and Heinzl.23
Results
The building model gave reasonable estimations of the mean LoS for sites in the validation set. The area under the receiver operating characteristic curve was acceptable at 0.809 (95% confidence interval 0.803 to 0.814). However, the concordance correlation between the predicted and observed LoS in the validation sample was modest at 0.38.22 These results suggest that the model had acceptable performance in discriminating between LoS that were shorter and longer than the median but was less effective in predicting the actual LoS. The pseudo R2 for the final model was 0.19.
Fig 2 presents box plots of the observed and predicted distributions of LoS by facility. In every ICU the predicted median was higher than the observed. This was due to the presence of long-stay outliers in the observed not being well predicted by the model.

Box plot showing distributions of observed and predicted length of stay for children admitted to intensive care in Australia and New Zealand, 1997–2006.
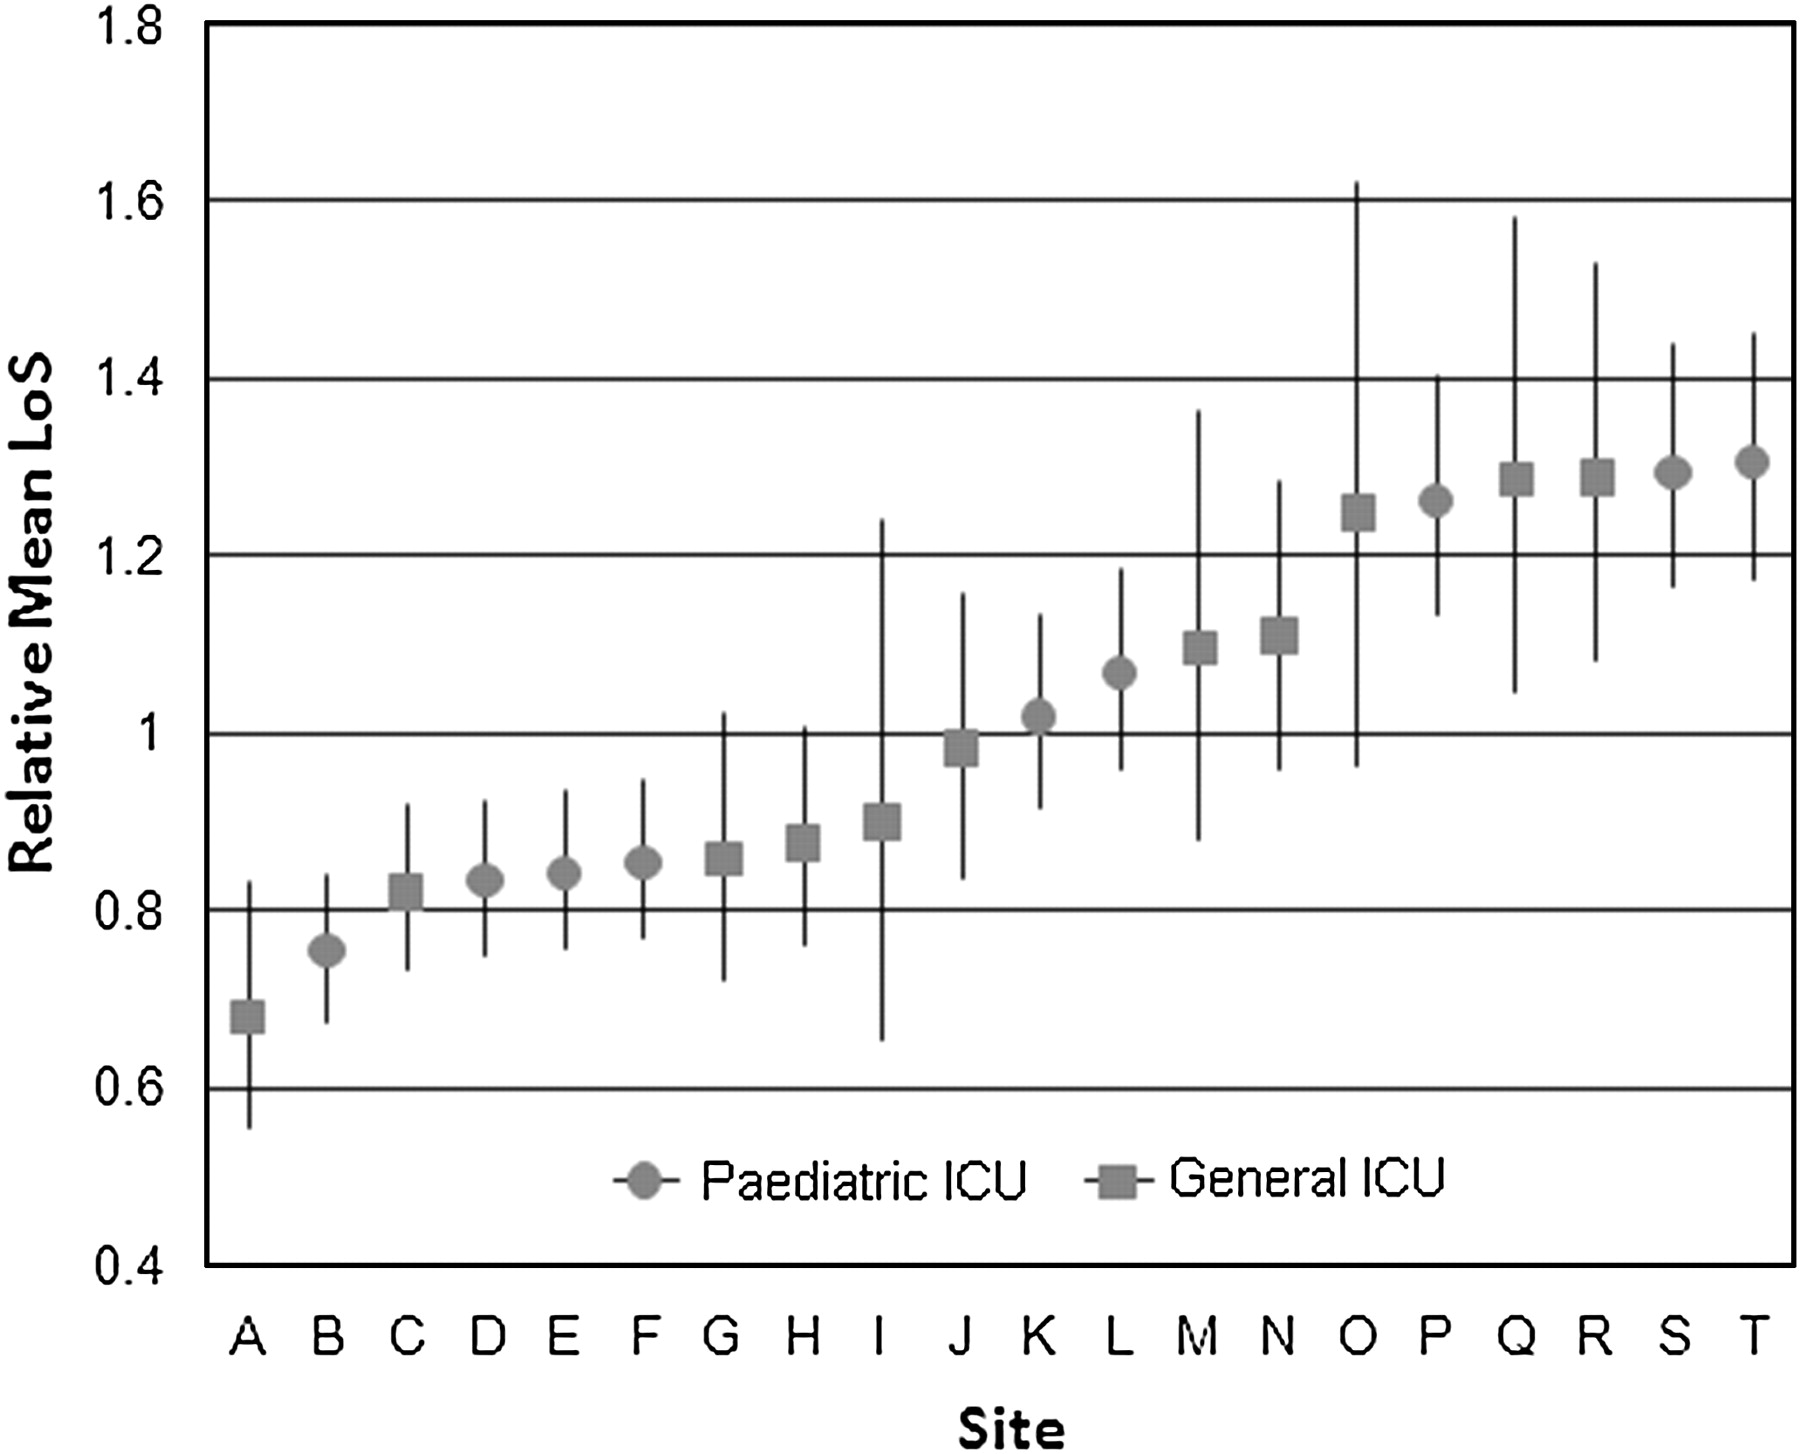
The final model is presented in table 2. Notable factors associated with prolonged LoS were previous admission to an ICU and respiratory support within the first hour of admission. The multiplier effect of each variable on a child's LoS is indicated by exp(β)—for example, conditional on other risk factors, a child who receives respiratory support within the first hour of admission will be expected to have approximately twice the LoS of a similar patient who does not receive respiratory support (exp(β)=1.97). The random intercepts for ICU site were estimated by the final model and the antilog of the random effect for each ICU is presented with 95% confidence limits in fig 3. The site effect has a multiplier effect on mean LoS; a site effect of 1.5 indicates that patients are, on average, likely to stay 1.5 times longer than would be expected compared to the risk-adjusted mean LoS for the total population.
A mixed-effects Γ regression model of paediatric length of stay in intensive care units in Australia and New Zealand
Site-specific random effect, indicating intensive care unit variation in risk-adjusted length of stay for children admitted to intensive care in Australia and New Zealand, 1997–2006.
After adjusting for patient characteristics at time of admission, five sites (sites P–T; three paediatric and two general ICUs) had significantly longer mean LoS and six sites (sites A–F; four paediatric and two general ICUs) had significantly shorter mean LoS than the population mean. The remaining sites had an average LoS that was not significantly different from the population mean at the 95% level. The pattern of variation was similar among general and PICUs.
Discussion
ICU LoS can be estimated using Γ mixed-effects modelling, with the random effect serving to quantify variation in patient LoS among ICUs. Our model revealed significant differences in risk-adjusted average LoS between ICUs admitting children in Australia and New Zealand.
The possible reasons for this variation in LoS are diverse. First, LoS is affected by many intrinsic patient factors. Although our model accounts for some of these, there may be variation in patient case-mix not explained by the variables available in our analysis. One advantage of our LoS model is that it uses routinely collected data on PICU patients in Australia and New Zealand. However, there may be variation in patient case-mix not explained by the variables available in our analysis. For example, our database included physiologic variables required for estimating the risk of mortality using Pediatric Index of Mortality 2 (PIM2), and it is possible that other physiologic variables not routinely collected for mortality risk adjustment are important predictors of LoS. In addition, the presence of comorbidities may be indicative of illness severity and thus influence LoS; however, because of data limitations, these were not investigated in this study. Second, the time of discharge for a given patient is based on a clinical assessment of patient risk; this decision will be influenced by variations in physician judgement. Third, the availability of beds24 and the level of care provided by post-ICU care facilities will affect discharge time. For example, the presence of a separate high-dependency unit in one hospital would likely bring forward the discharge time. Fourth, the efficiency and efficacy of treatment will impact time to patient recovery and subsequent discharge.25 Last, adverse patient outcomes, such as healthcare-associated infections, are known to prolong hospital and ICU LoS.26
Our model does not discriminate between these potential explanations but does confirm that such variation exists and that further investigation is warranted. If it were determined that the availability of general ward beds when patients were ready for discharge or that variability in physician practice were major contributors, then this would have implications for potential efficiency improvement. If it were determined that adverse events were major contributors, this would have implications for quality of care. Admission volume varied between units. A previous study found a small inverse relationship between admission volume and LoS.27 The potential impact of patient volume was not investigated in this study partly because the number of units would not have permitted a robust investigation of this relationship. Future work will aim to differentiate these important sources of variation in LoS among ICUs.
In this study we assumed that the clinical correlate equating to LoS was time to recover to the point where discharge from the ICU could occur. Cases where a child is transferred to another ICU do not represent the same clinical end point. For this reason, transfers were excluded; however, this represents only 1.5% of all patient admissions.
To date, there has been limited work to develop general models of LoS for PICU admissions. A previous risk-adjustment model for LoS in the PICU13 was built on the Paediatric Risk of Mortality score as an indicator of severity of illness. Similarly, in the adult ICU setting, the Acute Physiology and Chronic Health Evaluation score has been used to model LoS.28–30 The ANZPIC Registry uses PIM2 rather than Paediatric Risk of Mortality as the standard method for mortality risk assessment.31 In this study we found 10 variables that were predictive of LoS, 5 of which were also used in the PIM2 model. The commonality between PIM2 and LoS is largely because LoS is likely to be influenced by the severity of illness on admission.
Although our model was able to estimate LoS variation among ICUs, there were several limitations. Our model was not intended to be a prognostic model for individual patients; rather, it was designed to provide accurate estimates of variation among ICUs. Also, it was possible that systolic blood pressure (one of the covariates) was not missing randomly because patients considered likely to have normal measurements may have been less likely to have systolic blood pressure routinely measured. However, given SBP was missing in only 7% of cases, this is unlikely to have had a significant impact.
Conclusion
There was significant variation in patient LoS at the ICU level not accounted for by patient case-mix. Longer LoS than predicted at a given site may be due to factors including unexplained variation in case mix, differences in clinical practice, availability of step-down facilities or increased occurrence of adverse events such as infection.
Acknowledgments
We thank Dr Mark Jones and Mr Edward Tong for their statistical advice. We also acknowledge and thank the intensive care specialist, research nurses and other staff in the participating ICUs for their data contributions.
References
Footnotes
Funding LS's PhD stipend is funded by the Australian and New Zealand Intensive Care Society (Carlton, Victoria, Australia). The ANZPIC Registry is supported by the Australian and New Zealand Intensive Care Society, the Ministry of Health (New Zealand), and State and Territory Health Departments through the Australian Health Ministers’ Advisory Council.
Competing interests None.
Provenance and peer review Not commissioned; externally peer reviewed