Article Text

Abstract
Background We developed a method to estimate the expected cost-effectiveness of a service intervention at the design stage and ‘road-tested’ the method on an intervention to improve patient handover of care between hospital and community.
Method The development of a nine-step evaluation framework:
1. Identification of multiple endpoints and arranging them into manageable groups;
2. Estimation of baseline overall and preventable risk;
3. Bayesian elicitation of expected effectiveness of the planned intervention;
4. Assigning utilities to groups of endpoints;
5. Costing the intervention;
6. Estimating health service costs associated with preventable adverse events;
7. Calculating health benefits;
8. Cost-effectiveness calculation;
9. Sensitivity and headroom analysis.
Results Literature review suggested that adverse events follow 19% of patient discharges, and that one-third are preventable by improved handover (ie, 6.3% of all discharges). The intervention to improve handover would reduce the incidence of adverse events by 21% (ie, from 6.3% to 4.7%) according to the elicitation exercise. Potentially preventable adverse events were classified by severity and duration. Utilities were assigned to each category of adverse event. The costs associated with each category of event were obtained from the literature. The unit cost of the intervention was €16.6, which would yield a Quality Adjusted Life Year (QALY) gain per discharge of 0.010. The resulting cost saving was €14.3 per discharge. The intervention is cost-effective at approximately €214 per QALY under the base case, and remains cost-effective while the effectiveness is greater than 1.6%.
Conclusions We offer a usable framework to assist in ex ante health economic evaluations of health service interventions.
This is an open-access article distributed under the terms of the Creative Commons Attribution Non-commercial License, which permits use, distribution, and reproduction in any medium, provided the original work is properly cited, the use is non commercial and is otherwise in compliance with the license. See: http://creativecommons.org/licenses/by-nc/3.0/ and http://creativecommons.org/licenses/by-nc/3.0/legalcode
Statistics from Altmetric.com
Introduction
The decision to adopt a service level intervention turns on the evidence of its effectiveness. However, decisions also have to be made to develop an intervention in the first place, and on whether to continue development once started.1 ,2 This paper is concerned with estimating the potential cost-effectiveness of service interventions at the design and development stages, that is, at the formative stage before the intervention is rolled out in practice. This type of early economic evaluation would take place behind company doors in the case of pharmaceuticals. However, it can take place in the health services in the case of most service delivery interventions, which are typically developed ‘in the service, by the service, for the service’.3
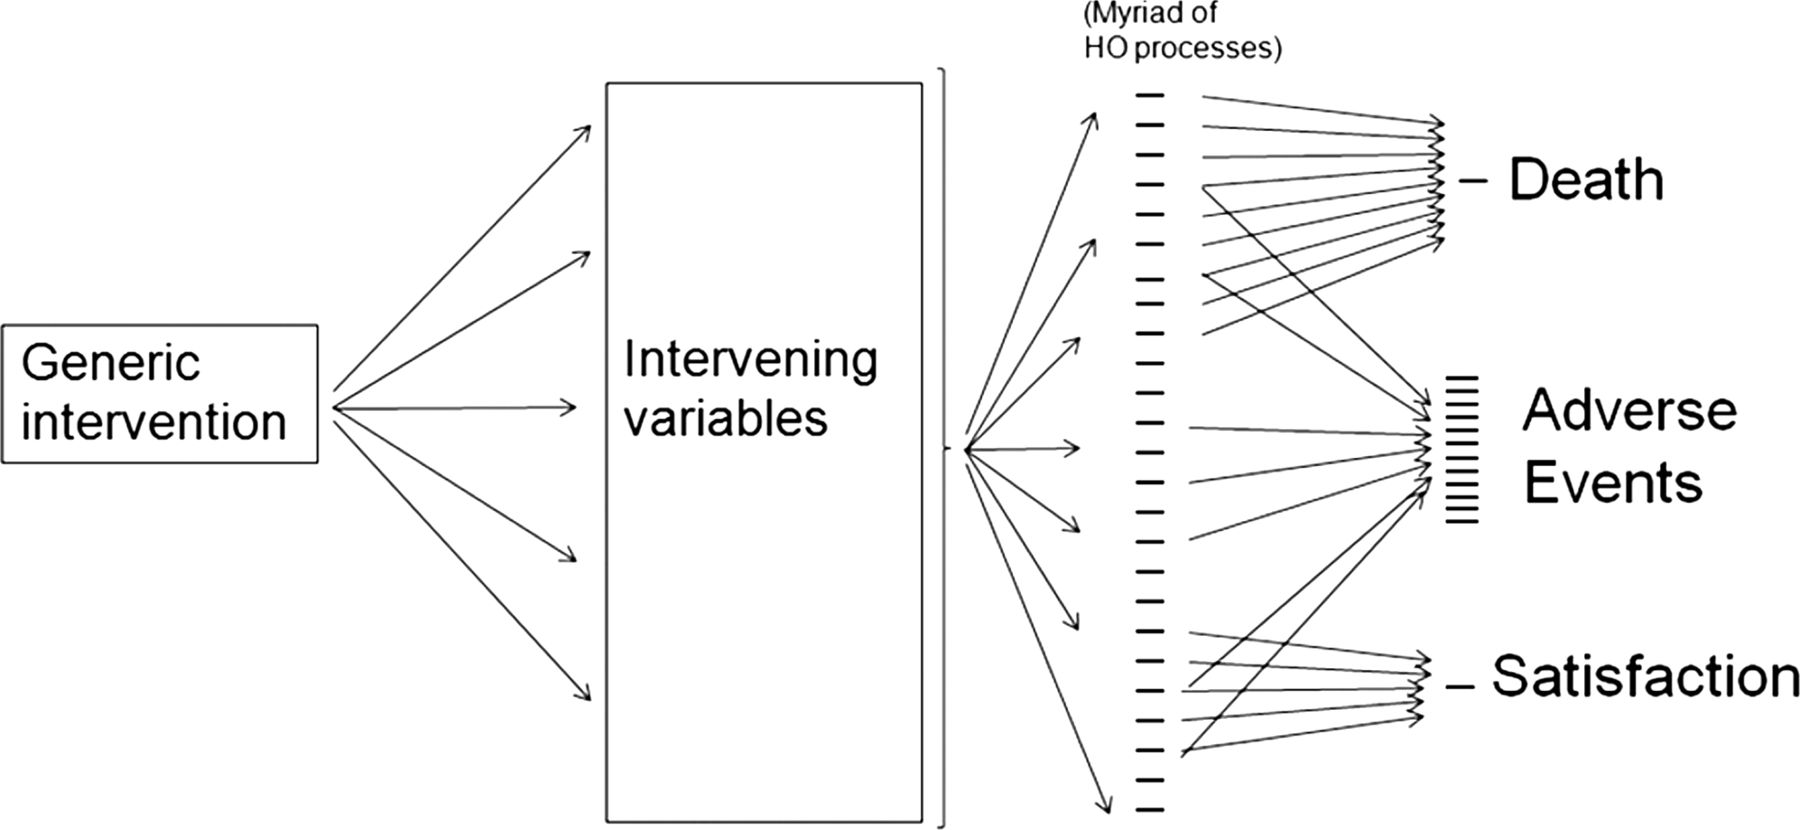
Service delivery interventions have been classified as targeted (near patient) and generic (far patient).4 Targeted interventions (eg, a guideline to use thromboprophylaxis before surgery, or a forced function to prevent misconnecting the oxygen supply) are relatively easy to evaluate for effectiveness and cost-effectiveness.5 However, generic interventions (such as an improved nurse-to-patient ratio, or changing safety culture) have diffuse effects that spread out to affect many clinical processes and outcomes, as shown in figure 1. A recent systematic review6 demonstrates that most economic evaluations of such interventions are based on cost minimisation only. These studies do not capture the non-monetary value of improved outcomes for which cost utility/benefit analyses are necessary. However, our recent review (Bramley and Lilford—in preparation) revealed no articles discussing the methodological implications of this type of study for generic service interventions. We found no articles dealing with preimplementation assessments of service delivery interventions. In this paper, we describe a method for prospective evaluation of generic service delivery interventions. We demonstrate how it can be applied using a particular generic intervention—the ‘HANDOVER’ project (http://www.handover.eu), as a case study. Briefly, this was a European Union funded project to develop an educational intervention to improve patient care at the point of discharge from hospital to the community; that is, a service delivery/educational intervention to improve clinical handover of the patient from one clinical microsystem to the next.7 The intervention was based on earlier (exploratory) studies conducted within the HANDOVER project itself, and also knowledge of the clinical and behavioural literature dealing, for example, with the importance of clinical skills8 and teamwork in improving clinical transitions.9 The HANDOVER project is described elsewhere in this issue of the journal, and in a report to the European Commission.10 We deal here with the most intensive form of the intervention, which consists of classroom instruction, supported by a number of internet-based educational resources known as the ‘Handover Toolbox’.

Representation of the widespread effects of a generic intervention. Endpoints such as mortality, or those measuring satisfaction partially measure the effect of the intervention. A sensible grouping of adverse events allows the measurements of different dimensions of effectiveness.
Methods
Framework for the evaluation of a generic service delivery intervention at the design phases
A framework for evaluation of a generic service delivery intervention was developed based on nine steps. The first step was concerned with identifying and classifying the endpoints for the evaluation. Steps 2–6 were used to derive input data. Steps 7–9 were concerned with the calculations of health benefit, net costs and cost-effectiveness.
Step 1: identification and classification of suitable endpoints
We selected endpoints on the basis of expert opinion informed by an inventory of endpoints identified from systematic reviews of the topic. As described above (and demonstrated in figure 1), the number of endpoints that might be affected by a generic service intervention is large when compared with those affected by targeted service or clinical interventions.11 Ensuring that the range of salient endpoints is captured requires expert knowledge. In the case of the HANDOVER project this was acquired from the scientific management committee, informed by an inventory of endpoints used in previous reviews.12–15 Service interventions are often designed to improve the quality and safety of care, that is, reduce the number of adverse events. Each of these events is associated with a possible contingent cost saving. In the case of a cost utility/benefit evaluation, each of these events has to be valued (in the sense that a preference weighting/utility must be assigned). It would be difficult to assign cost savings or utilities to each endpoint because there are so many. Yet, assigning one utility to cover all endpoints seems too coarse given the very different nature of the salient endpoints. Our solution was to categorise the endpoints, on the basis of the severity and duration of the associated morbidity, in order to provide a manageable number of categories.
Step 2: estimation of the baseline risk associated with each endpoint
The identification of suitable endpoints (or clusters of endpoints) is followed by an estimation of the baseline risk related to each. There are two kinds of baseline risk to consider: overall baseline risk for that endpoint, and the reversible component of that risk. This is analogous to the concepts of risk and attributable risk in classical epidemiology.16 In the service context, we are interested in the distinction between the bad outcome in question and the proportion of that bad outcome that is amenable to improved care (ie, that is preventable). For example, if the death rate is 10%, and 20% of those deaths are preventable, then the preventable risk is 2%.17 This establishes a plausible upper bound for the overall effectiveness of the proposed intervention.
Step 3: elicitation of expected effectiveness
Summative (demand-side) evaluation of interventions is based on direct empirical evidence, such as that derived from head-to-head comparisons. At the design and early development stages, however, such empirical evidence is absent or scant. Expert opinion must therefore suffice for formative (supply-side) evaluations. Such expert opinion must be quantified if it is to serve as the basis for a cost-effectiveness analysis. The necessary estimates of effectiveness should be elicited from domain experts who do not have a psychological or material personal stake in the outcome.18 ,19 Before they make their judgements, the experts should be party to a detailed description of the proposed intervention, and their knowledge should be brought up to date by drawing their attention to recent relevant reviews.19
The elicitation is typically used to construct a Bayesian ‘prior’ in the form of a ‘density’ of prior probabilities over a range of parameter values. The methods we used for eliciting a Bayesian prior have been described elsewhere.19 The centre of the probability distribution represents an expert's best guess for the effectiveness of an intervention. The priors from multiple experts can be amalgamated mathematically to yield a consolidated prior, the centre of which is a collective best guess on an effectiveness parameter. The statistical aspects of Bayesian inference are described elsewhere.19–22 Ideally, the elicitation should be repeated for each endpoint or endpoint type. Arguably, this requirement can be relaxed if the endpoints are all highly correlated and thought to belong to the same ‘latent class’.23
Step 4: estimating the utility values
The utility measures of disability in the case of clinical interventions are required for only one (or a small number of) health states. For example, patients with multiple sclerosis can be evaluated with respect to a disease-specific quality-of-life measure that has been mapped onto a utility scale. However, in the case of a generic service delivery intervention, such as a clinical handover intervention, a very large number of adverse events may be affected. Each event is associated with a loss of utility, but only a few of these have been calibrated. To circumvent the logistic problem of eliciting utilities for each and every adverse event, we recommended (above) that the adverse events be grouped into similar categories with respect to severity and duration, thereby limiting the number of states for which utility estimates must be obtained. These utilities may be estimated in one of two ways:
-
The disability category is assigned a ‘typical’ score on a generic quality-of-life scale (eg, EuroQol) that can be converted into a utility by means of a standard tariff;
-
A specific elicitation is made for the category, for example, by means of a standard gamble or a conjoint analysis.
Step 5: estimation of the costs of the intervention
Intervention costs are built up from fixed costs and variable costs in the usual manner. The fixed costs refer to the costs of the development, while the variable costs include the salary costs of the staff and materials deployed in delivering the intervention.
Step 6: healthcare costs associated with adverse events
Adverse patient events lead to increased health expenditure. The intervention costs are standard, but the costs generated through adverse events depend on the category of event; the more serious the event, the greater the costs associated with it on average. The estimates of costs associated with various types of endpoints may be available in the literature, and we were fortunate to find such a source of data for categories similar to those used in the HANDOVER study. In the absence of such data, we would have had to model cost-savings contingent on effectiveness (step 3) using national reference costs.
Step 7: expected health benefits and net costs
The expected health benefit (EHB) is a function of the expected effectiveness of an intervention. Resource allocation decisions require that the benefits resulting from changes in patient outcomes are captured on the same scale, for example, a Quality Adjusted Life Year (QALY) scale. Health states, each weighted by their corresponding utility value, are combined to produce the QALY. It is often convenient, for reasons we will explain below, to express the expected health gain as an expected monetary benefit (EMB). In order to convert a QALY gain to an EMB an assumption of societal willingness to pay (λ) is necessary:
The net costs are calculated by subtracting the health service costs saved from the intervention costs. While this is the standard method, it was necessary to repeat it for each of the severity and duration categories identified. The results were then combined, and weighted by the relative frequencies of the various categories.
Step 8: estimation of cost-effectiveness and cost-benefit analysis
Cost-effectiveness analysis is based on combining the costs and benefits to calculate an incremental cost-effectiveness ratio (ICER) in the usual way. Suppose an intervention incurs additional costs (or saving) over usual practice (at ΔCOSTs), and the improved effectiveness measured on the QALY scale is ΔQALYs. Then, the ICER can be expressed as
When the expected benefit is expressed as a monetary value, we can estimate the expected net benefit (ENB) from an intervention as follows:
Where λ is the society willingness to pay for a QALY gained.
Step 9: sensitivity analysis and headroom calculation
The above calculation can be repeated under various estimates of the effectiveness parameter drawn from the different points on the consolidated Bayesian prior. The headroom method is a way to explore the minimum health benefits that are needed to make an intervention cost-effective at a given level of societal willingness-to-pay value (λ). It can be calculated by the following equation:
If the minimum necessary health benefit lies outside the bounds (say 95% credible interval) of the collective prior, then the intervention is unlikely to offer good value for money.
Results—application of the framework to the empirical study
The HANDOVER project
The HANDOVER project described in the introduction and elsewhere in this issue was used as a case study for the nine-step framework described above.
Step 1: endpoints
The literature demonstrates that the patient readmissions and adverse events are the most frequent targets for interventions to improve patient handover.12 ,14 ,15 However, they are not independent, since preventable readmissions are contingent on preventable adverse events. The scientific management group for the study, therefore, selected adverse events as the salient endpoint, both to model benefits to patients, and to estimate the healthcare savings that result from the reduced hospital admissions.
There are hundreds of possible adverse events, and it was therefore decided to categorise them into a manageable number. The best known classification was that used by Brennan and colleagues in the famous Harvard Medical Practice Study.24 This system gives the relative frequencies in six categories of adverse events. Forster et al13 have produced an alternative system based on 400 patient discharges, specifically to assess adverse events following patient discharge, again with six severity levels. These two classification systems are placed side by side in table 1. We had to use expert judgement to ‘reconcile’ the two systems since they are different. For example, the proportion of deaths among patients who suffered adverse events, as cited by Brennan et al, seemed rather high at 13% for a discharge population; while no deaths, as found in the limited sample used by Forster et al, seemed optimistic. We therefore compromised at 5% (of the adverse events).
Comparison of two adverse event classification systems and the ‘reconciled’ version taken forward in this study
Step 2: estimation of the overall risk and preventable risk
We searched the literature and identified one paper by Forster et al13 in which the risk of adverse events following hospital discharge was estimated. The study found that at least one adverse event occurs in 19% of discharged patients within 1 month of discharge. These adverse events were preventable (ie, the result of a failure in handover practice) in approximately one-third of cases (ie, 6.3% of all discharges).13 The timeframe was considered appropriate as it has been shown that the risk of preventable patient readmissions following hospital discharge is much reduced after 1 month.25
Step 3: the expected effectiveness of the intervention
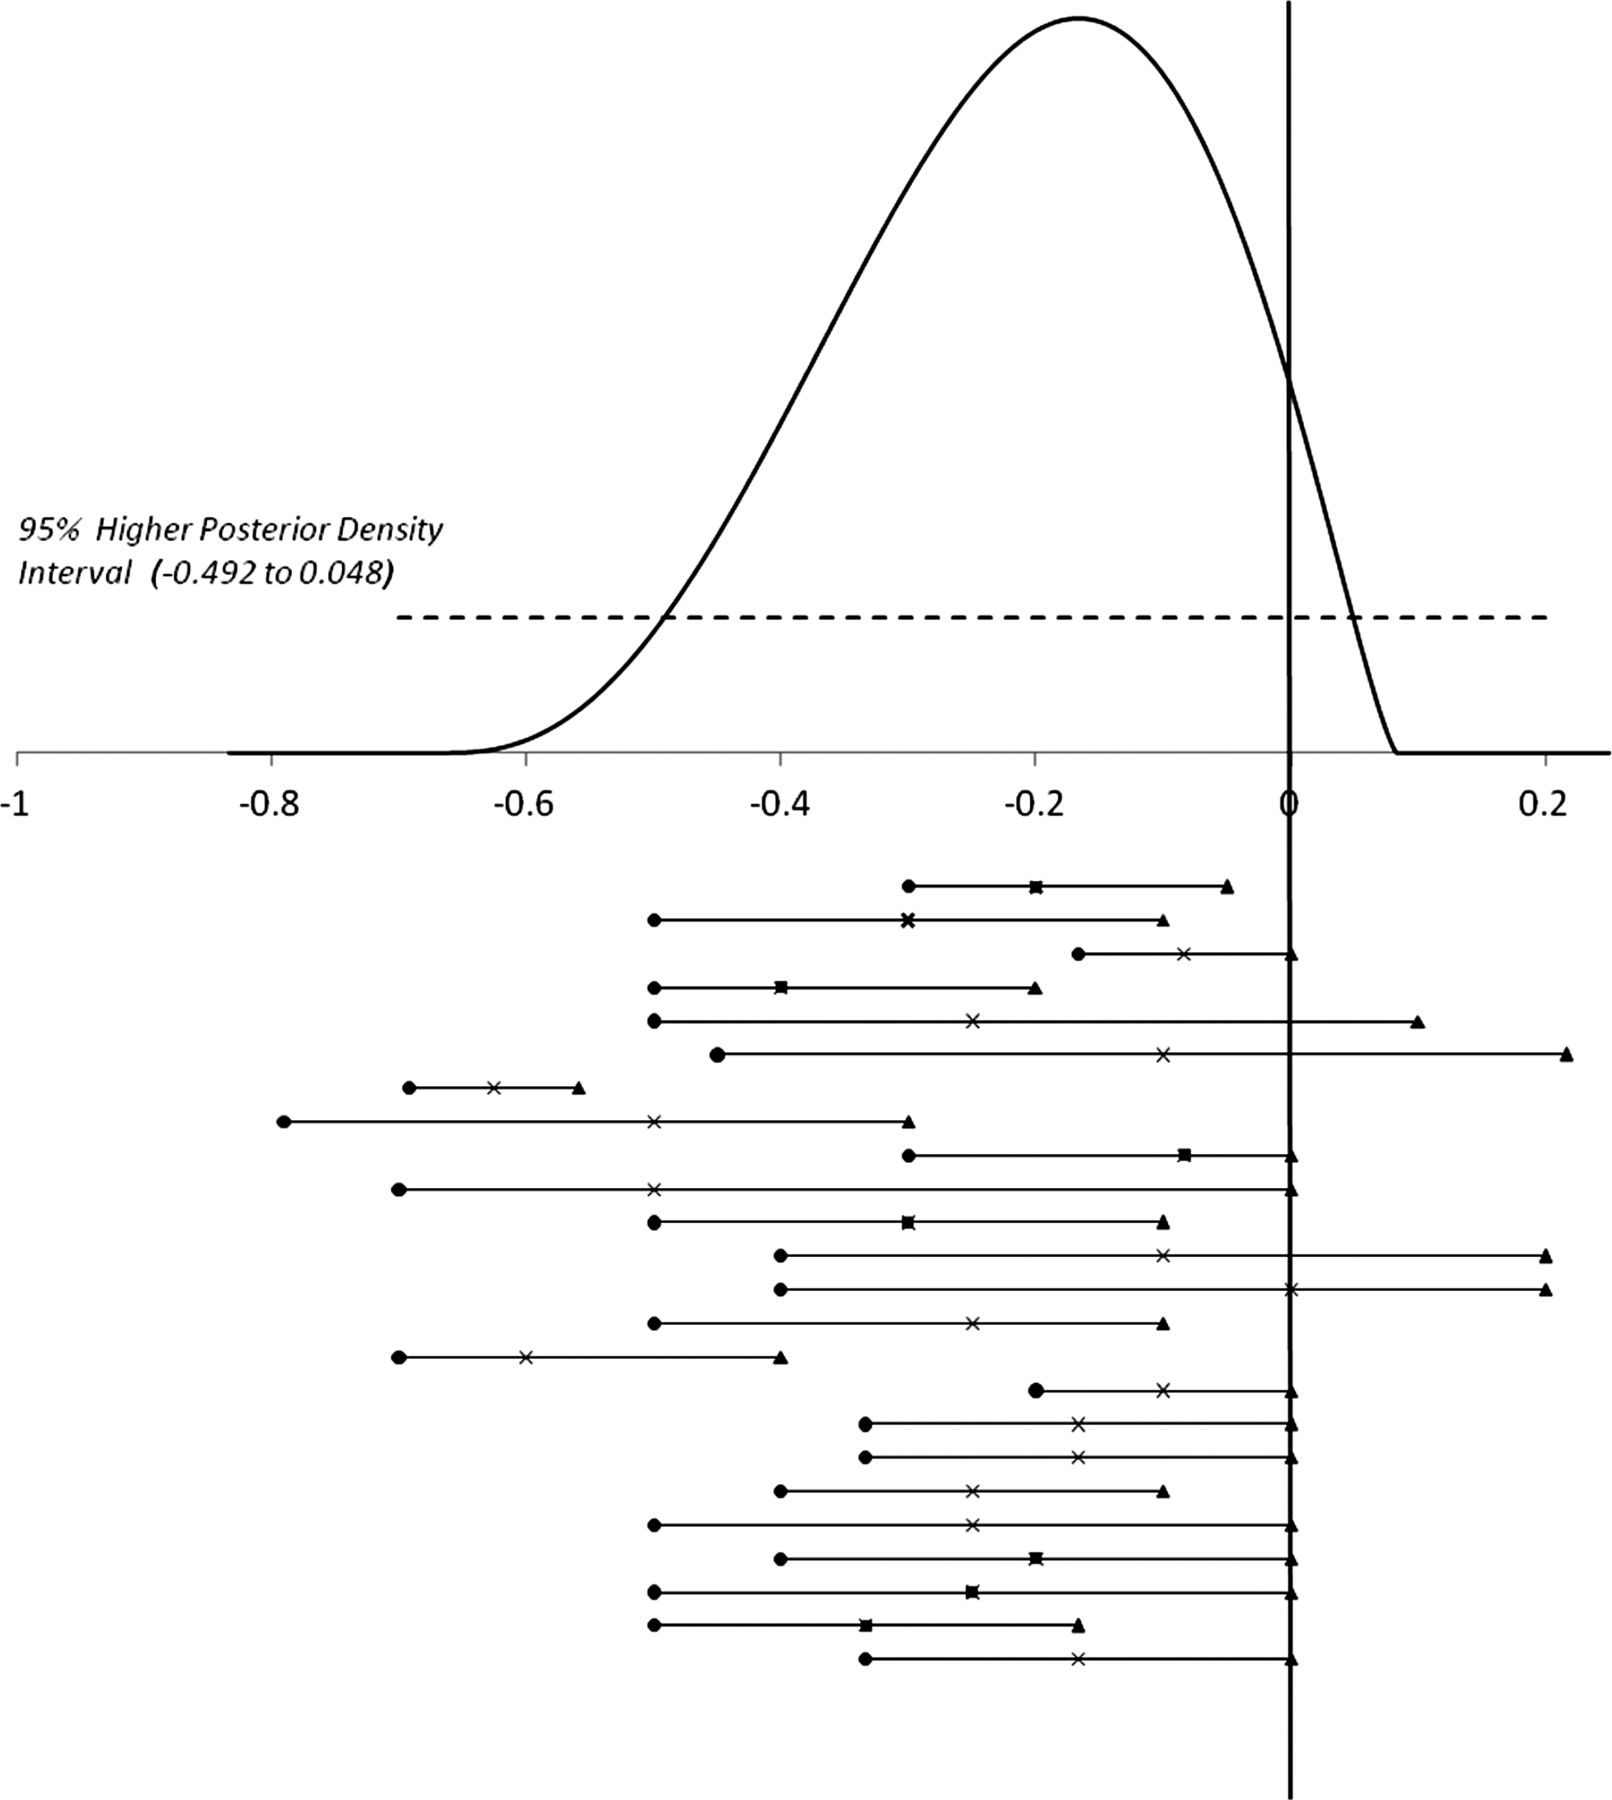
The plausible estimates for expected effectiveness were elicited from ‘experts’. The elicitation process is described elsewhere.26 Elicitation involved experts from Europe and the USA who attended a HANDOVER project conference. The intervention (see Introduction) was described by researchers leading the workstream responsible for development of the intervention. Usable estimates of the effectiveness of the intervention were given by 24 experts. The individual probability densities were consolidated statistically.27 The midpoint of this pooled prior indicates a 21% reduction in incidence of adverse events (figure 2). This represented a reduction from 6.3% to 4.7% for the risk of a preventable adverse event (an absolute reduction in risk of 1.3%). However, as shown in figure 2, there was considerable variation over the central estimate between experts. The experts also expressed considerable individual uncertainties. We made the assumption that the proportional risk reduction would be the same over various categories of adverse events.
Results of the exercise to elicit experts’ estimates on expected effectiveness. Above the x-axis: pooled expert opinion on the relative reduction of the attributable risk of adverse events as a result of the implementation of a proposed intervention to improve the quality of handover (mean −0.21 (21% reduction) and 95% Higher Posterior Density Interval (−0.492 to 0.048)). Below the x-axis: Best estimate (×), lowest (•), and upper (▴) plausible value of the relative reduction of the attributable risk of adverse events as a result of the implementation of a proposed intervention to improve the quality of handover, as elicited from each of the 24 experts.
Step 4: utility loss due to adverse events
The next step was to assign a utility function to the adverse events. First, each category of event was allocated to a ‘typical’ (indicative) state on a generic quality-of-life tool, the EQ5D. The result is shown in table 2. An additional health state, ‘minimal impairment,’ is not included, as generic quality-of-life instruments are not sufficiently sensitive to detect such a change.28 We therefore assumed a disutility of 0.05 for this health state (in our warfarin example below, this might correspond to a patient whose international normalised ratio (INR) is out of range, requiring an additional visit to the physician).
‘Typical’ EQ5D states associated with adverse events in each severity class, as defined by Brennan et al24
The utility associated with each health state identified in this way was obtained from the EQ5D manual, and then multiplied by the mean duration of the state in years (or fractions of a year) to provide an estimate of the QALY loss associated with each adverse event. It was assumed that a person can have only one adverse event.
Step 5: unit costs of the intervention
In this study, we considered a HANDOVER programme based on a facilitated classroom instruction supported by a suite of internet materials, as described in this issue and elsewhere.10 The unit cost (ie, cost averaged over discharges) for this resource-intensive form of the HANDOVER intervention has been explicated elsewhere for five European countries.29 The Netherlands study sample was selected as it was the country where the costs resulting from patient admissions due to adverse events were derived—see the next step. The unit cost for The Netherlands was €16.6.
Step 6: costs associated with each adverse event
We must also consider the possible savings contingent on reducing adverse events in each category. A recent European study by Hoonhout et al30 reported the mean cost of admissions associated with preventable adverse events by disability categories in 2003 to be €2979 in cases of no disability; €5973 in cases of minor disability; €6649 in cases of permanent disability; and €3831 in cases of death. Note that the study of Hoonhout and colleagues is relevant to our model since, like our model, it is based on preventable (not overall) adverse events. However, they used four categories, as opposed to Brennan et al who subdivided the permanent category into two. Moreover, Hoonhout et al deals only with cases requiring hospital admission, whereas Forster et al (see above), found that only one quarter of adverse events associated with handover resulted in patient readmission. The costs of attendance at the emergency department or doctor's office were provided by Tan et al31 We used our judgement to map all the above costs onto the adverse event categories identified above in step 1, as shown in table 3. All costs have been expressed in euros at 2010/2011 prices. An annual inflation rate of 3.5% was applied to convert the unit costs of adverse event categories from 2003 to 2011 values, thus corresponding to the year when the intervention was costed.
Calculation of QALY loss and healthcare costs associated with each patient who experiences an adverse event
Step 7: calculation of health benefit and cost savings
In table 3, we calculate the average QALY loss and the healthcare-associated costs for each patient experiencing an adverse event. The QALY loss is calculated over each category of adverse event, weighted by its probability among people with an adverse event. Patients who die or become permanently disabled are assumed to have a mean life expectancy of 10 years (see above) given that the incidence of adverse events associated with permanent disability and deaths is higher among patients aged >65 years.32 The estimated QALY loss per person that experiences an adverse event is 0.775, and the estimated associated cost is €1080 per person.
The QALY loss across all discharges is 0.15 (0.775×0.19). The QALY loss for all patient discharges due to preventable adverse events is 0.049 (0.775×0.063). If the intervention effectiveness is 21% (base-case scenario), then the QALY gain per discharged patient is 0.010 (0.21×0.049)—equivalent to one healthy life-year per 100 patient discharges.
The costs associated with adverse events (step 6 above) were mapped onto the severity categories, as shown in table 3. Avoiding adverse events can defray costs apart from those associated with readmission, especially in the case of events resulting in permanent impairment and lifelong rehabilitation. Our cost estimates are liable to underestimate total savings for this reason. The healthcare costs associated with preventable adverse events is €68 (1080×0.063) when averaged over all types of patient discharges. This amounts to €14.3 (68×0.21) given the base-case assumption on the effectiveness of the intervention. Since the unit cost of the intervention is €16.6, the net cost of the HANDOVER intervention is €2.3 (16.6–14.3).
Step 8: calculation of cost-effectiveness
The estimated results were based on the assumption of a large European (ie, The Netherlands) hospital with 50 000 discharges. The calculations for costs and benefits are given in table 4. In a hospital with 50 000 discharges each year, ineffective patient handovers result in a loss equivalent to over 7000 healthy life-years. It also results in nearly €3.5 million in health service costs that could be saved if all preventable adverse events were prevented. Under the base case, 21% of the above QALY loss can be averted (table 5). The expected cost of the intervention included the implementation cost of the HANDOVER project intervention and the cost released by the intervention. The unit cost per discharge for such a programme in The Netherlands is €16.6, and the cost for a hospital with 50 000 discharges is, therefore, €827 900 per year. This cost is subtracted from the cost savings from the reduced adverse events to give the overall net cost of the interventions. These results are given in table 5.
Calculation of cost-effectiveness measures (EMB and ICERs) for the intervention in a hospital with 50 000 discharges per year: the estimated total cost, QALYs, and the cost-effectiveness results
Calculation of cost-effectiveness measures (EMB and ICERs) for the intervention in a hospital with 50 000 discharges per year: Estimated costs per QALY at different levels of effectiveness
Last, the net costs and benefits are reconciled in table 6 to provide ICERs and ENBs. The proposed intervention under the base case (21% effectiveness) is highly cost-effective at only about €214 per QALY gain.
Calculation of cost-effectiveness measures (EMB and ICERs) for the intervention in a hospital with 50 000 discharges per year: Estimated cost-effectiveness measured in ICER and EMB
Stage 9: headroom and sensitivity analysis result
If the intervention were 100% effective in reducing preventable adverse events, it would ‘dominate’ (table 6)—it would be both effective and cost-saving, placing it in the southeast quadrant of the cost-effectiveness plane. Dominance is lost when effectiveness drops below 24.3% (table 5).
At the societal willingness to pay of €20 000 per QALY (a conservative assumption), the minimum effect the intervention must achieve to make it cost-effective is less than 1.6%. This reflects the low unit cost of the intervention (€16.6). Nevertheless, this represents a considerable outlay (€827 900) for a large (50 000 discharge) hospital. Under the base-case effectiveness estimate (21%), the intervention cost can increase to €220.36 before it becomes cost-ineffective at the given willingness-to-pay threshold.
We also subjected the life expectancy for people with permanent disability and who died, to one-way sensitivity analysis, assuming five- and 20-year time intervals. This resulted in ICERs of €412.67 and €109.14 per QALY, respectively.
Discussion and recommendation
This paper describes the economic evaluation methodology for generic service interventions. It goes beyond most economic studies by valuing the non-monetary benefits of a complex, social intervention. It is novel in that it deals with the methodology for such studies, and focuses on the formative (preimplementation) stage of a new service. At this stage, it is necessary to estimate the effectiveness of the intervention on the basis of expert opinion. We considered it desirable to describe baseline rates for selected endpoints, and to identify the preventable (attributable) component (that is, the proportion of endpoints that result from failure of the process at which the intervention is targeted). We believe this is necessary to inject realism into the process and attenuate overoptimistic estimates by focussing respondents’ minds on the component of the endpoint that is amenable to service change.
For the HANDOVER intervention, the magnitude of the expected effects of the proposed intervention is modest (a 1.7 percentage point (ie, absolute) reduction in all adverse events). However, the model demonstrates that such an effect would, nevertheless, be highly cost-effective. The analysis shows that even small benefits (less than a 2% relative risk reduction or 0.3% absolute risk reduction in adverse events of all types) can be cost-effective for an intervention that will cost a hospital over €800 000. The small effect sizes that may be cost-effective for generic service delivery interventions have been pointed out before.4 However, this previous study did not take into account the health service savings that are achieved when adverse events are avoided. The result is that health service interventions will frequently be cost-effective at low magnitudes of effect, and may dominate. Although the intervention was cost-effective at an effect size of less than 2%, it had to be nearly 25% effective (ie, 1.7% absolute risk reduction) to be cost-releasing.
An intervention that might sound very expensive at the institutional level is modest when costs were hypothecated for individual patients. Under the base case, the HANDOVER intervention would be cost-effective up to approximately €220 per patient—modest when compared with clinical interventions, but a ruinous €11 million when applied to a hospital with 50 000 discharges per year. These costs may be even harder to bear when savings do not accrue to the institution that bears the cost.
A corollary of these findings is that studies to detect minimum magnitude of effects that justify their cost need to be very large to avoid type 2 error—that is, a false null result. Studies demonstrating that adverse events can be reduced from a baseline of 19% to a rate of 17.7% (ie, the 1.3% reduction posited in the base case) would require 14 060 observations, both before and after the intervention at an alpha of 0.05 and a beta of 0.8. A less biased study with contemporaneous controls would require a much larger sample size,34 and would be difficult to organise given the clustered nature of the data. Likewise, detecting the less than 0.3% absolute improvement level at which the intervention becomes cost-effective would be a totally quixotic undertaking. Even after full implementation, the cost-effectiveness of inexpensive interventions may have to be modelled, rather than estimated directly from observations of improved outcome for patients. The model developed at the outset can be repopulated as development proceeds and information of various sorts gradually accumulates.3 This evidence may be surrogate evidence for patient outcomes. Such evidence is collated at the system level, upstream of the patient, as described elsewhere.4 While evidence on effectiveness may be very difficult or impossible to obtain, other potential inputs to economic models, such as prevalence rates of adverse events and costs, can be obtained at lower cost and/or with less difficulty.
Limitations of this study
This study is an ex ante evaluation and, therefore, by definition, encompasses many unavoidable uncertainties. This is the first study we know of to attempt an ex ante health economic assessment of a proposed service delivery intervention. It builds on methods we have developed for the device industry.3 ,35 ,36 The main problem we have encountered is the large number of potential adverse events, and many of the limitations stem from this conundrum. Since there is little literature to guide us in this area, we had to break new ground, and we do not claim to have provided the definitive solution. The approach we have taken is to group adverse events by severity and duration. This approach is associated with many challenges:
-
Baseline rates of preventable adverse events have to be apportioned across the categories, and this had to be induced from indirect evidence as described.
-
Ideally, separate Bayesian densities for effectiveness estimates should be elicited for each group—we assumed a common effect across groups. Severe and minor errors are not well correlated,37 and adverse event categories may be affected differently by a given intervention.23
-
Different utilities are needed for each group, and these do not appear to be available in the literature—for example, they are not available in the Tufts database.38 We imputed EQ5D scores in an ad hoc way and translated these into utilities by applying the standard conversion factor (tariff). Clearly, it would have been preferable to obtain these estimates from a more representative sample of respondents. If the idea of categorising endpoints catches on and a classification system can be agreed upon, then a formal study of utilities associated with different types of adverse events (and according to how they arise) would be needed.39
-
Cost savings are very different for each category. Hoonhout et al's study hypothecated costs on categories of adverse events, but the categories he used did not map precisely onto the categories we used (based on the Harvard Medical Practice Study). Furthermore, the costings in Hoonhout et al's study omitted costs of long-term care, loss of earnings, and litigation.
-
The average life expectancy of people who survive with permanent disability was difficult to ascertain, and there will always be a problem in estimating life-years lost in people who die following adverse events.
At the very least, our paper demonstrates the need to develop a consensus on the intellectual framework for assessing the outcomes of complex service and safety interventions, and then to set up epidemiological studies to collect data in the requisite form.
Conclusion
We have argued for the utility of a predevelopment economic evaluation of service interventions, and described a method for achieving this. We applied the methodology to a clinical handover intervention aimed at improving transfer of patients from hospital to the community. Adverse events constitute the outcome of interest, but our major challenge was to deal with the wide range of such events. We think that the method we have proposed shows promise, but it is in its infancy and much more work is necessary to develop supply-side health economic modelling for service delivery interventions. However, refinements in the method will not overturn one stark conclusion—service delivery interventions are cost-effective at small absolute effect sizes and at costs that cannot be borne under current thresholds used to ration new treatments.
Acknowledgments
We thank all the members of the European HANDOVER Research Collaborative for their participation in this study. Paul Barach, Loes Pijnenborg, Julie Johnson, Beryl Göbel, Cor Kalkman, Basia Kutryba, Julie Johnson, Halina Kutaj-Wasikowska, Ewa Dudzik-Urbaniak, Marcin Kalinowski, Francesco Venneri, Giulio Toccafondi, Antonio Molisso, Sara Albolino, Hub Wollersheim, Gijs Hesselink, Lisette Schoonhoven, Myrra Vernooij, Marieke Zegers, Helen Hansagi, Mariann Olsson, Susanne Bergenbrant, Maria Flink, Gunnar Ohlen, Carola Orrego, Rosa Sunol, Oliver Groene. We would also like to thank Melita Shirley (University of Birmingham) for aiding in the preparation of this manuscript.
References
Footnotes
-
Contributors GLY refined and executed the economic model; NN collected and analysed Bayesian priors and developed first iteration of economic model; SMH provided editorial assistance; YFC conducted the systematic review; MvdK developed the intervention; PB provided editorial assistance and was the principal investigator of the HANDOVER intervention; PC provided editorial assistance and verified calculations; RJL provided the original concept of the study, was primary author of the manuscript, and oversaw the evaluation/economic work package of HANDOVER.
-
Funding This study was supported by a grant from the European Union, the Framework Programme of the European Commission (FP7-HEALTH-F2-2008-223409); by a National Institute of Health Research (NIHR) Programme Grant (RP-PG-1209-10099), Investigating the implementation, adoption and effectiveness of ePrescribing systems in English hospitals: a mixed-methods national evaluation; The EPSRC MATCH project and by the NIHR Collaborations for Leadership in Applied Health Research and Care (CLAHRC) for Birmingham and Black Country.
-
Competing interests All authors have completed the Unified Competing Interest form at http://www.icmje.org/coi_disclosure.pdf (available on request from the corresponding author), and all authors want to declare (1) Financial support for the submitted work was supported by a grant from the European Union, the Framework Programme of the European Commission (FP7-HEALTH-F2-2008-223409); by a National Institute of Health Research (NIHR) Programme Grant (RP-PG-1209-10099), Investigating the implementation, adoption and effectiveness of ePrescribing systems in English hospitals: a mixed-methods national evaluation; the West Midlands Quality Institute; and by the NIHR Collaborations for Leadership in Applied Health Research and Care (CLAHRC) for Birmingham and Black Country; (2) No financial relationships with commercial entities that might have an interest in the submitted work; (3) No spouses, partners or children with relationships with commercial entities that might have an interest in the submitted work; (4) No non-financial interests that may be relevant to the submitted work.
-
The study sponsors had no role in the study design; collection, analysis and interpretation of the data; or in the writing of the article and decision to submit the article for publication.
-
Provenance and peer review Not commissioned; externally peer reviewed.